Portable hiking weather station MiniBTH2 / 2M
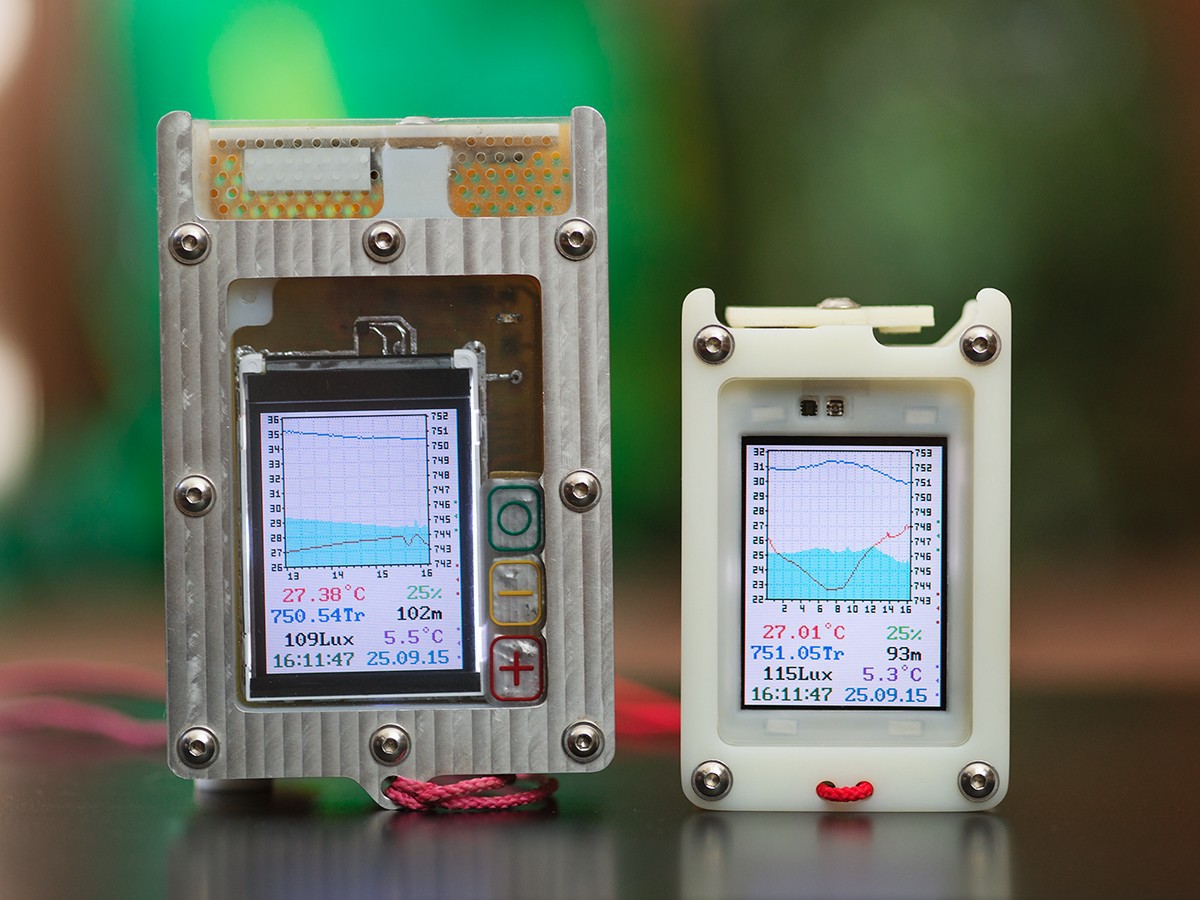
The previous article described the history of creation and experience of using the weather station miniBTH. This device measures and continuously displays on a screen in the form of graphs the current atmospheric pressure, temperature and air humidity. All measured parameters are saved to the memory card once a minute. In addition, an ambient light sensor is present in the device, and data from the pressure sensor can be recalculated to a barometric altitude. Thanks to the use of a transflective screen, instrument readings are easily readable even in bright sunlight, and the instrument case is sealed. The experience of using this device turned out to be generally positive, but a number of shortcomings were identified, which were discussed in detail in the previous article, the main of which is a lot of weight. In this article we will consider the creation and operating experience of the second, more convenient and functional version. Note that at the time of writing of the last article, the second version of the device was already in a high degree of readiness, therefore, the main ways to overcome the shortcomings were briefly described there.
The first weather station MiniBTH was conceived as an autonomous device, designed primarily for use in hikes. That is why the device case was made airtight, a transflective screen was used, and the battery capacity was calculated for more than a month of work. The main disadvantage of the first version, in my opinion, was a lot of weight, so I decided to make the second version as compact and light as possible. To do this, you need to dissolve the device board as small as possible: a little more than the screen, and make the case as thin and simple as possible. The electronic and software part will be discussed later, but for now let us turn to the design of the housing of the second version of the device. The main ideas for reducing the size of the hull were as follows:
')
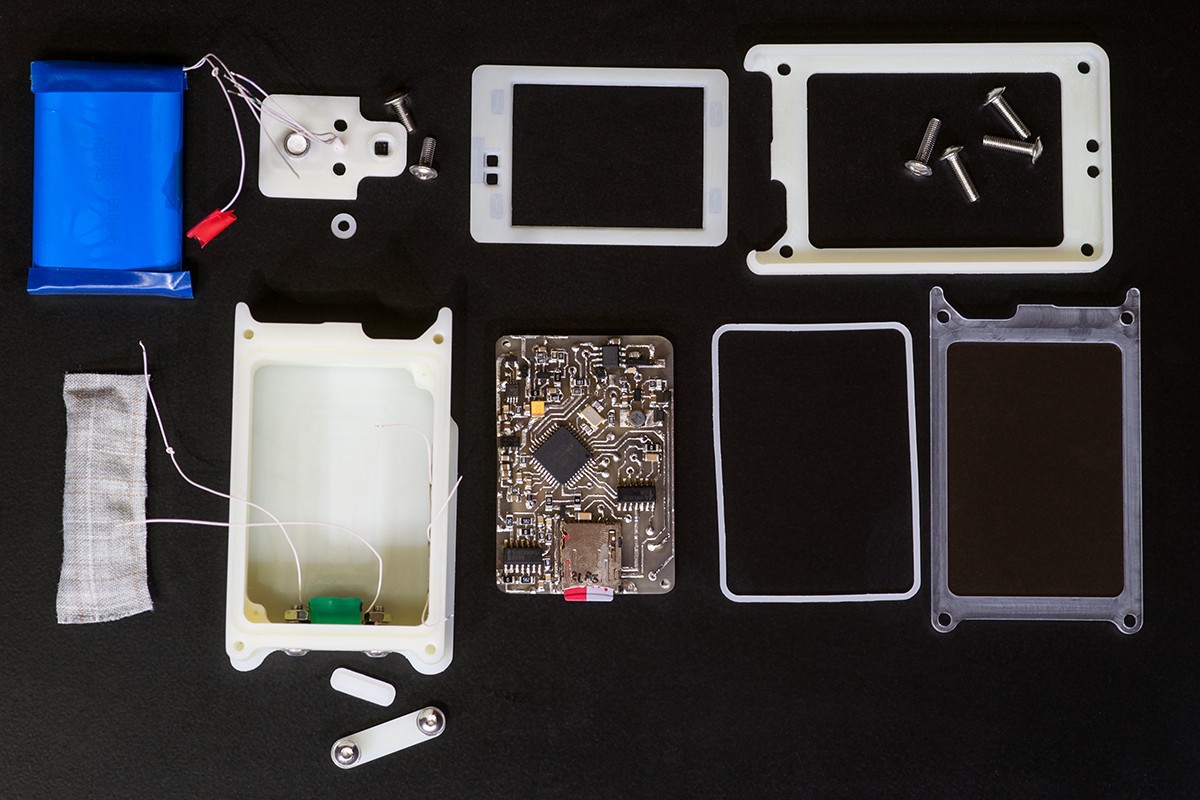
As a result, it was possible to link the proposed ideas to each other and make a rather compact body of corporal of the following design:
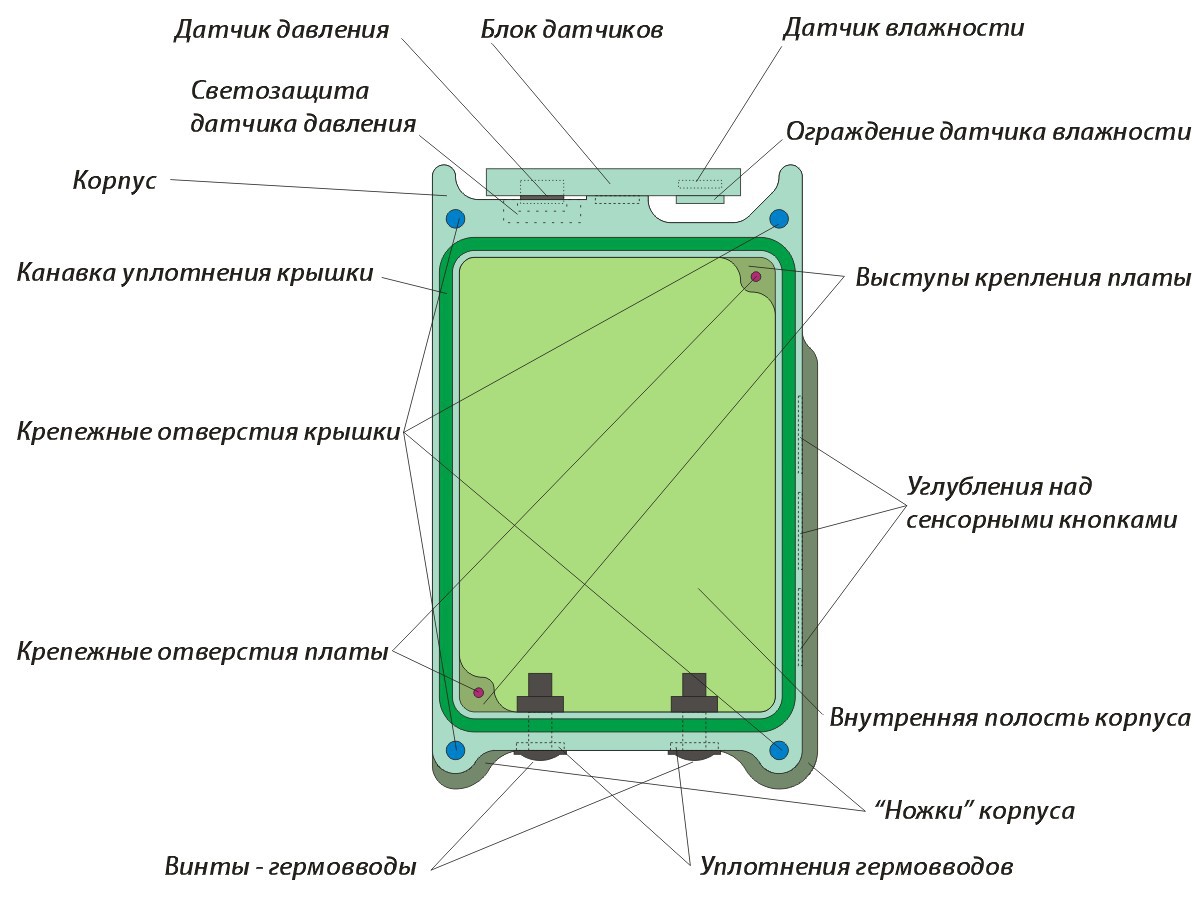
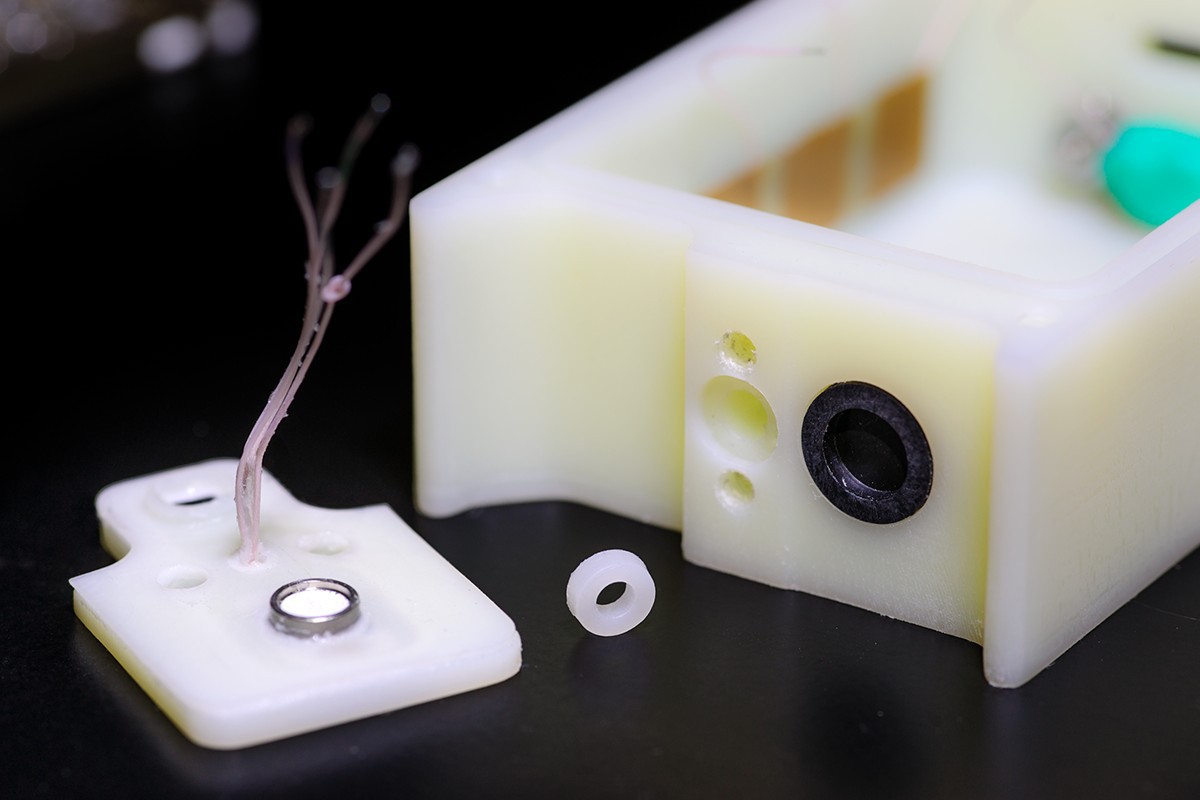
The sensor unit is assumed to be removable, is attached to the case with two screws, and the tightness of the docking of the sensor unit and the case is provided by an annular gasket through which the wires pass. A set of sensors is used the same as in the first version of the device - the pressure sensor MS5803 and the humidity sensor sht21. The sensor block itself is glued with sealant from two capralon covers. Between them is placed the board on which the sensors are mounted. The board is made of fiberglass 0.75mm thick. During assembly of the unit, to protect the humidity sensor from vapors emitted by the sealant, its window was sealed with Kapton adhesive tape (as recommended in the documentation).
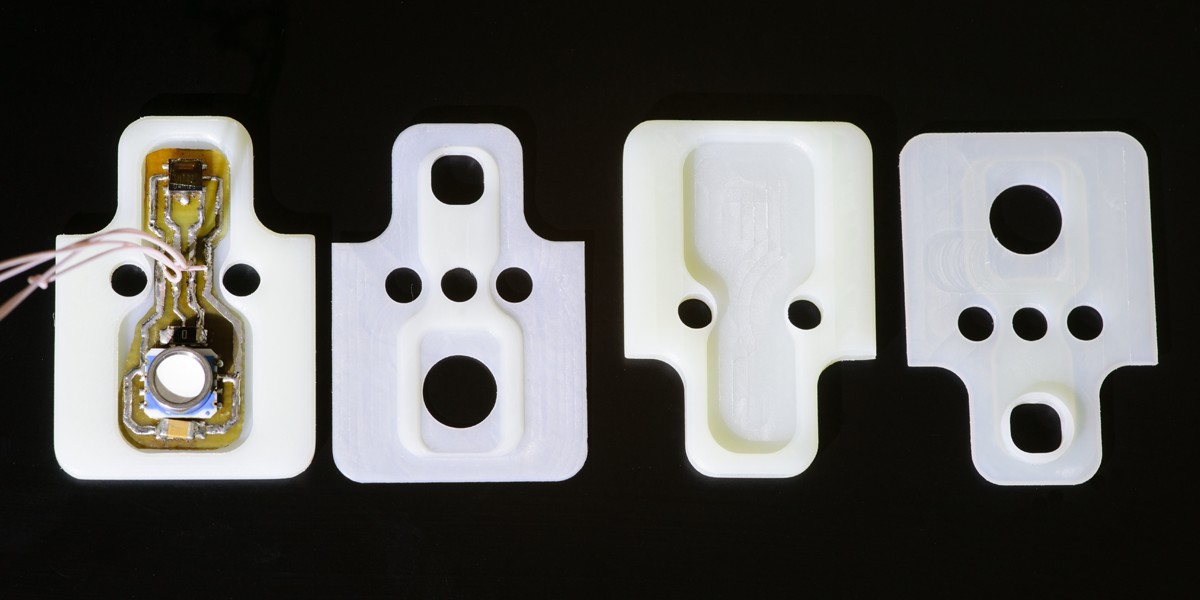
The design of the sensor unit takes into account the shortcomings identified during the operation of the first version of the device. The humidity sensor is not covered with a mesh cap SF2, but simply placed in the recess of the unit. This solves the problem of cap wetting, which leads to prolonged “sticking” of the moisture readings at the maximum mark, and at the same time, the sensitive side of the housing in the groove makes it possible to prevent its damage by external objects. On the sensor unit of the device version 2M, an additional protrusion is provided to protect the humidity sensor from damage with long thin objects. The issue of protecting the pressure sensor MS5803 from direct sunlight is also resolved at the design stage of the device. The sensitive part of the sensor is covered with a cap of black polystyrene, glued into the recess in the housing. Since the sensor is sensitive to flare and on the reverse side too, the metallization is left on the board at the place of its installation from the opposite side.
Air access to the pressure sensor is via a thin (0.5mm) channel between the instrument case and the sensor unit. It should be noted that when choosing such a design of the sensor unit, there were concerns that water would flow into a thin gap between the sensor unit and the instrument case in the rain, and completely block the air access channel directly to the pressure sensor, which would cause a systematic error in the pressure readings due to surface tension of water. Tests of instruments in the rain and in the shower showed that due to the non-wettability of the corporal, at a channel thickness of 0.5mm no leakage occurs. More thorough experiments have shown that if the sensor unit is installed with an inclination and thus reduces the thickness of the channel until it touches the edge of the sensor unit of the case, water may leak into the device and leads to a decrease in pressure reading of approximately 0.7mm Hg. If the sensor block is installed smoothly, water does not flow.
At first glance, the front cover and the seal changed little in appearance, but when designing it, a number of new technical solutions had to be applied. On the one hand, reducing the number of clamping screws and increasing the distance between them requires a more rigid clamping frame and / or a softer sealing gasket to ensure compression of the gasket along its entire length. On the other hand, for reasons of ease of use, it was decided to make the clamping frame plastic, and this, on the contrary, will reduce its rigidity. A possible solution to this contradiction is to use a softer rubber gasket. This option is more reasonable than trying to put “crutches” in the form of inserting rigid metal inserts or elastic elements into the pressure frame design and using the same hard drive belt from the tape recorder as a seal.
After a brief search on the Internet, a solution was found on how to make rubber pads by yourself. There are special two-component silicones used for making molds and gaskets. The technology of working with these silicones is briefly as follows: two liquid components must be mixed together, after which they should be poured into a mold for several minutes and wait until the composition hardens. After hardening, a very flexible and soft silicone rubber is obtained, which is easily separated from the form in which it hardens. There are whole lines of such silicones from different manufacturers, they differ in the type of catalyst-hardener used and the physicomechanical and chemical properties of the resulting rubber. All silicones have an elongation at break equal to hundreds of percent, are relatively soft, can work at temperatures up to 200 degrees Celsius, and are relatively chemically resistant. Platinum catalyst silicones are more chemically resistant and have food tolerance. One of the typical applications of such silicones is the manufacture of molds for casting from plaster, cement, soap, or even chocolate. The second typical application is the production of gaskets.
I found a supplier in my city that offers a whole line of Sk-76x silicones with a tin catalyst, and Sk-790 silicone with a platinum catalyst. For the experiments, I purchased two sets - silicone with a platinum catalyst Sk-790 and the softest silicone Sk-762, and began to experiment with the casting.
In my case, making a mold for casting did not pose a problem; I simply profiled the grooves of the desired shape in a sheet of polymethyl acrylate. Initially, it was supposed to pour silicone into the mold and cover it with a second flat sheet of organic glass on top, squeezing out excess silicone. However, it turned out that everything is not so simple, and I changed the technology somewhat. The main problem in the casting of silicone are air bubbles. They are formed both by mixing the starting components and by pouring the composition into the mold. One of the ways to combat bubbles, which is recommended by the manufacturer, is to place the silicone prepared for casting into a vacuum for several minutes before pouring. In a vacuum, all the bubbles swell and burst, and all the air escapes from them. Outwardly, it vaguely resembles running milk. To deal with bubbles that have arisen during pouring, you can evacuate the composition after pouring. However, I decided not to strain colleagues who have a vacuum chamber, and to look for an easier way to make castings without bubbles. This turned out to be not so difficult, because all the bubbles formed during mixing and pouring are quite large. Apparently, the viscosity of the silicone prevents the formation of small bubbles when trapping air or by crushing large bubbles. Therefore, the bubbles are quite clearly visible to the eye, and even have time to float a few millimeters up before the solidification of the silicone. Therefore, the technology of pouring is assumed to be the following: silicone is applied with excess along the groove in the mold, and after a few minutes, the excess silicone, together with all the bubbles, is removed with a metal spatula. If the bubble is stuck to the wall of the form, it can be removed using the same scapula. The top surface of the fill becomes smooth due to the action of surface tension forces and gravity. The main thing - evenly remove excess silicone from the top of the form. But if you cover the casting with a lid - there is a big risk to drive the air bubble into the mold.
Thus, the issue of manufacturing gaskets of any shape was resolved, which allowed us to choose any convenient version of the design of the front cover. A separate dilemma was the choice of material for the transparent part of the cover. There are two kinds of transparent materials available to me. One is a viscous and flexible polycarbonate, which, however, is not very resistant to mechanical stress and is not very transparent, but has a bluish tint. The second is transparent but fragile polymethylacrylate. Despite the fact that in the first version of the device polycarbonate was used, in the second I decided to use polymethylacrylate. On the one hand, it is more transparent, which improves the readability of the screen when illuminated with bright diffused light, on the other hand, it introduces less deviations in the readings of the light sensors. In addition, it is less scratched under similar operating conditions. To reduce the likelihood of cracking acrylate with a frontal impact and to improve the appearance of the device, the transparent cover is made thick (5 mm), and the pressure frame is planted on a special milled ledge. The top cover of this design turns out to be quite rigid, and can be used both with a soft gasket made of Sk-762 silicone and with a stiffer one of Sk-790. In the end, I decided to opt for silicone 790, because it is with a platinum catalyst and is chemically more inert.
The ability to cast gaskets of any shape allowed to make a hatch for quick access to SD, which was implemented in the version of the device 2M. Finally, the idea to make the flap took shape quite late, when the device version 2 was assembled and manufactured. Creating a flap rested on three problems - how to seal it, where to place it, and how to fix it. The first problem is solved by the manufacture of gaskets of the desired shape. The second problem was also solved, because in the recess on the lower side there is an empty space in which it is convenient to hide the lid protruding outside. I solved the third problem in my simplest way - the flap is fixed with screws. On the one hand, you cannot open the key without a key, but accidentally it will not open either. Yes, and on the serial sealed gadgets, the covers are also often fixed with screws.
The hatch itself is located in the lower part of the housing, and is a through-milled hole of an oblong shape, with a T-shaped ledge in cross section, about which the gasket is crimped. From the outside, the gasket is pressed by the flat cover, which is fixed on the case with two M3x5 screws. The thickness of the bottom wall of the case is 5 mm, the depth of the ledge is 2 mm, the thickness of the uncompressed gasket is 2.5 mm, the thickness of the lid is 2 mm. The holes, in which the screws are not threaded, are recessed into the case by 3.9mm, the thread in them is cut to almost the entire depth. Threading on a CNC machine available to me is impossible, so it was done with the help of three specially sharpened taps and a screwdriver.
The finished housing was tested for tightness by immersion for 12 hours. Filter paper was used to detect possible leaks. Cases were sealed. To exclude condensation of water inside the case at low temperatures, a cloth bag with silica gel is placed in a free volume near the battery. Tests and further operation showed that no condensate is formed in the housing.
The electronic part of the second version of the device in terms of the solutions used is very similar to the first version. The ATmega1284p microcontroller operating at 8 MHz is used as the main processor.
All sensors and a DS1337 real-time clock are connected to it via the I2C bus. An additional signal with a frequency of 1 Hz is brought to a separate input of the processor microcontroller. This allows the use of sleep modes with the main clock generator stopped for better energy saving. The battery is charged using the max1879 controller with an external key, but now it is directly connected to the charger via a sealed lead-in. To indicate the charge current, a current-measuring circuit on the TS321 operational amplifier was introduced, completely analogous to that used in the first version of the device. The screen and the SD card are connected to the controller via a single SPI bus, but now the scheme provides for the ability to turn off the power of the SD card while it is not in use. The touch buttons on the phase detectors are similar to those used in the first version of the device.
The plates of the touch buttons are placed on the side panel of the device, and milling is made above them for easy blind search. There are still three buttons, the upper one is conventionally called “Enter”, the middle one is “-”, and the bottom one is “+”. Almost all the details of the device could be placed on the board with the size of 59x41mm with rounded edges. Only protective sapressory and coils L2-L3 are mounted directly on the screw - sealed inlets.
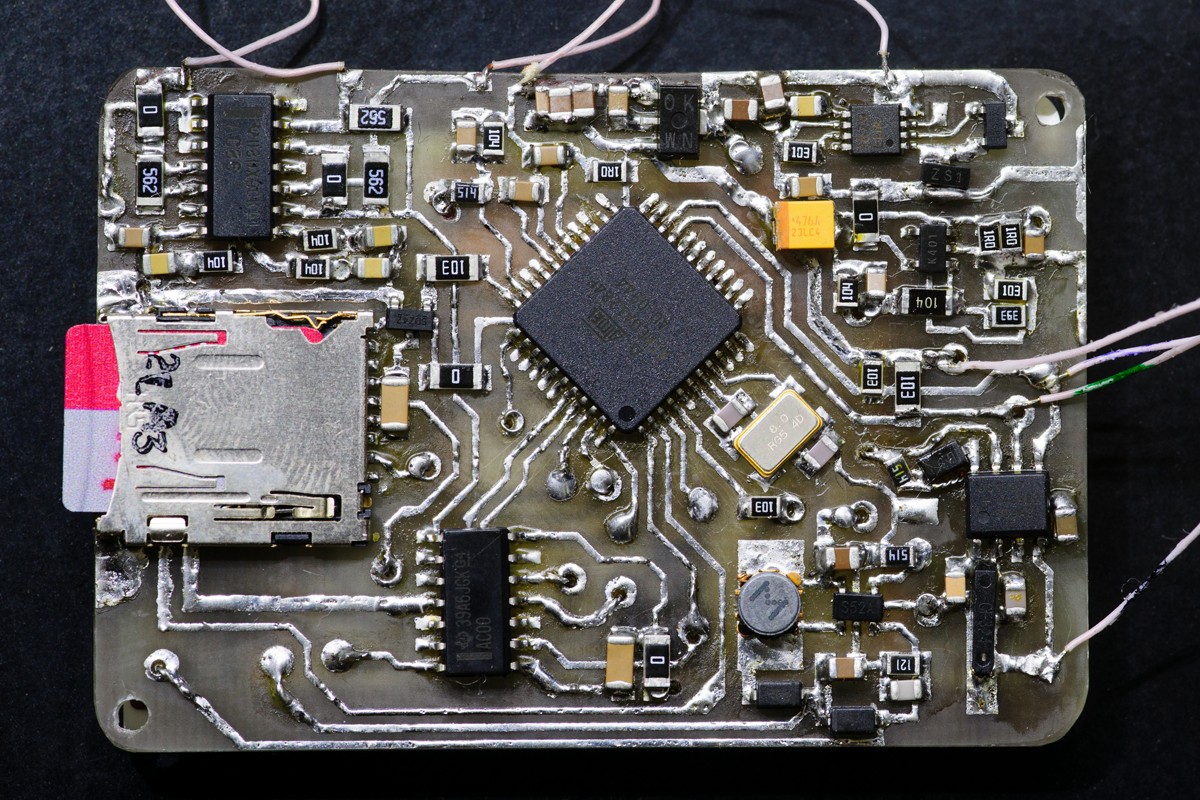
Light sensors placed on a separate thin board located above the display. The board size is chosen so that when assembled, the display covers almost the entire front part of the board.
To give the device a more aesthetic look, a decorative overlay was made, covering everything except the working part of the display and light sensors.
First of all, it is worth noting that the project of the second version of the device was transferred from the Arduino to AVR Studio. This was done because there is no real benefit from the Arduino other than fast firmware via the bootloader and the UART, but there are problems with the watchdog, power saving and some small things. The situation is aggravated by the fact that the standard Arduino platforms on the ATmega1284p do not exist, so there was a choice - either to finish the Arduino IDE and the bootloader, or to transfer the project to AVR Studio. In order not to interfere strongly with the work of the SDFATlib library being used, I left in the project a part of the arduino core related to initialization, work with the timer and I / O lines. However, it was necessary to make changes to the SDFATlib library, and this is due to a change in the polarity of the SCK signal when using the SD card disconnect scheme. By the way, SDFATlib can work both with the SPI library inherited from the Arduino and with its own. In my project, SDFATlib is configured to work with SPI through its own library for AVR (by the way, this is its standard configuration, although work through the Arduino libraries is also possible).
An important difference in the second version of the device is energy saving. Since the included color screen consumes about 3 mA in the active mode, the main way to save energy is to put the screen into sleep mode after a short period of inactivity of the device. The screen is turned on by the same “initiating” button combination, which was used to turn on the backlight in the first version of the device - by holding the extreme buttons, with the average released.
When the screen is on, the sensors and touch buttons are polled with a main cycle period of about 200ms, with the same period, some display elements are updated, such as the state of the buttons and the time. The displayed information from the sensors is updated with twice the period, approximately once every 400ms. Such a period, in my opinion, is optimal, because with a shorter update period, changing numbers are inconvenient to read, and with a longer one, there will be a noticeable lag in readings. The interrogation frequency of all sensors is specially chosen twice as high as the refresh rate of the display, because two measured parameters are read in turn from the pressure and humidity sensors: during one interrogation temperature, during the next - pressure or humidity. All the “free” time of the main cycle the processor is in the ADC noise reduction mode, measuring the battery charge current. As a result, when the screen is on, the device consumes about 6mA.
When the screen is turned off, the display of updates is not required, so the sensors and buttons are polled less frequently, every 500 ms, and the processor spends all its free time in the power down mode. Exit power down mode occurs by interrupting the pin change interrupt from the real-time clock. In this case, the averaged data from all sensors is recorded on the memory card once a minute, regardless of the screen operation mode. To reduce energy consumption, the entire periphery of the microcontroller is turned on immediately before use through the PRR registers and is turned off after use. The current consumed by the device with the screen off is on average about 250 uA, of which, about 100 uA falls on the screen in the power down mode, and the rest is mainly on the microcontroller. At the same time, a decrease in the sampling frequency of the sensors practically does not reduce the consumed current, because a significant part of the energy is consumed during the polling of the touch buttons. It is worth noting that the type of clock generator used also affects power consumption. So, when the microcontroller is clocked from the built-in RC oscillator, the current consumption in the display off mode is slightly less than when using external quartz. Obviously, this is due to a faster start and a smaller dissipative capacity of the RC oscillator. As a result, since in this version of the device there are no special requirements for the stability of the clock frequency of the microcontroller, the final version of the device uses the built-in RC oscillator as a clock generator (although there is a place for quartz on the board).
Important changes affected the information display modes, all the shortcomings identified when using the first version of the device were taken into account and the corresponding changes were made in the program. Now there are 4 different data display modes (the display mode is the view of the main screen), switching between which is done with the enter button.
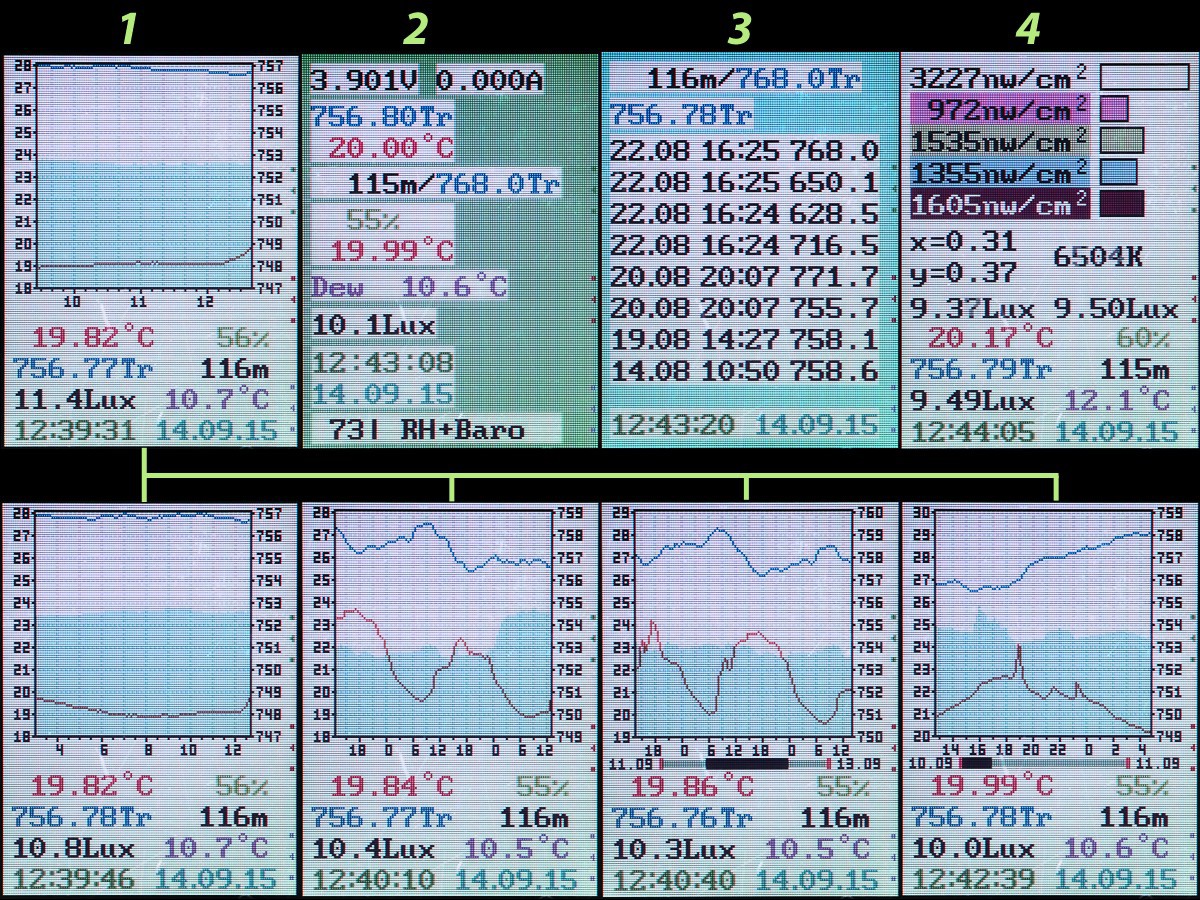
The first screen is used to display the history of meteorological data in the form of graphs, as well as current sensor readings, date and time. At first glance it may seem that almost nothing has changed here since the first version of the device, but in fact it is not. Now the device remembers the temperature, humidity, and pressure every two minutes, and stores in RAM data for the last 4 days - only 2880 counts. All this data is available for viewing, in different time scales. By default, the screen shows the latest data, however, by holding down the “-” button, you can switch to rewind mode, and then use the “+” and “-” buttons to move back and forth along the time axis. Exit the rewind mode by pressing the "Enter" button. Switching the scales in time is done with the "+" button. The final firmware version provides 4 time scales:
Fundamentally possible and any other options of the scale, multiple to 2 minutes. Now, when plotting graphs, various variants of weather data interpretation are possible. Pressure can be displayed directly, and can be converted to a barometric height relative to a point with a given reference pressure. In the first case, the right scale is graded in millimeters of mercury, and in the second case in meters. Humidity can also be displayed either directly (bluish filling) or recalculated to the dew point, then, in addition to the temperature curve, the dew point (magenta) curve is displayed. The pressure and humidity display mode is switched on the second screen.
The second screen , as in the first version, is designed to display all the information about the current state of the device and sensors. Here are shown such parameters as battery voltage, charge current, current readings of the main sensors, zero height pressure, time, date. The last line shows the result of the last attempt to write to the SD card, and the current interpretation of the weather data on the graphs. On this screen, using the "+" and "-" buttons, you can switch the interpretation of weather data, and by pressing the initiating sequence, enter the clock setting mode. As for the SD card, the result of the last access is displayed. If the recording was successful, the number of bytes recorded during the last access is shown, if an error occurs, “Err” is displayed, and if there is no card in the card reader, “---” is displayed.
The third screen is designed to set the pressure reference barometric altimeter. The first line shows the current reference pressure and the corresponding barometric altitude. The current atmospheric pressure is shown below. The following is a table of the history of the reference pressure with the date and time of their installation, the last line shows the date and time. The reference pressure is changed by the “+” and “-” buttons, and it is automatically added to the history table, if, when switching to the next screen, the current reference pressure is different from the last historical value.
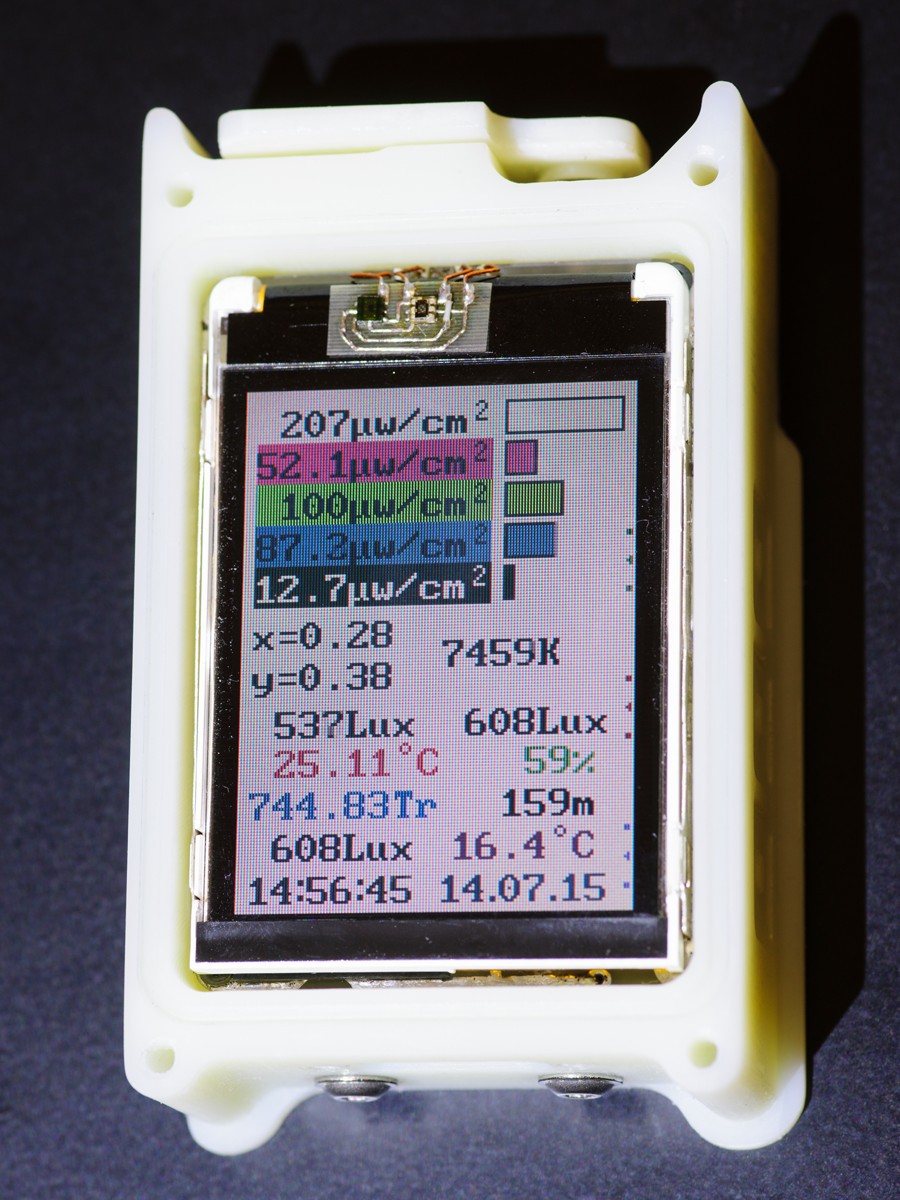
The fourth screen is designed for a detailed display of data provided by the RGB ambient light sensor max44008. The first five lines show the current luminance by channel in numerical and graphical form, followed by the calculated color coordinates and the color temperature of the incident light. The following is a line with two readings in lux. The left number refers to the current sensor readings of max44008, the right one to max44009. The last four lines completely coincide with those from the first screen.
The backlight operation has changed somewhat compared to the first version of the device, because the screen mode has changed. The backlight is still turned on by the initiating combination of buttons (as well as the screen), and if at the time the screen is turned on the illumination is less than 100 lux, the backlight turns on along with the screen. At the moment of turning on, the backlight off timer is set for a period of 40 seconds. Any press of a button when the backlight is on sets the sleep timer value not lower than another period set to 12 seconds. Before turning on the backlight, all the readings of the light sensors are memorized, and during the initial backlight period of about 7 seconds, the memorized readings of the light sensors are displayed on all screens, while the background of the displayed text changes from white to green. By memorizing the readings, the device can display low luminances not distorted by the illumination of the sensors with its own screen. On all screens except the second one, pressing the initiating combination while the backlight is on causes the backlight to turn off; on the second screen, this combination turns on the clock setting mode.
About the work of light sensors, especially about max44008 should talk separately. This sensor was added to the 2M version of the device, with the aim of expanding the range of the weather station lux meter to the area of low illumination.The max sensitivity of the max44009 sensor inherited from the first version of the device is 45 mil-lux / count, which is quite enough for measuring the light at dusk, but not enough for measuring the light on a moonlit and moonless night. Of course, the measurement of illumination is not the main task of my weather station, but since the instrument has a luxometer, and sometimes I have to move during hikes at night, I want to have a tool that shows how dark the night is now. Therefore, the most sensitive sensor was chosen, akin to that used in earlier versions of max44009. The sensor has six channels for measuring illumination in different ranges and one channel for measuring temperature. We already have enough temperature sensors in the device, so the device interrogates only six optical channels - visible (Clear), red (Red), green (Green),blue (Blue), infrared (IR), and compensation (IRcomp). The first five channels are designed to measure light in different parts of the spectrum, and the sixth is designed to compensate for the infrared illumination of visible channels. Setting parameters such as gain (in fact, sensitivity) and signal accumulation time (also affects sensitivity and measurement accuracy) is possible only for all channels at once, and only from the outside. The possibility of automatic selection of these parameters by the sensor itself is not provided, and unlike the max44009, sensitivity has to be adjusted from the program. According to the sensor documentation, the initial values given can be converted into luminous flux per unit area in milliwatts per square centimeter.Curves (in fact, straight lines) are also given there for recalculating the output data into suites for such sources as incandescent and fluorescent lamps. I conducted my calibration by comparing the readings of the max44009 and the new max44008, using scattered sunlight, a fluorescent lamp, an LED flashlight, and averaged readings as the source. As a result, I got similar values for the conversion factors. As a result, the sensitivity of max44008 is approximately 1.4 milliux per countdown in the most sensitive range, which is one and a half orders of magnitude better than that of max44009. The final value of the luxometer readings is formed by linearly stitching data from the insensitive max44009 and sensitive max44008 in the range of 5-10 lux. The calculation of color coordinates and color temperature is implemented according to the documentation,just because there is such an opportunity.
A separate study deserves the question of the accuracy of light sensors and the effect of IR illumination on the reliability of indications. The root of the problem lies in the fact that the photosensitive elements of the max4400x sensors (as well as many other photodiodes and integrated sensors, arrays of cameras and video cameras, and other devices) are made on the basis of silicon. By their physical nature, such photosensitive elements register electromagnetic radiation from a long wavelength, shorter than a certain limit, determined by the width of the forbidden zone. For silicon, this limit wavelength is approximately 1100nm. At the same time, the human eye is completely insensitive to electromagnetic radiation with a long wavelength greater than 800nm. Therefore, radiation with a long wavelength greater than 800 nm (usually 800-1400 nm) is called near infrared.There is a lot of such radiation in the emission spectra of heated bodies, such as incandescent lamps, arc lamps or the sun. And such radiation is practically absent in the spectra of white LEDs and fluorescent lamps. Usually, photosensitive elements are covered on top with special filters that bring their sensitivity curve closer to that required in a particular application. Such a filter can attenuate near-infrared radiation by several orders of magnitude, but does not cut it off completely. At the same time, there is a problem related to the fact that the human eye does not see at all in the near-IR range, and the device, which should measure the flow of visible light, records it at least a little. There are several ways to solve this problem. So, in digital cameras or video cameras, a special multi-layer filter is placed in front of the matrix,which attenuates the near-infrared radiation by about 3 orders of magnitude. The max4400x sensors use another solution - the use of an additional “compensation” channel. Several photodiodes with different filters are installed in the sensor, with approximately the same transmittance in the near-IR range, and the total illumination in the visible range is defined as the measurement difference from two photodiodes. In our case, the max44009 sensor compensates automatically, and the max44008 sensor only gives out the measurement channel data, and the user must perform the compensation himself, subtracting the read values from one another.with approximately the same transmittance in the near infrared range, and the total illumination in the visible range is defined as the difference of measurements from two photodiodes. In our case, the max44009 sensor compensates automatically, and the max44008 sensor only gives out the measurement channel data, and the user must perform the compensation himself, subtracting the read values from one another.with approximately the same transmittance in the near infrared range, and the total illumination in the visible range is defined as the difference of measurements from two photodiodes. In our case, the max44009 sensor compensates automatically, and the max44008 sensor only gives out the measurement channel data, and the user must perform the compensation himself, subtracting the read values from one another.
To test the adequacy of the IC compensation, I conducted several simple experiments. The first is to study the effect of IR illumination from an IR LED from a 880nm long wavelength to the readings of both sensors. The readings of the channels were compared with the source of IR radiation turned on and off and a constant light environment. The experiment showed that the IR compensation works best in the clear channel of the max44008 sensor. When the IR illumination exceeds the visible light in intensity by about an order of magnitude, the error of the compensated channel clear is no more than 10%, and the max44009 sensor with such an illumination gives a very low reading (there is overcompensation). But the readings of the color channels of the RGB sensor during IR illumination begin to "float", and in different directions.Another oddity was found in the operation of this sensor - jumps of real measured values when switching the PGA gain from 16 to 256 in the ircomp channel.
The second experiment was to check the correctness of the color temperature measurement using various sources with a known color temperature. Considering that I do not have an accurate colorimeter for testing, I can conclude that max44008 shows more or less adequate results for sources such as LEDs and luminescent lamps, but the measurement results for incandescent lamps burning with both full heat and under-glow are absolutely unreliable due to IR illumination. It is worth mentioning here that when using an unfinished lamp as a source of IR radiation, the overcompensation of the max44009 sensor is still noticeable.
It is worth mentioning one more disadvantage of the max44008 sensor - dark current. So, at a temperature below 15 degrees Celsius in absolute darkness, the max44008 sensor reads zero, however, as the temperature rises, the dark current increases strongly. At a temperature of 18 degrees it is 1 count, 20 degrees already 2 readings, and at 30 degrees already 7 calculations. It is likely that the sensor can be calibrated for thermal compensation of dark current, but I did not deal with this issue, because I found a noticeable increase in dark current only when I analyzed the log of data from a trip to Karelia, more precisely that part of it when the device was packed in a bag and a hermetic bag.
About battery charging.As can be seen from the diagram, the battery charge is controlled by a separate controller max1879, and the processor and the program running on it can only measure the voltage on the battery and the charge current through the respective circuits. However, a number of measures were taken so that the device could charge and turn on normally, even if the battery sits down completely. Now the project uses watchdog, and fuses WDTON, which ensures that the watchdog starts automatically at any controller reset. At the same time, the brownout threshold is set to 1.8V, the clock source is the built-in RC oscillator, and fuse CKDIV8 is also flashed. In order that the included watchdog does not lead to a cyclic reboot, using __attribute __ ((section (". Init3"))), the watchdog re-configuration for the period equal to four seconds is built into the controller's initialization.Thanks to the installed CKDIV8 controller starts at a frequency of 1 MHz, which is possible at voltages from 1.8V. After initialization, the main controller checks the voltage on the battery. If it is less than the set threshold (2.7v), a message is displayed on the battery and the voltage on the battery, after which the controller waits for about 500ms, turns off the screen and goes to power down until it is reset by watchdog. If the voltage is above the threshold, the program switches the clock frequency to 8 MHz through the CLKPR register, and is initialized in normal mode. As an additional precautionary measure, recording to a microSD card occurs only if the voltage on the battery is above a certain threshold chosen equal to 3.2V. As a result, even when the battery is deeply discharged, the device continues to work as normal as possible.Due to the blocking of the record on the card, the failure of the card during recording is excluded. If during a deep discharge the voltage drops so much that the processor freezes, (experience has shown that this happens at a voltage of about 2.3V), the watchdog will reset and the device will go into an infinite cycle consisting of reboots and a short battery indication. In case of even deeper discharge, the device will turn off according to the BOD. When connected to charging, everything happens in the reverse order. The max1879 controller charges a deeply discharged battery with a small current of 8 mA. When the battery voltage exceeds approximately 2V, the microcontroller will reset on the BOD and will show a “low battery” message that flashes once every 4 seconds. The average current consumption will not exceed 1mA, and charging will continue. When the battery voltage reaches 2.5V,there will be a transition to a charge with a full current, and at 2.7V the device will turn on normally. Such a solution, in my opinion, provides the best performance and indication for deep discharge of the battery and a steady way out of the deep discharge. But if you set the BOD threshold to 2.7V, there may be accidental false positives under unfavorable circumstances (the maximum BOD threshold is too close to the minimum output voltage of the stabilizer).accidental false positives are possible under unfavorable circumstances (the maximum BOD threshold is too close to the minimum output voltage of the stabilizer).accidental false positives are possible under unfavorable circumstances (the maximum BOD threshold is too close to the minimum output voltage of the stabilizer).
The nominal battery indication in the form of flashing letters “LB” has a response threshold of 3.65V, which corresponds to about 20% of the remaining battery charge, that is, the device can work for about a month after turning on the indication of the need to charge. Therefore, to miss the moment when you need to charge the device is very difficult, if at least sometimes to look at his testimony. For this reason, I decided that a more annoying indication of a discharged battery is not required. The charge indicator LED connected to max1879 is located on the board from the side opposite to the screen, so the device glows green from the inside during charging.

To charge the device, a special stand was made with a notch under the device and two contact groups. The stand is equipped with a microUSB connector for connecting a current source. The stand does not have electronic circuits inside, only wires and a self-resetting fuse. For the attentive reader, the choice of the max1879 chip as a charge controller may seem somewhat awkward, because with the charge scheme chosen from a USB compatible current source it would be more logical to use a controller with a built-in current limit. However, the chosen scheme is reliable, not afraid of sources with poor stabilization of the output voltage, and its only drawback, in fact, is not complete compatibility with the USB standard due to the lack of automatic control of the maximum allowed current.But this scheme provides a faster charge when using a power adapter.
In the spring, a copy of version two was ready, and I took it on a hike through the mountainous Crimea. In the summer of hiking on the White Sea and Kovdozer, I already took the next copy of version 2M. As before, while driving in a kayak, I put the device on the body of the kayak in front of me, during a hike in the Crimea, I wore the device around my neck, during stops, stops and stops, I hung the device on a tree in the shade, in a wind-blown place.

Like the first version, the device feels like an additional sense organ, and its use has become more convenient compared to the first version. With a mass of about 128g (compared with 330g of the first version), the device is almost not felt on the neck. The appearance of the device has become, in my opinion, more accurate in comparison with the first version. The touch buttons on the second version are more convenient due to the location on the side and the lack of a number of metal parts of the case, although due to not very quick polling, not everyone gets to use them the first time. The need to turn on the screen to view the instrument does not cause any inconvenience. The screen is easy to turn on even by touch in total darkness. The method of displaying graphs with different scales and scrolling back on the second version of the device turns out to be very practical, allowing you to easily analyze the weather or the profile covered in recent days.
When walking, especially in the mountains, it is very convenient to use the display of pressure on the graph as a barometric altitude. The graph shows the profile of the distance traveled. On the one hand, such a schedule makes it easy to assess the unevenness of a particular trail, which is especially important for mountain trails of the Crimea, walking through the forest.

On the other hand, according to the schedule, it is easy to see your own pace of movement up and down (important on steep climbs) and estimate how much is left until the end of the movement in areas with a known drop. During water trips on the sea or lakes, when the height above sea level is constant, it is more convenient to display the pressure as pressure. The tendencies of change in pressure can be judged on the behavior of the weather over the next two days. In the mountains, tracking pressure trends is more difficult, they can be seen on the chart only during the stay.

At the same time, as already noted in the previous article, own movement in the mountains and even along hilly rugged terrain leads to much faster pressure changes than typical processes occurring in the atmosphere. For this reason, the day-to-day error in the barometric altitude graph is usually small, moreover, it is easy to evaluate visually, extrapolating pressure changes during stops and stops.
The graphs of temperature and pressure are also interesting, but their practical meaning is not so obvious. They allow you to determine the trends of weather, choose the right clothes, and assess the prospects of trying to dry your equipment. With temperature measurement, as well as the first version, there are features. So, hit of sunlight on the device leads to its noticeable heating and temperature measurement error. In addition, the temperature of the surrounding objects and radiant heating affect the air temperature (and the instrument). So, even on an overcast day, the device placed in the shade above the land shows the temperature several degrees lower than if it is placed on the body of a canoe standing on the water. Apparently, this is connected with the heating of the kayak and the air above it with scattered light and IR radiation. To study this circumstance, I even conducted the following experiment. As you know, to accelerate heat transfer, you can apply airflow. The easiest way to organize a thermometer blowing in calm weather is just to twist it on a string around itself. Having twisted the device over the land on a cloudy day in the shade, I was convinced that the airflow does not affect the readings. So in the shadows readings, and so correspond to the temperature of the air. After all, if the temperature of the device was different from the air temperature, due to, for example, radiant heating, the intensification of heat exchange would lead to changes in the equilibrium condition and changes in the readings to the smaller side. If you twist the device above the surface of the water, the temperature readings become lower than if the device lies on the kayak, and the effect is observed even in the presence of a small wind. From this we can conclude that the device is heated by the kayak, and probably from other illuminated underlying surfaces.
It is worth mentioning the possibility of displaying the dew point. The dew point temperature is a function of the absolute humidity of the air (mass of water vapor per unit volume), and allows you to judge the water content in the atmosphere. If you take a certain amount of air and heat it, the temperature will increase, the relative humidity will drop, and the dew point temperature will not change. Accordingly, since the sensor is always in balance with a thin layer of air around it, if the sensor (or the entire device) is heated, the displayed temperature will increase, the displayed humidity will drop, and the displayed dew point temperature will not change. In reality, everything is somewhat more complicated, because the error and discreteness of measuring temperature and especially humidity strongly affect the accuracy of the dew point calculation. Nevertheless, it can be said that the calculated dew point and not relative humidity is information about the amount of water in the atmosphere, and it is not affected by temperature measurement errors associated with heating the device by the sun. As a rule, the dew point temperature varies rather slowly, and its daily fluctuations can be as low as 2–5 degrees against 10–15 at the air temperature. In the summer, increasing the dew point to about 20 degrees is a precursor to the formation of thunderstorms.
The luxometer, now equipped with two sensors, allows to measure illuminance and to obtain reliable measurement results in a variety of conditions: on a sunny day, and on a moonless night, and even in very dark rooms. His testimony makes it possible to judge the thickness of cloud cover in the sky or the depth of twilight. The possibility of constructing an illumination graph in the device is not provided, because the readings strongly depend not only on the illumination, but also on the spatial position of the surrounding objects, and the instrument itself, respectively, it would be difficult to extract information from such a graph. Due to the presence of two sensors, one of which is RGB with an IR channel, the luxometer provides quite a lot of information about illumination, color temperature, and the level of IR radiation. However, in my opinion, this functionality is more useful in assessing the illumination in rooms than in hikes.
Summing up, we note that the second device turned out more convenient and practical than the first. The case is quite light, compact and pleasant to the touch, even at low temperatures. Running time on one battery charge is more than enough for any hike. The graphs can be easily scaled and flipped within the last four days, which is enough for analyzing the weather and / or the traveled profile of the path, and the functionality of the device, in my opinion, is sufficient. SD card can be easily removed to copy data.

If the description of the operating experience of the first version of the instrument ended with a list of flaws, then I will not give such a list, because in my opinion, the instrument does not have obvious flaws. Of course, there are always ideas on building up functionality, but in the process of operation I didn’t have a feeling of a lack of any function. Therefore, I will consider further options for the development of the project.
One of the possible ways to develop the device is to add new functions to the software of the device. Here you can offer such directions:
In addition, there are ideas about the development of a set of sensors for the future. For example, you can add a special sensor designed to measure the temperature of water in ponds and springs, a water salinity sensor (TDS meter), and add the ability to store the corresponding measurement history in the software. Indeed, it is sometimes interesting to measure the temperature of the water in a pond, and the temperature sensors available in the device are somewhat inert and not intended for diving, although diving is harmless to them. In addition, you can add an ultraviolet sensor to a set of light sensors to determine how dangerous it is to be in bright sunlight with the current state of the atmosphere.
The design of the instrument housing of the second version also has some margin for further weight and size reduction. By reducing the wall thickness, using a softer gasket and a thinner cover (for example, from tempered glass), reducing the size of the battery can make the case somewhat smaller and lighter. Separately, it should be said that I managed to find the 2.4-inch transflective screen produced at a resolution of 2.4 ”and 320x240 pixels. Therefore, it will be possible to make the third version of the device entirely from commercially available components. However, when switching to a higher resolution screen, you should increase the processor clock frequency so that the redrawing does not take too much time and increase the amount of RAM to effectively use the increased number of pixels on the screen, reducing the minimum number of degrees, meters and minutes per pixel. For this reason, the third version of the device is likely to be assembled on an AVR Xmega or STM32 series microcontroller.
The source code of the program, curves for milling and layout of the board are available here .
New device design and weight reduction
The first weather station MiniBTH was conceived as an autonomous device, designed primarily for use in hikes. That is why the device case was made airtight, a transflective screen was used, and the battery capacity was calculated for more than a month of work. The main disadvantage of the first version, in my opinion, was a lot of weight, so I decided to make the second version as compact and light as possible. To do this, you need to dissolve the device board as small as possible: a little more than the screen, and make the case as thin and simple as possible. The electronic and software part will be discussed later, but for now let us turn to the design of the housing of the second version of the device. The main ideas for reducing the size of the hull were as follows:
- Reduce the number of screws that press the front cover from eight to four, placing them in the corners of the case.
- Discard the removable back wall, and the assembly of the entire device through the front cover.
- Instead of wireless charging, make a sealed lead. Use two stainless steel screws as contact pads and gland inlets, and provide tightness with rubber washers.
- Move the touch buttons to the side wall of the device.
- Reduce the size of the sensor block and cavities for sensor placement.
- The light sensor is located above the “blind” part of the screen on the remote board.
')
As a result, it was possible to link the proposed ideas to each other and make a rather compact body of corporal of the following design:
The sensor unit is assumed to be removable, is attached to the case with two screws, and the tightness of the docking of the sensor unit and the case is provided by an annular gasket through which the wires pass. A set of sensors is used the same as in the first version of the device - the pressure sensor MS5803 and the humidity sensor sht21. The sensor block itself is glued with sealant from two capralon covers. Between them is placed the board on which the sensors are mounted. The board is made of fiberglass 0.75mm thick. During assembly of the unit, to protect the humidity sensor from vapors emitted by the sealant, its window was sealed with Kapton adhesive tape (as recommended in the documentation).
The design of the sensor unit takes into account the shortcomings identified during the operation of the first version of the device. The humidity sensor is not covered with a mesh cap SF2, but simply placed in the recess of the unit. This solves the problem of cap wetting, which leads to prolonged “sticking” of the moisture readings at the maximum mark, and at the same time, the sensitive side of the housing in the groove makes it possible to prevent its damage by external objects. On the sensor unit of the device version 2M, an additional protrusion is provided to protect the humidity sensor from damage with long thin objects. The issue of protecting the pressure sensor MS5803 from direct sunlight is also resolved at the design stage of the device. The sensitive part of the sensor is covered with a cap of black polystyrene, glued into the recess in the housing. Since the sensor is sensitive to flare and on the reverse side too, the metallization is left on the board at the place of its installation from the opposite side.
Air access to the pressure sensor is via a thin (0.5mm) channel between the instrument case and the sensor unit. It should be noted that when choosing such a design of the sensor unit, there were concerns that water would flow into a thin gap between the sensor unit and the instrument case in the rain, and completely block the air access channel directly to the pressure sensor, which would cause a systematic error in the pressure readings due to surface tension of water. Tests of instruments in the rain and in the shower showed that due to the non-wettability of the corporal, at a channel thickness of 0.5mm no leakage occurs. More thorough experiments have shown that if the sensor unit is installed with an inclination and thus reduces the thickness of the channel until it touches the edge of the sensor unit of the case, water may leak into the device and leads to a decrease in pressure reading of approximately 0.7mm Hg. If the sensor block is installed smoothly, water does not flow.
At first glance, the front cover and the seal changed little in appearance, but when designing it, a number of new technical solutions had to be applied. On the one hand, reducing the number of clamping screws and increasing the distance between them requires a more rigid clamping frame and / or a softer sealing gasket to ensure compression of the gasket along its entire length. On the other hand, for reasons of ease of use, it was decided to make the clamping frame plastic, and this, on the contrary, will reduce its rigidity. A possible solution to this contradiction is to use a softer rubber gasket. This option is more reasonable than trying to put “crutches” in the form of inserting rigid metal inserts or elastic elements into the pressure frame design and using the same hard drive belt from the tape recorder as a seal.
After a brief search on the Internet, a solution was found on how to make rubber pads by yourself. There are special two-component silicones used for making molds and gaskets. The technology of working with these silicones is briefly as follows: two liquid components must be mixed together, after which they should be poured into a mold for several minutes and wait until the composition hardens. After hardening, a very flexible and soft silicone rubber is obtained, which is easily separated from the form in which it hardens. There are whole lines of such silicones from different manufacturers, they differ in the type of catalyst-hardener used and the physicomechanical and chemical properties of the resulting rubber. All silicones have an elongation at break equal to hundreds of percent, are relatively soft, can work at temperatures up to 200 degrees Celsius, and are relatively chemically resistant. Platinum catalyst silicones are more chemically resistant and have food tolerance. One of the typical applications of such silicones is the manufacture of molds for casting from plaster, cement, soap, or even chocolate. The second typical application is the production of gaskets.
On the manufacture of silicone rubber gaskets
I found a supplier in my city that offers a whole line of Sk-76x silicones with a tin catalyst, and Sk-790 silicone with a platinum catalyst. For the experiments, I purchased two sets - silicone with a platinum catalyst Sk-790 and the softest silicone Sk-762, and began to experiment with the casting.
In my case, making a mold for casting did not pose a problem; I simply profiled the grooves of the desired shape in a sheet of polymethyl acrylate. Initially, it was supposed to pour silicone into the mold and cover it with a second flat sheet of organic glass on top, squeezing out excess silicone. However, it turned out that everything is not so simple, and I changed the technology somewhat. The main problem in the casting of silicone are air bubbles. They are formed both by mixing the starting components and by pouring the composition into the mold. One of the ways to combat bubbles, which is recommended by the manufacturer, is to place the silicone prepared for casting into a vacuum for several minutes before pouring. In a vacuum, all the bubbles swell and burst, and all the air escapes from them. Outwardly, it vaguely resembles running milk. To deal with bubbles that have arisen during pouring, you can evacuate the composition after pouring. However, I decided not to strain colleagues who have a vacuum chamber, and to look for an easier way to make castings without bubbles. This turned out to be not so difficult, because all the bubbles formed during mixing and pouring are quite large. Apparently, the viscosity of the silicone prevents the formation of small bubbles when trapping air or by crushing large bubbles. Therefore, the bubbles are quite clearly visible to the eye, and even have time to float a few millimeters up before the solidification of the silicone. Therefore, the technology of pouring is assumed to be the following: silicone is applied with excess along the groove in the mold, and after a few minutes, the excess silicone, together with all the bubbles, is removed with a metal spatula. If the bubble is stuck to the wall of the form, it can be removed using the same scapula. The top surface of the fill becomes smooth due to the action of surface tension forces and gravity. The main thing - evenly remove excess silicone from the top of the form. But if you cover the casting with a lid - there is a big risk to drive the air bubble into the mold.
Thus, the issue of manufacturing gaskets of any shape was resolved, which allowed us to choose any convenient version of the design of the front cover. A separate dilemma was the choice of material for the transparent part of the cover. There are two kinds of transparent materials available to me. One is a viscous and flexible polycarbonate, which, however, is not very resistant to mechanical stress and is not very transparent, but has a bluish tint. The second is transparent but fragile polymethylacrylate. Despite the fact that in the first version of the device polycarbonate was used, in the second I decided to use polymethylacrylate. On the one hand, it is more transparent, which improves the readability of the screen when illuminated with bright diffused light, on the other hand, it introduces less deviations in the readings of the light sensors. In addition, it is less scratched under similar operating conditions. To reduce the likelihood of cracking acrylate with a frontal impact and to improve the appearance of the device, the transparent cover is made thick (5 mm), and the pressure frame is planted on a special milled ledge. The top cover of this design turns out to be quite rigid, and can be used both with a soft gasket made of Sk-762 silicone and with a stiffer one of Sk-790. In the end, I decided to opt for silicone 790, because it is with a platinum catalyst and is chemically more inert.
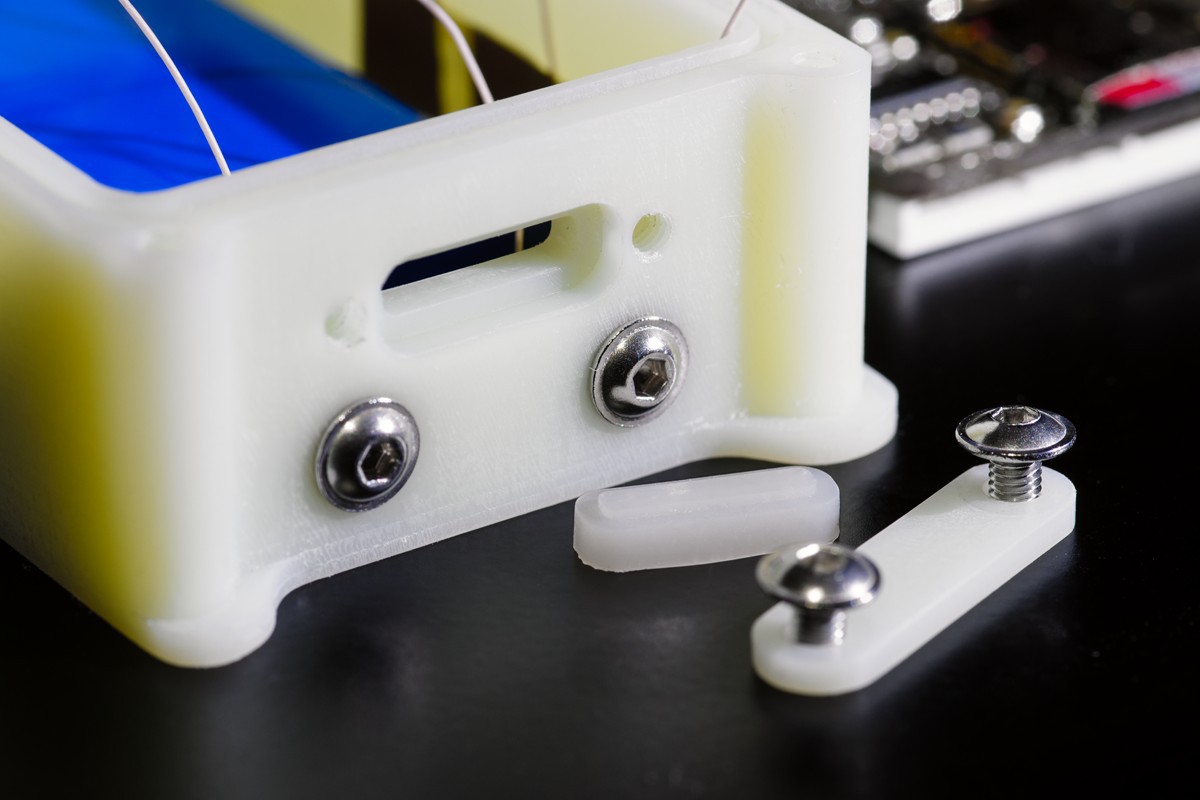
The ability to cast gaskets of any shape allowed to make a hatch for quick access to SD, which was implemented in the version of the device 2M. Finally, the idea to make the flap took shape quite late, when the device version 2 was assembled and manufactured. Creating a flap rested on three problems - how to seal it, where to place it, and how to fix it. The first problem is solved by the manufacture of gaskets of the desired shape. The second problem was also solved, because in the recess on the lower side there is an empty space in which it is convenient to hide the lid protruding outside. I solved the third problem in my simplest way - the flap is fixed with screws. On the one hand, you cannot open the key without a key, but accidentally it will not open either. Yes, and on the serial sealed gadgets, the covers are also often fixed with screws.
The hatch itself is located in the lower part of the housing, and is a through-milled hole of an oblong shape, with a T-shaped ledge in cross section, about which the gasket is crimped. From the outside, the gasket is pressed by the flat cover, which is fixed on the case with two M3x5 screws. The thickness of the bottom wall of the case is 5 mm, the depth of the ledge is 2 mm, the thickness of the uncompressed gasket is 2.5 mm, the thickness of the lid is 2 mm. The holes, in which the screws are not threaded, are recessed into the case by 3.9mm, the thread in them is cut to almost the entire depth. Threading on a CNC machine available to me is impossible, so it was done with the help of three specially sharpened taps and a screwdriver.
The finished housing was tested for tightness by immersion for 12 hours. Filter paper was used to detect possible leaks. Cases were sealed. To exclude condensation of water inside the case at low temperatures, a cloth bag with silica gel is placed in a free volume near the battery. Tests and further operation showed that no condensate is formed in the housing.
On the development of electronic parts
The electronic part of the second version of the device in terms of the solutions used is very similar to the first version. The ATmega1284p microcontroller operating at 8 MHz is used as the main processor.
All sensors and a DS1337 real-time clock are connected to it via the I2C bus. An additional signal with a frequency of 1 Hz is brought to a separate input of the processor microcontroller. This allows the use of sleep modes with the main clock generator stopped for better energy saving. The battery is charged using the max1879 controller with an external key, but now it is directly connected to the charger via a sealed lead-in. To indicate the charge current, a current-measuring circuit on the TS321 operational amplifier was introduced, completely analogous to that used in the first version of the device. The screen and the SD card are connected to the controller via a single SPI bus, but now the scheme provides for the ability to turn off the power of the SD card while it is not in use. The touch buttons on the phase detectors are similar to those used in the first version of the device.
The plates of the touch buttons are placed on the side panel of the device, and milling is made above them for easy blind search. There are still three buttons, the upper one is conventionally called “Enter”, the middle one is “-”, and the bottom one is “+”. Almost all the details of the device could be placed on the board with the size of 59x41mm with rounded edges. Only protective sapressory and coils L2-L3 are mounted directly on the screw - sealed inlets.
Light sensors placed on a separate thin board located above the display. The board size is chosen so that when assembled, the display covers almost the entire front part of the board.
To give the device a more aesthetic look, a decorative overlay was made, covering everything except the working part of the display and light sensors.
About the device interface and software development
First of all, it is worth noting that the project of the second version of the device was transferred from the Arduino to AVR Studio. This was done because there is no real benefit from the Arduino other than fast firmware via the bootloader and the UART, but there are problems with the watchdog, power saving and some small things. The situation is aggravated by the fact that the standard Arduino platforms on the ATmega1284p do not exist, so there was a choice - either to finish the Arduino IDE and the bootloader, or to transfer the project to AVR Studio. In order not to interfere strongly with the work of the SDFATlib library being used, I left in the project a part of the arduino core related to initialization, work with the timer and I / O lines. However, it was necessary to make changes to the SDFATlib library, and this is due to a change in the polarity of the SCK signal when using the SD card disconnect scheme. By the way, SDFATlib can work both with the SPI library inherited from the Arduino and with its own. In my project, SDFATlib is configured to work with SPI through its own library for AVR (by the way, this is its standard configuration, although work through the Arduino libraries is also possible).
An important difference in the second version of the device is energy saving. Since the included color screen consumes about 3 mA in the active mode, the main way to save energy is to put the screen into sleep mode after a short period of inactivity of the device. The screen is turned on by the same “initiating” button combination, which was used to turn on the backlight in the first version of the device - by holding the extreme buttons, with the average released.
When the screen is on, the sensors and touch buttons are polled with a main cycle period of about 200ms, with the same period, some display elements are updated, such as the state of the buttons and the time. The displayed information from the sensors is updated with twice the period, approximately once every 400ms. Such a period, in my opinion, is optimal, because with a shorter update period, changing numbers are inconvenient to read, and with a longer one, there will be a noticeable lag in readings. The interrogation frequency of all sensors is specially chosen twice as high as the refresh rate of the display, because two measured parameters are read in turn from the pressure and humidity sensors: during one interrogation temperature, during the next - pressure or humidity. All the “free” time of the main cycle the processor is in the ADC noise reduction mode, measuring the battery charge current. As a result, when the screen is on, the device consumes about 6mA.
When the screen is turned off, the display of updates is not required, so the sensors and buttons are polled less frequently, every 500 ms, and the processor spends all its free time in the power down mode. Exit power down mode occurs by interrupting the pin change interrupt from the real-time clock. In this case, the averaged data from all sensors is recorded on the memory card once a minute, regardless of the screen operation mode. To reduce energy consumption, the entire periphery of the microcontroller is turned on immediately before use through the PRR registers and is turned off after use. The current consumed by the device with the screen off is on average about 250 uA, of which, about 100 uA falls on the screen in the power down mode, and the rest is mainly on the microcontroller. At the same time, a decrease in the sampling frequency of the sensors practically does not reduce the consumed current, because a significant part of the energy is consumed during the polling of the touch buttons. It is worth noting that the type of clock generator used also affects power consumption. So, when the microcontroller is clocked from the built-in RC oscillator, the current consumption in the display off mode is slightly less than when using external quartz. Obviously, this is due to a faster start and a smaller dissipative capacity of the RC oscillator. As a result, since in this version of the device there are no special requirements for the stability of the clock frequency of the microcontroller, the final version of the device uses the built-in RC oscillator as a clock generator (although there is a place for quartz on the board).
Important changes affected the information display modes, all the shortcomings identified when using the first version of the device were taken into account and the corresponding changes were made in the program. Now there are 4 different data display modes (the display mode is the view of the main screen), switching between which is done with the enter button.
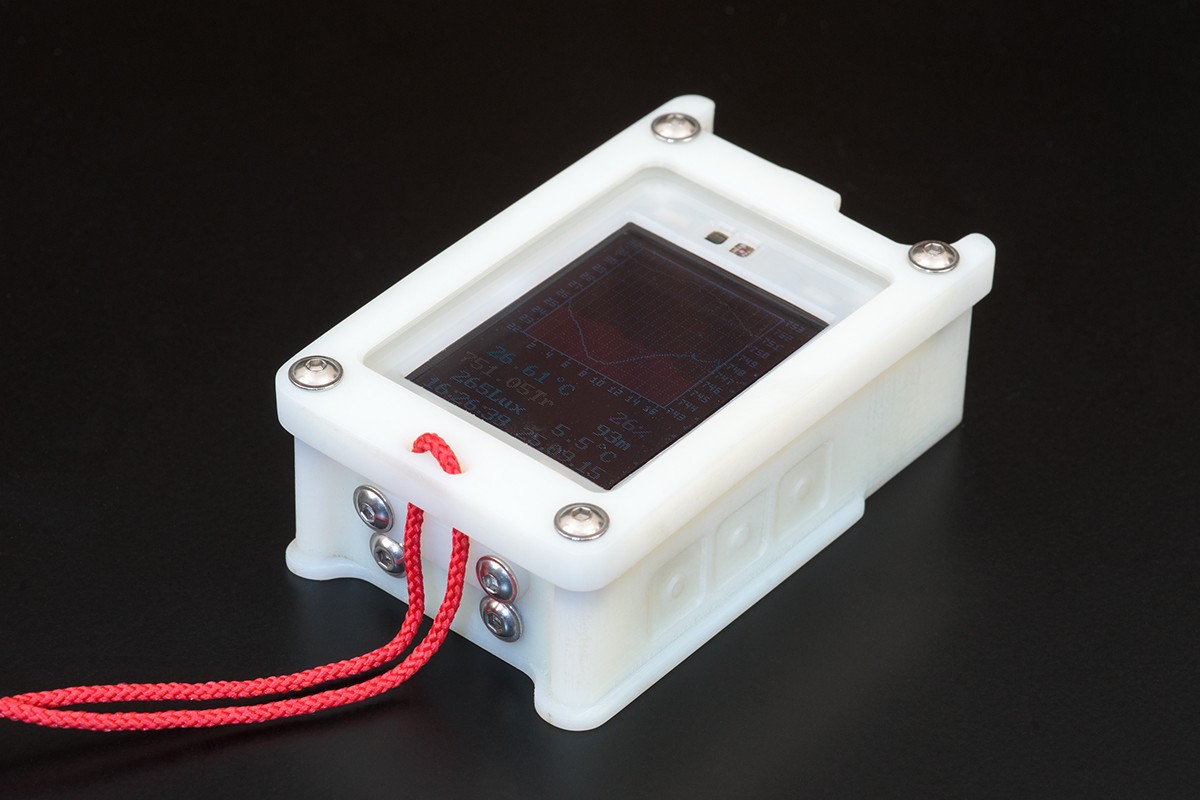
The first screen is used to display the history of meteorological data in the form of graphs, as well as current sensor readings, date and time. At first glance it may seem that almost nothing has changed here since the first version of the device, but in fact it is not. Now the device remembers the temperature, humidity, and pressure every two minutes, and stores in RAM data for the last 4 days - only 2880 counts. All this data is available for viewing, in different time scales. By default, the screen shows the latest data, however, by holding down the “-” button, you can switch to rewind mode, and then use the “+” and “-” buttons to move back and forth along the time axis. Exit the rewind mode by pressing the "Enter" button. Switching the scales in time is done with the "+" button. The final firmware version provides 4 time scales:
- 2min / pixel (3.2 hours for the whole graph).
- 6min / pixel (9.6 hours for the whole graph).
- 10min / pixel (16 hours for the whole graph).
- 30min / pixel (48 hours for the whole schedule).
Fundamentally possible and any other options of the scale, multiple to 2 minutes. Now, when plotting graphs, various variants of weather data interpretation are possible. Pressure can be displayed directly, and can be converted to a barometric height relative to a point with a given reference pressure. In the first case, the right scale is graded in millimeters of mercury, and in the second case in meters. Humidity can also be displayed either directly (bluish filling) or recalculated to the dew point, then, in addition to the temperature curve, the dew point (magenta) curve is displayed. The pressure and humidity display mode is switched on the second screen.
The second screen , as in the first version, is designed to display all the information about the current state of the device and sensors. Here are shown such parameters as battery voltage, charge current, current readings of the main sensors, zero height pressure, time, date. The last line shows the result of the last attempt to write to the SD card, and the current interpretation of the weather data on the graphs. On this screen, using the "+" and "-" buttons, you can switch the interpretation of weather data, and by pressing the initiating sequence, enter the clock setting mode. As for the SD card, the result of the last access is displayed. If the recording was successful, the number of bytes recorded during the last access is shown, if an error occurs, “Err” is displayed, and if there is no card in the card reader, “---” is displayed.
The third screen is designed to set the pressure reference barometric altimeter. The first line shows the current reference pressure and the corresponding barometric altitude. The current atmospheric pressure is shown below. The following is a table of the history of the reference pressure with the date and time of their installation, the last line shows the date and time. The reference pressure is changed by the “+” and “-” buttons, and it is automatically added to the history table, if, when switching to the next screen, the current reference pressure is different from the last historical value.
The fourth screen is designed for a detailed display of data provided by the RGB ambient light sensor max44008. The first five lines show the current luminance by channel in numerical and graphical form, followed by the calculated color coordinates and the color temperature of the incident light. The following is a line with two readings in lux. The left number refers to the current sensor readings of max44008, the right one to max44009. The last four lines completely coincide with those from the first screen.
The backlight operation has changed somewhat compared to the first version of the device, because the screen mode has changed. The backlight is still turned on by the initiating combination of buttons (as well as the screen), and if at the time the screen is turned on the illumination is less than 100 lux, the backlight turns on along with the screen. At the moment of turning on, the backlight off timer is set for a period of 40 seconds. Any press of a button when the backlight is on sets the sleep timer value not lower than another period set to 12 seconds. Before turning on the backlight, all the readings of the light sensors are memorized, and during the initial backlight period of about 7 seconds, the memorized readings of the light sensors are displayed on all screens, while the background of the displayed text changes from white to green. By memorizing the readings, the device can display low luminances not distorted by the illumination of the sensors with its own screen. On all screens except the second one, pressing the initiating combination while the backlight is on causes the backlight to turn off; on the second screen, this combination turns on the clock setting mode.
About the work of light sensors, especially about max44008 should talk separately. This sensor was added to the 2M version of the device, with the aim of expanding the range of the weather station lux meter to the area of low illumination.The max sensitivity of the max44009 sensor inherited from the first version of the device is 45 mil-lux / count, which is quite enough for measuring the light at dusk, but not enough for measuring the light on a moonlit and moonless night. Of course, the measurement of illumination is not the main task of my weather station, but since the instrument has a luxometer, and sometimes I have to move during hikes at night, I want to have a tool that shows how dark the night is now. Therefore, the most sensitive sensor was chosen, akin to that used in earlier versions of max44009. The sensor has six channels for measuring illumination in different ranges and one channel for measuring temperature. We already have enough temperature sensors in the device, so the device interrogates only six optical channels - visible (Clear), red (Red), green (Green),blue (Blue), infrared (IR), and compensation (IRcomp). The first five channels are designed to measure light in different parts of the spectrum, and the sixth is designed to compensate for the infrared illumination of visible channels. Setting parameters such as gain (in fact, sensitivity) and signal accumulation time (also affects sensitivity and measurement accuracy) is possible only for all channels at once, and only from the outside. The possibility of automatic selection of these parameters by the sensor itself is not provided, and unlike the max44009, sensitivity has to be adjusted from the program. According to the sensor documentation, the initial values given can be converted into luminous flux per unit area in milliwatts per square centimeter.Curves (in fact, straight lines) are also given there for recalculating the output data into suites for such sources as incandescent and fluorescent lamps. I conducted my calibration by comparing the readings of the max44009 and the new max44008, using scattered sunlight, a fluorescent lamp, an LED flashlight, and averaged readings as the source. As a result, I got similar values for the conversion factors. As a result, the sensitivity of max44008 is approximately 1.4 milliux per countdown in the most sensitive range, which is one and a half orders of magnitude better than that of max44009. The final value of the luxometer readings is formed by linearly stitching data from the insensitive max44009 and sensitive max44008 in the range of 5-10 lux. The calculation of color coordinates and color temperature is implemented according to the documentation,just because there is such an opportunity.
A separate study deserves the question of the accuracy of light sensors and the effect of IR illumination on the reliability of indications. The root of the problem lies in the fact that the photosensitive elements of the max4400x sensors (as well as many other photodiodes and integrated sensors, arrays of cameras and video cameras, and other devices) are made on the basis of silicon. By their physical nature, such photosensitive elements register electromagnetic radiation from a long wavelength, shorter than a certain limit, determined by the width of the forbidden zone. For silicon, this limit wavelength is approximately 1100nm. At the same time, the human eye is completely insensitive to electromagnetic radiation with a long wavelength greater than 800nm. Therefore, radiation with a long wavelength greater than 800 nm (usually 800-1400 nm) is called near infrared.There is a lot of such radiation in the emission spectra of heated bodies, such as incandescent lamps, arc lamps or the sun. And such radiation is practically absent in the spectra of white LEDs and fluorescent lamps. Usually, photosensitive elements are covered on top with special filters that bring their sensitivity curve closer to that required in a particular application. Such a filter can attenuate near-infrared radiation by several orders of magnitude, but does not cut it off completely. At the same time, there is a problem related to the fact that the human eye does not see at all in the near-IR range, and the device, which should measure the flow of visible light, records it at least a little. There are several ways to solve this problem. So, in digital cameras or video cameras, a special multi-layer filter is placed in front of the matrix,which attenuates the near-infrared radiation by about 3 orders of magnitude. The max4400x sensors use another solution - the use of an additional “compensation” channel. Several photodiodes with different filters are installed in the sensor, with approximately the same transmittance in the near-IR range, and the total illumination in the visible range is defined as the measurement difference from two photodiodes. In our case, the max44009 sensor compensates automatically, and the max44008 sensor only gives out the measurement channel data, and the user must perform the compensation himself, subtracting the read values from one another.with approximately the same transmittance in the near infrared range, and the total illumination in the visible range is defined as the difference of measurements from two photodiodes. In our case, the max44009 sensor compensates automatically, and the max44008 sensor only gives out the measurement channel data, and the user must perform the compensation himself, subtracting the read values from one another.with approximately the same transmittance in the near infrared range, and the total illumination in the visible range is defined as the difference of measurements from two photodiodes. In our case, the max44009 sensor compensates automatically, and the max44008 sensor only gives out the measurement channel data, and the user must perform the compensation himself, subtracting the read values from one another.
To test the adequacy of the IC compensation, I conducted several simple experiments. The first is to study the effect of IR illumination from an IR LED from a 880nm long wavelength to the readings of both sensors. The readings of the channels were compared with the source of IR radiation turned on and off and a constant light environment. The experiment showed that the IR compensation works best in the clear channel of the max44008 sensor. When the IR illumination exceeds the visible light in intensity by about an order of magnitude, the error of the compensated channel clear is no more than 10%, and the max44009 sensor with such an illumination gives a very low reading (there is overcompensation). But the readings of the color channels of the RGB sensor during IR illumination begin to "float", and in different directions.Another oddity was found in the operation of this sensor - jumps of real measured values when switching the PGA gain from 16 to 256 in the ircomp channel.
The second experiment was to check the correctness of the color temperature measurement using various sources with a known color temperature. Considering that I do not have an accurate colorimeter for testing, I can conclude that max44008 shows more or less adequate results for sources such as LEDs and luminescent lamps, but the measurement results for incandescent lamps burning with both full heat and under-glow are absolutely unreliable due to IR illumination. It is worth mentioning here that when using an unfinished lamp as a source of IR radiation, the overcompensation of the max44009 sensor is still noticeable.
It is worth mentioning one more disadvantage of the max44008 sensor - dark current. So, at a temperature below 15 degrees Celsius in absolute darkness, the max44008 sensor reads zero, however, as the temperature rises, the dark current increases strongly. At a temperature of 18 degrees it is 1 count, 20 degrees already 2 readings, and at 30 degrees already 7 calculations. It is likely that the sensor can be calibrated for thermal compensation of dark current, but I did not deal with this issue, because I found a noticeable increase in dark current only when I analyzed the log of data from a trip to Karelia, more precisely that part of it when the device was packed in a bag and a hermetic bag.
About battery charging.As can be seen from the diagram, the battery charge is controlled by a separate controller max1879, and the processor and the program running on it can only measure the voltage on the battery and the charge current through the respective circuits. However, a number of measures were taken so that the device could charge and turn on normally, even if the battery sits down completely. Now the project uses watchdog, and fuses WDTON, which ensures that the watchdog starts automatically at any controller reset. At the same time, the brownout threshold is set to 1.8V, the clock source is the built-in RC oscillator, and fuse CKDIV8 is also flashed. In order that the included watchdog does not lead to a cyclic reboot, using __attribute __ ((section (". Init3"))), the watchdog re-configuration for the period equal to four seconds is built into the controller's initialization.Thanks to the installed CKDIV8 controller starts at a frequency of 1 MHz, which is possible at voltages from 1.8V. After initialization, the main controller checks the voltage on the battery. If it is less than the set threshold (2.7v), a message is displayed on the battery and the voltage on the battery, after which the controller waits for about 500ms, turns off the screen and goes to power down until it is reset by watchdog. If the voltage is above the threshold, the program switches the clock frequency to 8 MHz through the CLKPR register, and is initialized in normal mode. As an additional precautionary measure, recording to a microSD card occurs only if the voltage on the battery is above a certain threshold chosen equal to 3.2V. As a result, even when the battery is deeply discharged, the device continues to work as normal as possible.Due to the blocking of the record on the card, the failure of the card during recording is excluded. If during a deep discharge the voltage drops so much that the processor freezes, (experience has shown that this happens at a voltage of about 2.3V), the watchdog will reset and the device will go into an infinite cycle consisting of reboots and a short battery indication. In case of even deeper discharge, the device will turn off according to the BOD. When connected to charging, everything happens in the reverse order. The max1879 controller charges a deeply discharged battery with a small current of 8 mA. When the battery voltage exceeds approximately 2V, the microcontroller will reset on the BOD and will show a “low battery” message that flashes once every 4 seconds. The average current consumption will not exceed 1mA, and charging will continue. When the battery voltage reaches 2.5V,there will be a transition to a charge with a full current, and at 2.7V the device will turn on normally. Such a solution, in my opinion, provides the best performance and indication for deep discharge of the battery and a steady way out of the deep discharge. But if you set the BOD threshold to 2.7V, there may be accidental false positives under unfavorable circumstances (the maximum BOD threshold is too close to the minimum output voltage of the stabilizer).accidental false positives are possible under unfavorable circumstances (the maximum BOD threshold is too close to the minimum output voltage of the stabilizer).accidental false positives are possible under unfavorable circumstances (the maximum BOD threshold is too close to the minimum output voltage of the stabilizer).
The nominal battery indication in the form of flashing letters “LB” has a response threshold of 3.65V, which corresponds to about 20% of the remaining battery charge, that is, the device can work for about a month after turning on the indication of the need to charge. Therefore, to miss the moment when you need to charge the device is very difficult, if at least sometimes to look at his testimony. For this reason, I decided that a more annoying indication of a discharged battery is not required. The charge indicator LED connected to max1879 is located on the board from the side opposite to the screen, so the device glows green from the inside during charging.
To charge the device, a special stand was made with a notch under the device and two contact groups. The stand is equipped with a microUSB connector for connecting a current source. The stand does not have electronic circuits inside, only wires and a self-resetting fuse. For the attentive reader, the choice of the max1879 chip as a charge controller may seem somewhat awkward, because with the charge scheme chosen from a USB compatible current source it would be more logical to use a controller with a built-in current limit. However, the chosen scheme is reliable, not afraid of sources with poor stabilization of the output voltage, and its only drawback, in fact, is not complete compatibility with the USB standard due to the lack of automatic control of the maximum allowed current.But this scheme provides a faster charge when using a power adapter.
In the spring, a copy of version two was ready, and I took it on a hike through the mountainous Crimea. In the summer of hiking on the White Sea and Kovdozer, I already took the next copy of version 2M. As before, while driving in a kayak, I put the device on the body of the kayak in front of me, during a hike in the Crimea, I wore the device around my neck, during stops, stops and stops, I hung the device on a tree in the shade, in a wind-blown place.
Like the first version, the device feels like an additional sense organ, and its use has become more convenient compared to the first version. With a mass of about 128g (compared with 330g of the first version), the device is almost not felt on the neck. The appearance of the device has become, in my opinion, more accurate in comparison with the first version. The touch buttons on the second version are more convenient due to the location on the side and the lack of a number of metal parts of the case, although due to not very quick polling, not everyone gets to use them the first time. The need to turn on the screen to view the instrument does not cause any inconvenience. The screen is easy to turn on even by touch in total darkness. The method of displaying graphs with different scales and scrolling back on the second version of the device turns out to be very practical, allowing you to easily analyze the weather or the profile covered in recent days.
When walking, especially in the mountains, it is very convenient to use the display of pressure on the graph as a barometric altitude. The graph shows the profile of the distance traveled. On the one hand, such a schedule makes it easy to assess the unevenness of a particular trail, which is especially important for mountain trails of the Crimea, walking through the forest.
On the other hand, according to the schedule, it is easy to see your own pace of movement up and down (important on steep climbs) and estimate how much is left until the end of the movement in areas with a known drop. During water trips on the sea or lakes, when the height above sea level is constant, it is more convenient to display the pressure as pressure. The tendencies of change in pressure can be judged on the behavior of the weather over the next two days. In the mountains, tracking pressure trends is more difficult, they can be seen on the chart only during the stay.
At the same time, as already noted in the previous article, own movement in the mountains and even along hilly rugged terrain leads to much faster pressure changes than typical processes occurring in the atmosphere. For this reason, the day-to-day error in the barometric altitude graph is usually small, moreover, it is easy to evaluate visually, extrapolating pressure changes during stops and stops.
The graphs of temperature and pressure are also interesting, but their practical meaning is not so obvious. They allow you to determine the trends of weather, choose the right clothes, and assess the prospects of trying to dry your equipment. With temperature measurement, as well as the first version, there are features. So, hit of sunlight on the device leads to its noticeable heating and temperature measurement error. In addition, the temperature of the surrounding objects and radiant heating affect the air temperature (and the instrument). So, even on an overcast day, the device placed in the shade above the land shows the temperature several degrees lower than if it is placed on the body of a canoe standing on the water. Apparently, this is connected with the heating of the kayak and the air above it with scattered light and IR radiation. To study this circumstance, I even conducted the following experiment. As you know, to accelerate heat transfer, you can apply airflow. The easiest way to organize a thermometer blowing in calm weather is just to twist it on a string around itself. Having twisted the device over the land on a cloudy day in the shade, I was convinced that the airflow does not affect the readings. So in the shadows readings, and so correspond to the temperature of the air. After all, if the temperature of the device was different from the air temperature, due to, for example, radiant heating, the intensification of heat exchange would lead to changes in the equilibrium condition and changes in the readings to the smaller side. If you twist the device above the surface of the water, the temperature readings become lower than if the device lies on the kayak, and the effect is observed even in the presence of a small wind. From this we can conclude that the device is heated by the kayak, and probably from other illuminated underlying surfaces.
It is worth mentioning the possibility of displaying the dew point. The dew point temperature is a function of the absolute humidity of the air (mass of water vapor per unit volume), and allows you to judge the water content in the atmosphere. If you take a certain amount of air and heat it, the temperature will increase, the relative humidity will drop, and the dew point temperature will not change. Accordingly, since the sensor is always in balance with a thin layer of air around it, if the sensor (or the entire device) is heated, the displayed temperature will increase, the displayed humidity will drop, and the displayed dew point temperature will not change. In reality, everything is somewhat more complicated, because the error and discreteness of measuring temperature and especially humidity strongly affect the accuracy of the dew point calculation. Nevertheless, it can be said that the calculated dew point and not relative humidity is information about the amount of water in the atmosphere, and it is not affected by temperature measurement errors associated with heating the device by the sun. As a rule, the dew point temperature varies rather slowly, and its daily fluctuations can be as low as 2–5 degrees against 10–15 at the air temperature. In the summer, increasing the dew point to about 20 degrees is a precursor to the formation of thunderstorms.
The luxometer, now equipped with two sensors, allows to measure illuminance and to obtain reliable measurement results in a variety of conditions: on a sunny day, and on a moonless night, and even in very dark rooms. His testimony makes it possible to judge the thickness of cloud cover in the sky or the depth of twilight. The possibility of constructing an illumination graph in the device is not provided, because the readings strongly depend not only on the illumination, but also on the spatial position of the surrounding objects, and the instrument itself, respectively, it would be difficult to extract information from such a graph. Due to the presence of two sensors, one of which is RGB with an IR channel, the luxometer provides quite a lot of information about illumination, color temperature, and the level of IR radiation. However, in my opinion, this functionality is more useful in assessing the illumination in rooms than in hikes.
Summing up, we note that the second device turned out more convenient and practical than the first. The case is quite light, compact and pleasant to the touch, even at low temperatures. Running time on one battery charge is more than enough for any hike. The graphs can be easily scaled and flipped within the last four days, which is enough for analyzing the weather and / or the traveled profile of the path, and the functionality of the device, in my opinion, is sufficient. SD card can be easily removed to copy data.
If the description of the operating experience of the first version of the instrument ended with a list of flaws, then I will not give such a list, because in my opinion, the instrument does not have obvious flaws. Of course, there are always ideas on building up functionality, but in the process of operation I didn’t have a feeling of a lack of any function. Therefore, I will consider further options for the development of the project.
One of the possible ways to develop the device is to add new functions to the software of the device. Here you can offer such directions:
- Add the ability to separate and display on the graph the changes in pressure associated with changes in the state of the atmosphere and with changes in the height at which the device is located. To implement this feature, some model assumptions will be required to approximate the pressure behavior at the reference height, and the result will not be very accurate, but it would be interesting to add such a display mode to the available ones.
- Make the software update function of the device through the SD card.
- Add settings for the frequency of data recording to the map and the display modes for rapid changes in weather data (especially important for pressure) to expand the scope of the instrument, for example, in urban environments.
- Add logging of changes in the reference height settings and the RGB sensor channel readings to the SD card.
In addition, there are ideas about the development of a set of sensors for the future. For example, you can add a special sensor designed to measure the temperature of water in ponds and springs, a water salinity sensor (TDS meter), and add the ability to store the corresponding measurement history in the software. Indeed, it is sometimes interesting to measure the temperature of the water in a pond, and the temperature sensors available in the device are somewhat inert and not intended for diving, although diving is harmless to them. In addition, you can add an ultraviolet sensor to a set of light sensors to determine how dangerous it is to be in bright sunlight with the current state of the atmosphere.
The design of the instrument housing of the second version also has some margin for further weight and size reduction. By reducing the wall thickness, using a softer gasket and a thinner cover (for example, from tempered glass), reducing the size of the battery can make the case somewhat smaller and lighter. Separately, it should be said that I managed to find the 2.4-inch transflective screen produced at a resolution of 2.4 ”and 320x240 pixels. Therefore, it will be possible to make the third version of the device entirely from commercially available components. However, when switching to a higher resolution screen, you should increase the processor clock frequency so that the redrawing does not take too much time and increase the amount of RAM to effectively use the increased number of pixels on the screen, reducing the minimum number of degrees, meters and minutes per pixel. For this reason, the third version of the device is likely to be assembled on an AVR Xmega or STM32 series microcontroller.
The source code of the program, curves for milling and layout of the board are available here .
Source: https://habr.com/ru/post/384641/
All Articles