Accountancy report in 1C: simple, but with taste

Fifteen years ago, I developed an accounting science - a discipline that lies at the junction of computer science, philosophy, economics and accounting. Like every utopian, he slept and saw how theoretical developments are implemented, however ...
Further it is clear, it is possible not to continue.
')
However, a holiday happened on my street. The involvement in the roles of the project manager and systems analyst made it possible to implement a tiny appendix of accounting theory, namely accounting reports. I say “accounting” so that everyone understands their purpose: to provide correct information about the movement of things and money in the production process. It sounds standard. Reports look like typical accounting: only the presence of a couple of features available to the eye of an experienced methodologist makes them unusual - account management.
The implementation was made in 1C - the environment in which the main project was executed. The accounting rules and 1C database, sharpened for them, are not the best way to implement accounting ideas. Despite this, the result was not devoid of grace, while suitable for practical use.
If this topic is interesting to someone, welcome.
Formulation of the problem
Baseline: there is an online store.
The principle of work: ordinary resale. A retail customer places an order, an online store buys the right product from a wholesale supplier, the difference between wholesale and retail prices is profit.
Task: to design an accounting report.
Data composer
For implementation, the 1C data linker was used. The coolest thing, I tell you - allows you to set a hierarchy of analytical features (product properties) according to related relational tables.

For a long time I believed that the idea with an arbitrary hierarchical location of analytics applied to objects of any type is my own, but it turned out that it was implemented in the linker. Maybe not completely (after all, 1C has certain limitations), but to a great extent.
I became interested and sat down to google, and as a result I found out: the section appeared in 1C at the end of 2009. By that time my accounting science had already formed, but who knows when an unknown colleague planned everything? Everything else, the linker is a development tool, that is, by definition, more flexible and multifaceted than any report made with it.
I had to be very upset because he was not the most intelligent. From grief I recalled and came to the conclusion that the hierarchy of analytics was present in earlier, even in the earliest accounting programs. So 1C is also not the smartest, I am memoryless.
Interface
The hierarchy is derived by typical means. Initially, the interface was thought different, but this one turned out to be convenient.

Although not without flaws. In particular, the location in the same window of the indicators of the lower level and the total makes it difficult to comprehend: it is sometimes difficult to figure out where everything is and why identical numbers are arranged in a column under each other.

However, we turn to the content side.
Report form
What you see is still trivial: the hierarchy of properties, the initial balance, the arrival, consumption, final balance ...
Yes, I know how intricate accounting indicators can be, eighteen years ago I even published a brochure on this topic. Later he came to the conclusion: actually, why to excel? There are static, “eternal” fields that you cannot get rid of: income-expenditure, remnants, it is better to put them in the headers, whereas the variable part should be put into a collapsible-expandable hierarchy.
The result was a universal form for viewing arbitrary analytics. The unity of form with a variety of content is one of the fundamental differences between an accounting record and countless bookkeeping reports.
Gauges
In addition to the choice of analytics, there is a choice of meter (natural or cost accounting). How else?
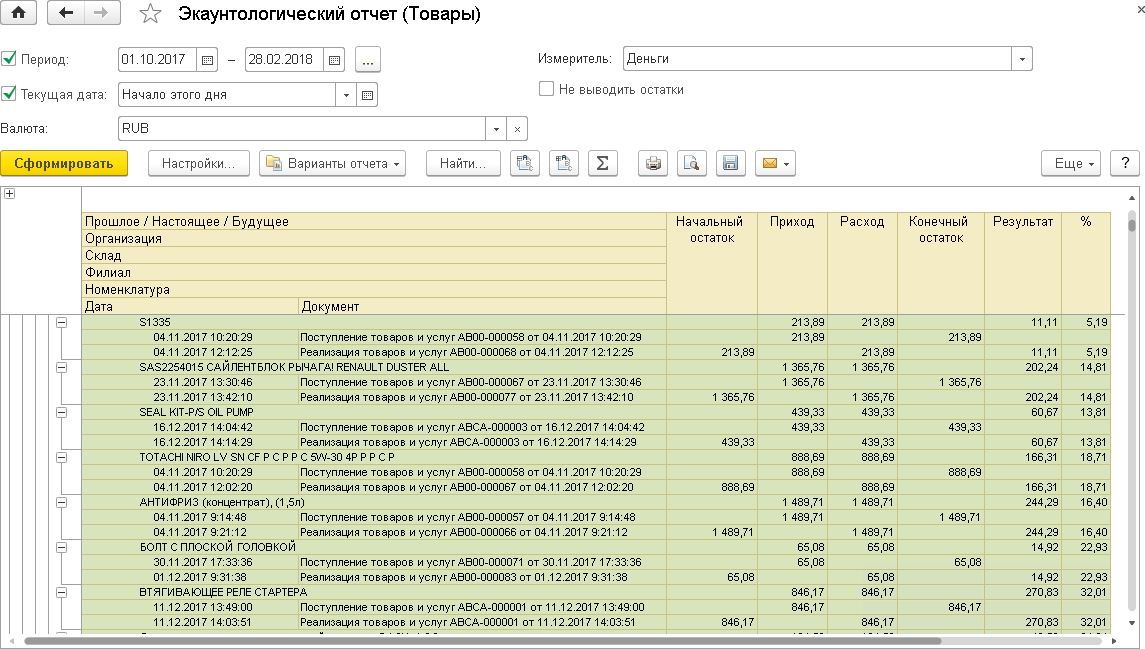
When registering in kind, the last two columns: "Result" and "%" (profitability) - did not matter, therefore they were not displayed. If the supplier received a piece of goods, then exactly the same was dropped when transferring to the customer. When cost accounting between income and expenditure there is a difference that makes up the financial result: profit or loss.
Considering the same result in a different currency, we obtain data in another currency, say, in euros. I don’t give a picture, it differs only in numerical values, so it’s not indicative.
Exchange difference
Here there is a first significant discrepancy with accounting, for which the correct accounting for exchange differences is unrepresentable. Although open secret does not make.
Purchased the goods for one dollar price, sold for the second, the difference between the named values is the financial result - in currency, of course. The bottom line is that exchange rates on the dates of purchase and sale are different .
The well-known economic paradox is present in many textbooks: ruble profits and, at the same time, currency losses. For example, bought a product for 100 rubles. and sold for 120 rubles. Ruble profit: 120 - 100 = 20 rubles. And currency? If you believe that 20 rubles. at the current rate, you are deeply mistaken. Suppose that during the purchase the ruble exchange rate collapsed from 10 rubles. up to 20 rubles for a dollar. Calculate dollar purchase and sale prices. The purchase price is: 100/10 = 10 dollars. The sale price is: 120/20 = 6 dollars. Total your dollar result was: 6 - 10 = - 4 dollars, that is, 4 dollars in the burnout. With a 20-ruble profit.
These are goods, and what is money, what happens to them when the course changes?
The rubles were lying on the checkout; suddenly, their attitude to the dollar had changed as usual: it turned out that rubles in dollar terms had fallen in price. I pay attention, they fell not at the time of the receipt and expenditure transaction with them and not at the end of the current month, as it is practiced in accounting, but at the time of the course change. This moment and should be displayed as a business transaction. There is no arrival-expense, but the result is obvious.

In the above example, you can see the change in the rate of the account balance. The balance of the ruble, we consider it in dollars. The result of a course change is a real exchange rate difference, not accounting digits converging arithmetically, but in reality meaning nothing. The rate has changed, as a result we won or lost a certain amount, while the amount in the storage currency remained the same.
However, the correct display of course changes is not the main thing in accounting records ...
Time scale
The main thing in accounting reports is the representation of objects on the time scale , the top item in the hierarchy of product properties:

We clearly share the past-present-future ... in life, but not in accounting. Why? Accounting method does not allow.
And accounting allows. For the purpose of registering future objects, time areas are highlighted in color in an accounting report.

The present, which is the boundary between past and future, is absent. As the popular song says: “There is only a moment between the past and the future, it is he who is called life”? By the way, a deep account statement.
In the area of the future, liabilities , property and cash, are recorded . That is, from the point of view of civil law and accounting, obligations erroneously recorded in the past as separate objects, and from the point of view of account management, future things or future money, the same things and money that are recorded in the past.
Not very clear? Now I will explain.
Shop customers make orders. What mutual obligations arise from this? On the one hand, customers undertake to pay for these orders on time (these are future receipts of money for the store); On the other hand, the store undertakes to deliver the goods necessary to customers in a timely manner (this is the future cost of the goods for the store). Future objects are displayed respectively in the cash and commodity reports in the future.
Here are the future receipts of money - customers' cash debts to the store:

But, already in the commodity report, the future expenses of the goods are the store’s real debts to customers:

Negative residues
Unusual negative product balance in the last picture? So after all, the store sells products to order! At the moment, the goods in the warehouse are not listed, the receipt is not expected. There is a future expense, but there is no future arrival, where can the positive balance come from?
A negative balance in the area of the future signals that we must transfer the goods to the customer, but this product is missing and its receipt is not planned.
The minus will disappear after the store orders the goods from the supplier, that is, we register a new pair of obligations in the system: the future arrival of the goods from the supplier and the future expenditure of money when paying the supplier. Then there will be four paired obligations: two according to settlements with the supplier (monetary and real), two according to settlements with the customer (also monetary and real, only income and expenditure are interchanged). All these objects are future - they just have to happen.
If everything really happens as we planned, revenues and expenses will move from the area of the future to the area of the past - a green one, in which cash goods have a strictly positive balance.
Overdue objects
And if not, if the money is not paid or the goods are not transferred? Then future arrivals or expenses will be overdue and fall into the area of the future marked in red.
Here they are expired objects:

Being in the red zone indicates that the expected maturity date has expired, but no actual redemption has occurred. This is its control value, it is not for nothing that the zone of delay is red (which, of course, can be changed to any other one due to the typical settings of the linker).
It seems we have reached the summary.
Summary
In addition to the standard features for the withdrawal of revolutions and balances in the context of arbitrary analytics, accounting records are:
1) ensure the correct calculation of the monetary financial result.
2) show overdue future parishes and expenses (red zone).
3) show future expenses not secured by revenues (negative balances).
The above is achieved through the joint display of past objects (cash and goods) and future objects (respectively, monetary and real obligations). Introduction to the system, at a lower conceptual level, the functions of time is certainly an innovative solution. Traditional accounting does not have such capabilities, I know for sure.

Regarding the presence of the listed in the third-party accounting software ...
The first point , according to the exchange rate difference, is probably made by whom, it’s too obvious. Although the standard configuration of 1C is not - probably because of the incompatibility of this item with the accounting legislation.
Point two? Overdue liabilities, subject to registration of the maturity date, can be obtained by sampling - there are no problems here. Original is the display of overdue objects between completed (past) and non-expired future objects. There, to him, to a failed but still supposed future, is the place.
The third point , related to the provision of future expenses, is a purely accountant feature, well-developed and suffered for many years. I doubt that it is implemented in a systematic way, at least somewhere.
The closest analogue is cash gaps. But cash gaps, firstly, belong to the same money (not things), and secondly, constituting the subject of planning, they are separated from the accounting system at a certain distance. However, accounting and planning in accounting records are an inseparable unity.
I did not hear about the product breaks, but just in case I decided to google it. Googling has shown that something close in meaning to product gaps is used in exchange activities. At the same time, such a term is not used in accounting, although the essence of the matter is quite accurate.
Unfulfilled
Unfortunately, not all of the plans were able to be implemented. There are two reasons, and both are valid:
1) 1C data structure, which simply did not allow
2) redundancy of the accountancy functional for the project in which the work was carried out.
First of all , the single report had to be divided in two, into cash and commodity. In accounting science things are characterized by the same sets of properties, in accounting, respectively, in 1C - different. For example, goods are characterized by a warehouse in which they are located, and money is a checking account or cash. Goods are characterized by a nomenclature, and money does not have such a property, etc. To bring together heterogeneous sets of properties that characterize money and goods turned out to be too complicated technical task for 1C. Although the presentation of goods with money - for example, as part of an order - would be more visual.
Secondly , it was not possible to achieve a full account of inflation. However, considerable opportunities for this are available even now, thanks to the directory of conventional units, typical in 1C. If this directory, along with reference books of foreign currencies, is filled in and selected as a gauge, then the objects will start to be displayed taking into account inflation. However, it is impossible to connect two directories at once: conventional units and foreign currencies, which may be required when analyzing the joint impact on the financial result of changes in currency rates and inflation. I did not insist on the implementation of such a special functionality because of its obvious lack of demand in the foreseeable future.
For the same reason, the option of buying and selling currency was not worked out, in the absence of this type of activity. This is the third .
Fourthly , failed to perform a normal retrospection. This refers to the following. In the settings, along with the usual parameters, the current date is indicated. This is the date from which the report is viewed (not the date on which balances are generated, as in the accounting reports, namely from which the review is conducted). When the viewing date is the same as today, there are no problems: all the parameters used are also current. When the date of viewing is relegated to the past, the parameters remain current, which makes it impossible to get a correct view from the past. Let's say the maturity date of the obligation has changed. Pulling this information out of 1C for placement in the report turned out to be problematic; accordingly, when the viewing date was “pushed back” to the past, the last date of repayment of the obligation, rather than the original, is used. The picture of the past is based on current data, and should be on the past, corresponding to the date set. He didn’t balk because the retrospective viewpoint has a more theoretical than practical meaning.
Fifthly , the “number of units” meter, which is necessary for calculating the number of the item to be accounted for, was not implemented (not to be confused with pieces of goods). Yes, a lot more that was not implemented!
Although generally satisfied. Fifteen years later, as a small, but quite an accounological feature - placing past and future objects on the time scale - appeared in a commercial product. It turned out nice and, most importantly, practical.
Who would have thought!
Source: https://habr.com/ru/post/374281/
All Articles