NASA explained the appearance of excess 2.5 gigatons of CO₂ in the atmosphere in 2015
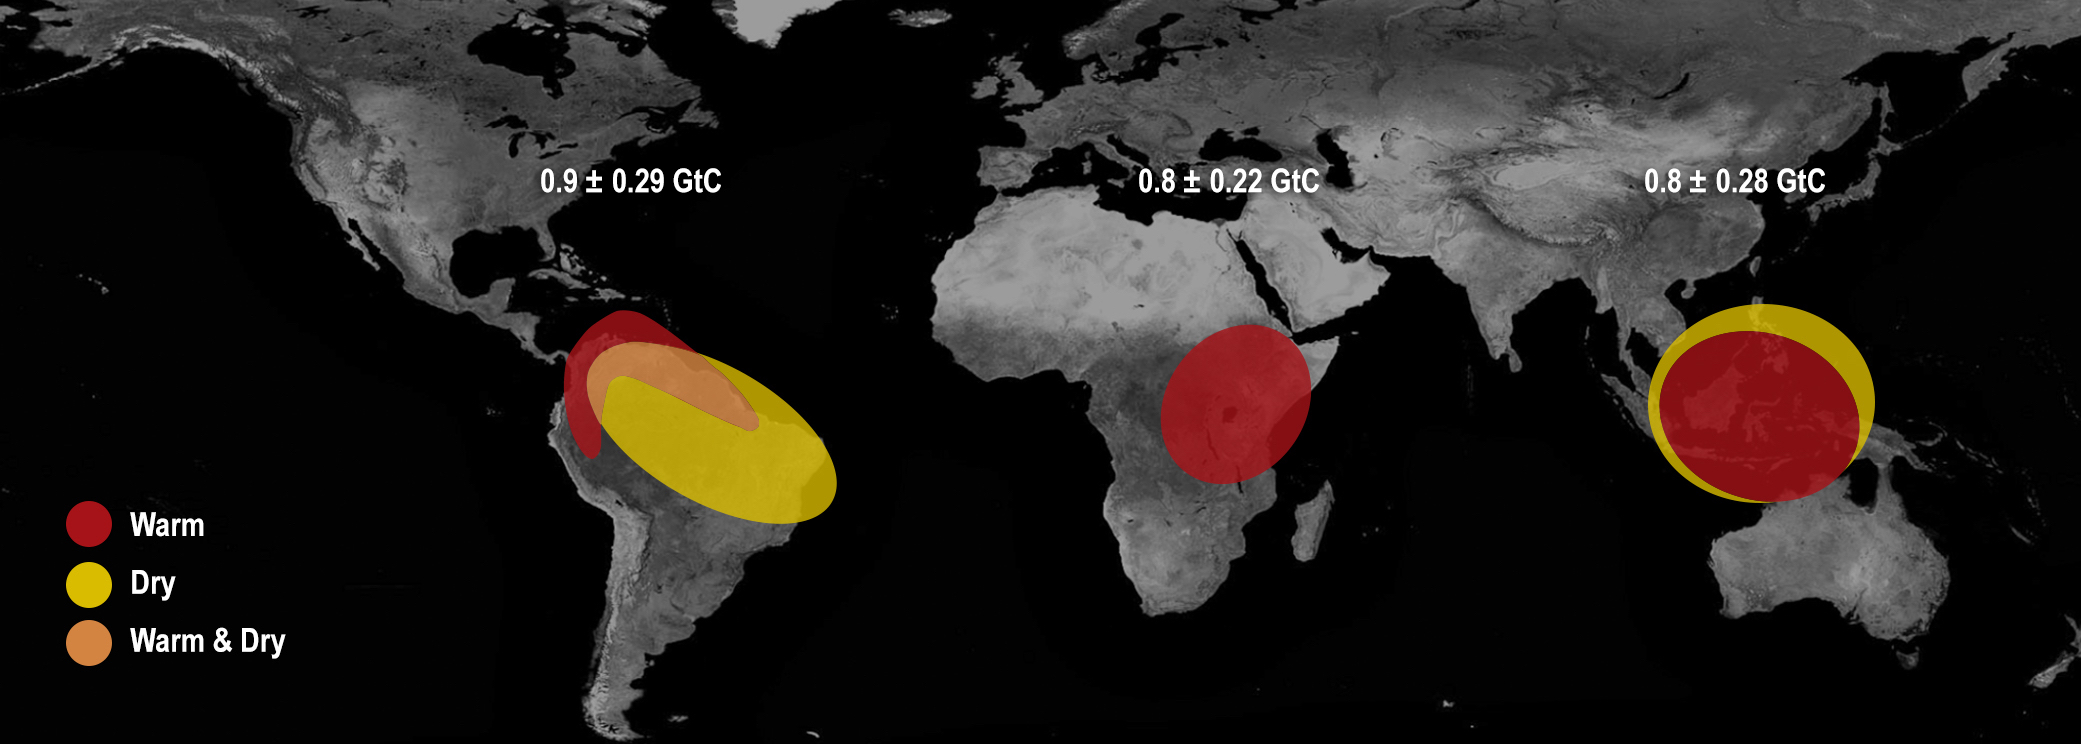
Due to temperature fluctuations of the surface water layer in the equatorial Pacific Ocean, each of the three tropical regions emitted a record amount of CO 2 in the years 2015-2016
Since the beginning of the 19th century, the amount of CO 2 in the Earth’s atmosphere has been continuously increasing every year. Before the Great Industrial Revolution, there were about 595 gigatons of carbon in the form of CO 2 in the atmosphere, and now this amount is 850 gigatons.
The ocean and land each year recycle about half of the CO 2 emissions that occur as a result of human activity. Over the years, the percentage of processing ranges from 20% to 80%. Unprocessed CO 2 accumulates in the atmosphere, each year increasing the carbon balance and increasing the "greenhouse effect".
')
But in 2015-2016, a strange event happened that had previously been recorded by the US National Oceanic and Atmospheric Administration. During these years, atmospheric CO 2 jumped sharply to a maximum level in the last 2,000 years, although emissions from human activity remained at the same level. NASA has now explained this phenomenon by analyzing the readings from the Orbiting Carbon Observatory-2 (OCO-2) satellite, the first and only observatory of NASA for CO 2 monitoring.
The National Oceanic and Atmospheric Administration suggested that the emission of “extra” 2.5 gigatons of CO 2 and a record jump in carbon dioxide in the atmosphere with a subsequent greenhouse effect and natural disasters around the globe is a manifestation of the El Nino effect, that is, cyclical fluctuations surface water temperatures in the equatorial Pacific. El Nino is known to have a significant impact on the Earth’s climate. Due to temperature fluctuations, an El Nino flow occurs when the region of heated near-surface water shifts to the east. At the same time, the trade winds weaken or stop altogether; the rise to the surface of the deep waters in the eastern Pacific Ocean, off the coast of Peru, slows down.
It was assumed that the increase in CO 2 is somehow related to El Niño. But the concrete chain of interrelations which led to such consequences was not clear. The OCO-2 satellite brought clarity: now these climate effects can be linked together.

OCO-2 Observatory. Render: NASA / JPL-Caltech
Data analysis after the first 28 months of operation of the OCO-2 observatory has led to the conclusion that El Nino caused an anomalous temperature increase and drought in tropical regions of South America, Africa and Indonesia. In 2015-2016, the El Nino was the strongest since the 1950s, and therefore the effect was so dramatic. In South America, there was a severe drought in the last 30 years, the temperature was also above normal. Extreme weather conditions suppressed vegetation and reduced the amount of photosynthesis, due to which trees and plants removed less carbon dioxide from the atmosphere. Accordingly, the balance of absorbed and released CO 2 shifted in a negative direction.
In Africa, El Nino was different. There, rainfall remained at a normal level, but the temperature was much higher than average. In a hot atmosphere, dead trees and plants began to decompose faster, increasing carbon dioxide emissions into the atmosphere. Although the effect was different, the result was the same: the extra 0.8 gigatons of carbon in the atmosphere.
As a result, in 2015, these tropical regions emitted 2.5 ± 0.34 gigatons of CO 2 into the atmosphere more than in 2011 (according to the balance). Although usually the amount of carbon in the atmosphere in previous years increased by an average of 4 gigatons, in 2015 it increased immediately by 6.3 gigatons, although emissions from human activity remained at the same level.
In total, carbon emissions from the Earth’s land area in 2015 increased by 3 gigatons due to El Niño, of which more than 80% (2.5 gigatons) of the above mentioned tropical regions provided.
Comparison with 2011 was carried out according to the Japanese satellite Greenhouse Gases Observing Satellite (GOSAT). Six years ago, the climate in those areas was normal, and the amount of carbon dioxide consumed and released was balanced.
The OCO-2 satellite will continue to operate: it is capable of making up to 100,000 measurements per day of carbon dioxide concentration in different regions of the Earth.
The scientific article was published on October 13, 2017 in the journal Science (doi: 10.1126 / science.aam5690).
Source: https://habr.com/ru/post/373895/
All Articles