What can be algorithms for trading on the stock exchange: Basic classification
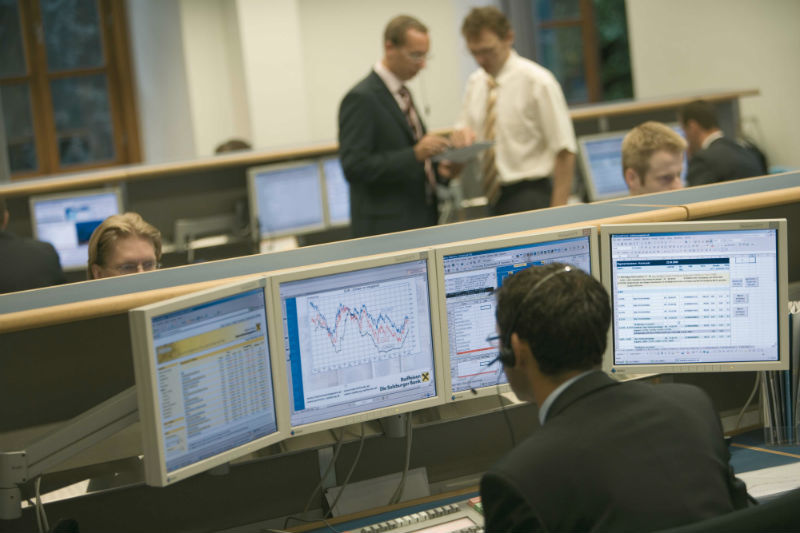
In our blog, we write a lot about trading on the exchange and the technologies used for this. In particular, much attention is paid to algorithms for solving various tasks from data processing using FPGA to detecting insider trading .
Quora resource users wondered what kind of online trading algorithms are. The best answer was given by the developer of trading robots, Jae Yang. We present to your attention a description of its classification.
')
According to Yang, there are 4 basic types of algorithms for trading:
- order execution algorithms;
- algorithms that use behavioral factors;
- scalping algorithms;
- predictive algorithms.
Now about each of them in order.
Order Execution Algorithms
Many large funds are forced to constantly redistribute their funds between various assets. To achieve the highest trading efficiency, various algorithms are used. The simplest options are TWAP (time-weighted average price) and VWAP (weighted average price by volume). There are more sophisticated, but performing, in fact, the same tasks - for example, the Port-X algorithm developed in Goldman Sachs (the link shows all the algorithms used in the investment bank).
The general principle of operation of such algorithms is as follows: they assess the state of the stock market for a certain time and rationally place buy or sell warrants. In order not to depend too much on price hikes, it is more profitable for a trader to break an asset into many small blocks. Suppose he needs to execute an order for an asset worth $ 100 million, for which the average daily trading volume is $ 1 million. In this case, the investor is too dependent on the impact of the price if he does not rationally distribute orders for a sufficiently long period of time.
Imagine that you need buckets to fill the pool. You cannot do this without splashing water in the process.
At the other end of the spectrum we are waiting for the fertile sphere of high-frequency trading. Here algorithms can be divided into two general categories.
Algorithms of behavioral factors
They are based on an analysis of the actions of competitors working with a specific trader in the “one territory”. In the case of assets with little liquidity, most often, there is one big player and all the rest. Under such conditions, recognizing the behavior of rivals becomes quite a feasible task than with 10,000 equal-power traders. In order to build a system that can benefit from the actions of opponents, it is enough to understand what rules they follow and when they deviate from them.
Scalping Algorithms
Companies engaged in high-frequency trading (HFT) are constantly competing in who is the fastest shooter in the Wild West. Excellent opportunities for arbitrage prices appear at the level of the microstructure of the market. If, for example, a glass at some point has a bid of $ 10 and a ask of $ 10.1, then it seems that there is no benefit in this (in this material we considered the question of the rationality of the scalping strategies ).
At the macro level, such fluctuations occur constantly. In order to initiate and conduct a transaction, you need someone who offers the same or greater amount than the requested one. Often, this happens when in reality there is a bid for $ 10,0001 and a ask for $ 10. This is where speed comes into play. The fastest computers are able to catch this difference of $ 0.0001. The system opens a position at $ 10 and sells to someone for $ 10,001. Scalping algorithms should be fast and efficient. Most often, they are developed, tested and deployed on ASIC or FPGA circuits (we wrote about it here ).
Predictive algorithms
In most cases, when someone talks about trading algorithms, he means exactly this kind of them. Forecasting algorithms include all variants of predicting market behavior based on the analysis of past information, new data and any secondary information. They can be divided into several subcategories, according to the applied methods:
- return to average;
- following the trend;
- price curve patterns;
- fundamental analysis;
- portfolio balancing.
The return to the average is based on the idea that there is some “fair” price to which the market returns. Algorithms using this technique try to create patterns of the normalized price, based on analogs, certain reference points or previous values. Trading currency pairs is the easiest example. Correlation of values is calculated for two markets in order to understand in which case you can buy another one for one currency. When to open a short position and close if the pair is trading again in tandem. In order for the system to work, then the curve pattern algorithms are applied.
Trend following algorithms are designed to detect the presence of long-term trends for specific asset classes. The effectiveness of such algorithms depends on whether the system will be able to determine who is currently opening positions. The stock market is an example of a large collective hunt, where each player has a goal. Therefore, in the movement of prices it is difficult to catch any patterns. Nevertheless, there are people who are confident that secondary information on the movement of money from one asset to another, with the correct diagnosis of the entire grid, yields a result. That is, to put it simply, the value of the price is influenced by many additional factors, and not just the demand-supply balance.
Algorithms that rely on the curve pattern analysis method follow the old idea, like the world, that “pictures and graphics do not lie”. It is also sometimes called technical analysis. It deals with a set of patterns describing the behavior of a curve. For example: “double top”, “head and shoulders” and so on.
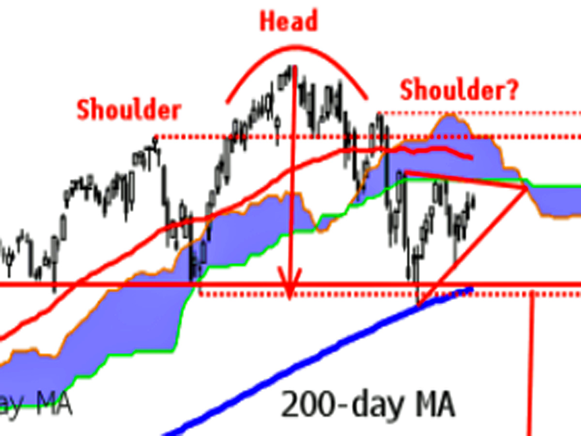
Technical analysis head and shoulders
Despite some old-fashioned belief in the power of charts and graphs, serious articles continue to appear on the topic of how to make money by studying patterns of price behavior. Here is an example of such a study .
Fundamental analysis deals with the data of company reports and state statistics in order to determine in which case a particular market is overvalued or undervalued in comparison with similar ones. Large companies have a staff of analysts, allowing them to do this much more effectively than private investors. The latter, for example, simply do not have time to count such things as conditionally, how many pairs of jeans sold the largest US retailer Gap. In these systems, macroeconomic data can also be used to determine global cycles.
Balancing the investment portfolio is based on two different ideas about the behavior of the stock market. There is a type of algorithm called Smart Beta. It operates on the principle of “free cheese”, where “cheese” is a portfolio of assets with low volatility. There is also a type of online algorithms, the essence of which comes down to analyzing the cash flow index and applying the rule of return to the mean value.
Of course, this classification is incomplete and does not include, for example, algorithms for analyzing public opinion (in social networks or using services like Google Trends ), studying news or analytics forecasts, as well as machine learning algorithms (in the "with teacher" format and without ). However, it allows novice traders to form a basic understanding of the variety of existing algorithms for trading.
Other materials on the topic of algorithmic trading in the ITinvest blog:
- How Big Data is Used to Analyze the Stock Market
- Experiment: the creation of an algorithm for predicting the behavior of stock indices
- GPU vs CPU: Why are GPUs used to analyze financial data
- How to predict a stock price: An adaptive filtering algorithm
- Algorithms and trading on the stock exchange: Hiding large transactions and predicting the price of shares
Source: https://habr.com/ru/post/372019/
All Articles