Monitoring video surveillance systems with Zabbix

Zabbix monitoring system has long established itself as an easy-to-install and configure solution that helps maintain servers, sites, networks, etc., and many administrators choose it to solve their problems thanks to stable 24/7 operation and flexible configuration options. Despite this, there are very few online instructions for setting up zabbix for video surveillance, which prompted us to write this article.
Why do you need monitoring
Basically, the zabbix system is used by experienced users, for whom its installation and configuration are not particularly difficult. But what about the rest? In this article we will try to help understand the basics of the work and show the main points for further self-study of the zabbix monitoring system.
')
We will talk about installing a Zabbix server and agent on Windows and Linux. We will answer the question of how to set up notifications about loss of communication with cameras, high CPU load on the server, problems with client sites, and touch on standard templates a bit.
It is worth saying that in IP-video surveillance each element has its own IP-address, therefore it is desirable that the elements of the system with which we will work have static IP-addresses for more convenient configuration of the monitoring system.
Zabbix: launch and configuration
So, Zabbix software is built on the principle of "server - agent".
The server collects and stores all the information, with its help you can quickly view the monitoring history, the configured nodes, and add new nodes, rules, etc.
The agent is installed on the computer from which you are interested.
Zabbix server part runs under Linux system. Since this article is intended for people who will encounter this OS for the first time, we recommend starting with the Ubuntu operating system, it is more friendly to beginners. All information on it can be found in the official Russian community ubuntu.ru . There you can also see installation instructions on a PC or on a virtual machine, for example, Oracle VM VirtualBox.
After starting the system, you must immediately update the packages of your OS.
To do this, open the console ctrl + alt + t and enter the command
sudo apt update && sudo apt upgrade You may have to wait a few minutes for all the packages to be updated.
We also need a text editor:
sudo apt-get install mcedit Next, we translate the system language into Russian:
sudo locale-gen ru_RU To work with zabbix, you need to install a MySQL database and an Apache web server:
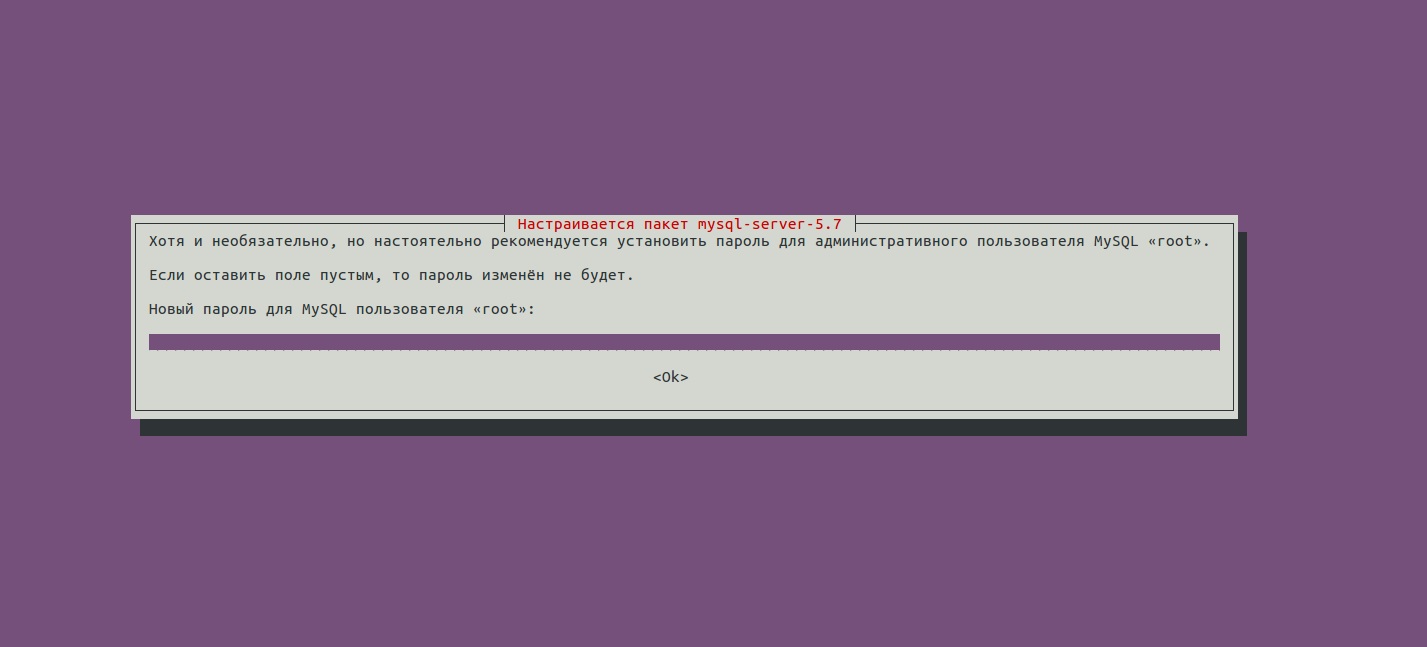
sudo apt install mysql-server mysql-client apache2 Set a password for the root user from MySQL.
Now install the necessary PHP dependencies:
sudo apt install php-mbstring php-bcmath php-xml And restart Apache:
sudo service apache2 reload Then you can begin to install the monitoring system itself. Step-by-step instruction is described on the official Zabbix website , let's go through them together:
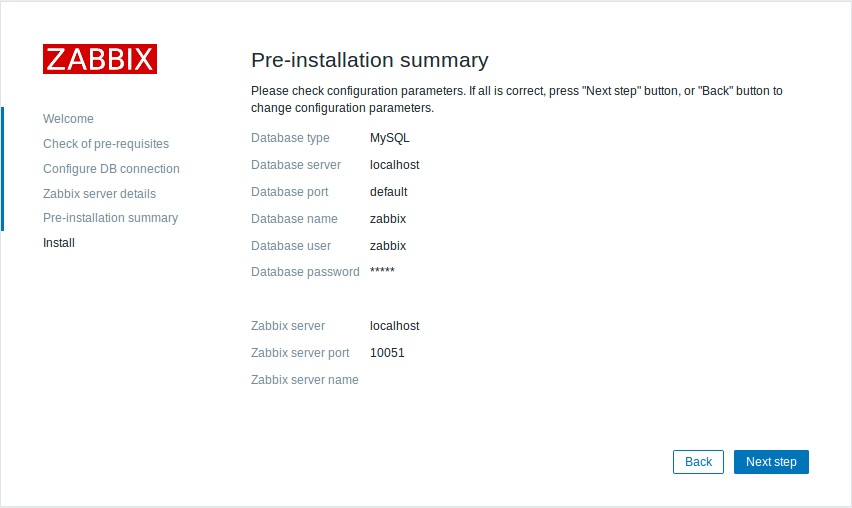
1) Choose our platform for the Zabbix server. As a database we use MySQL.
2) Download and install the Zabbix repository:
wget http://repo.zabbix.com/zabbix/3.4/ubuntu/pool/main/z/zabbix-release/zabbix-release_3.4-1+xenial_all.deb sudo dpkg -i zabbix-release_3.4-1+xenial_all.deb sudo apt update 3) Install zabbix-server-mysql, zabbix-frontend-php and zabbix-agent,
sudo apt install zabbix-server-mysql zabbix-frontend-php zabbix-agent 4) Create a MySQL database for Zabbix:
sudo mysql -uroot –p mysql> create database zabbix character set utf8 collate utf8_bin; mysql> grant all privileges on zabbix.* to zabbix@localhost identified by ''; mysql> quit Now fill the database, it will take some time:
cd /usr/share/doc/zabbix-server-mysql/ zcat create.sql.gz | mysql -uzabbix -p zabbix 5) Configuring Zabbix server configurations:
Open the configuration file through a text editor.
sudo mcedit /etc/zabbix/zabbix_server.conf And fill in the following fields:
DBHost=localhost DBName=zabbix DBUser=zabbix DBPassword= 6) The following 2 steps are swapped.
Set the time zone in the web server settings:
sudo mcedit /etc/apache2/conf-available/zabbix.conf <IfModule mod_php7.c> php_value max_execution_time 300 php_value memory_limit 128M php_value post_max_size 16M php_value upload_max_filesize 2M php_value max_input_time 300 php_value always_populate_raw_post_data -1 php_value date.timezone Europe/Moscow </IfModule> <IfModule mod_php5.c> php_value max_execution_time 300 php_value memory_limit 128M php_value post_max_size 16M php_value upload_max_filesize 2M php_value max_input_time 300 php_value always_populate_raw_post_data -1 php_value date.timezone Europe/Moscow </IfModule> And restart it:
sudo service apache2 reload 7) Done, you can run the Zabbix server:
sudo systemctl start zabbix-server sudo systemctl enable zabbix-server We make a small check:
systemctl status zabbix-server zabbix-agent The following message should appear:
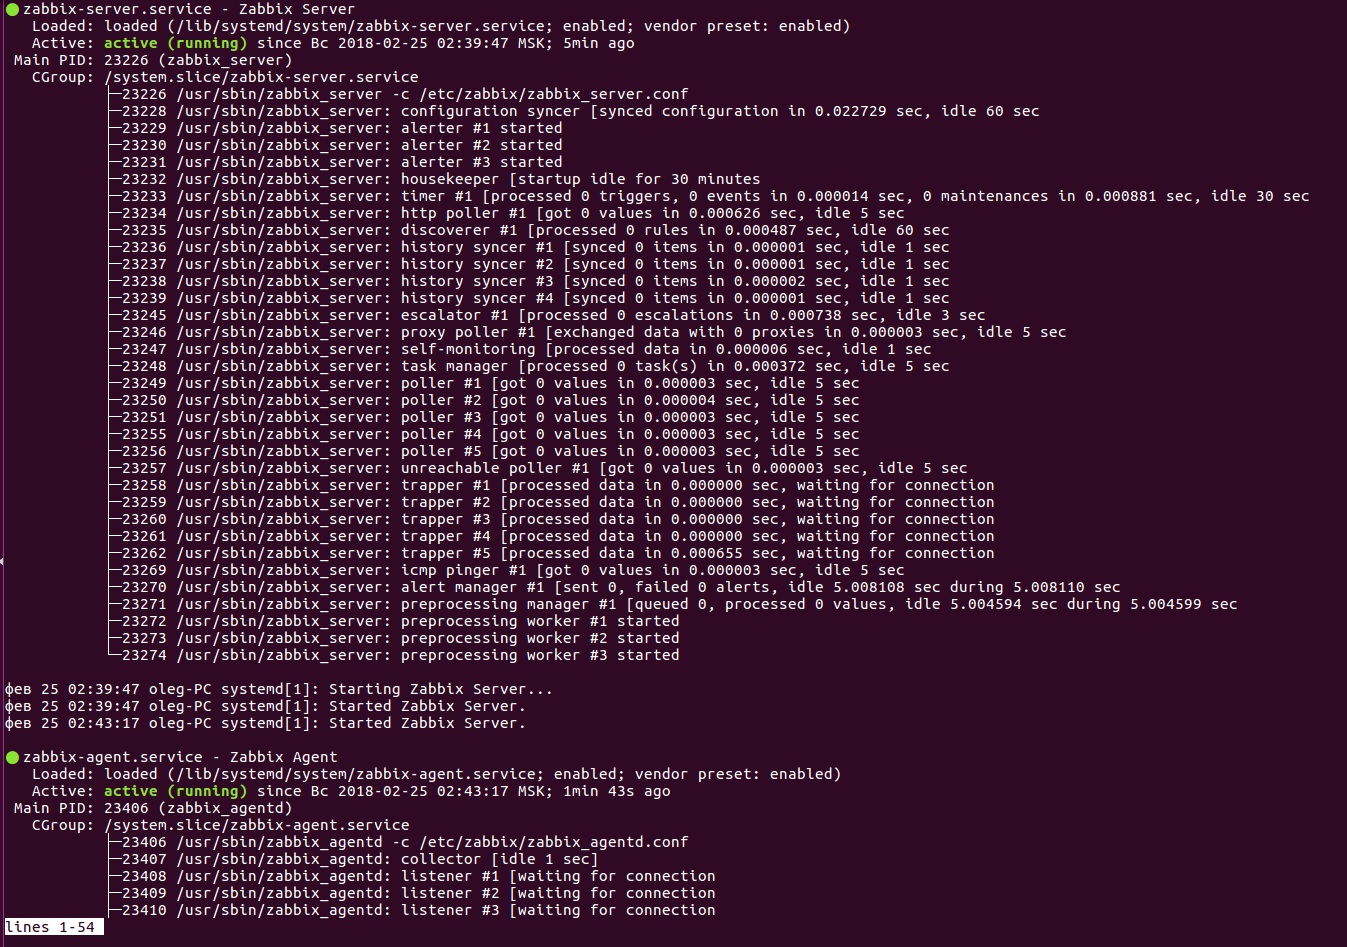
Configuring the Zabbix web interface
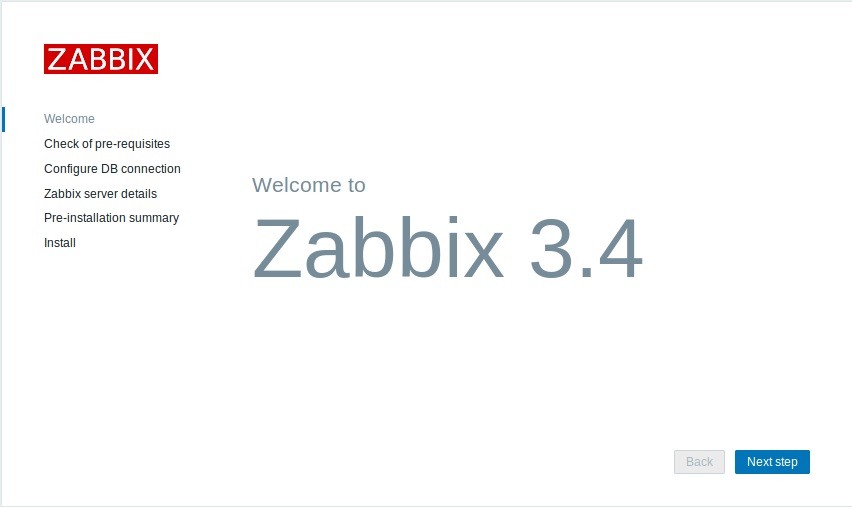
Now you can go to the Zabbix web-interface, for this you need to enter in the browser:
http://localhost/zabbix We are greeted by the setup wizard.
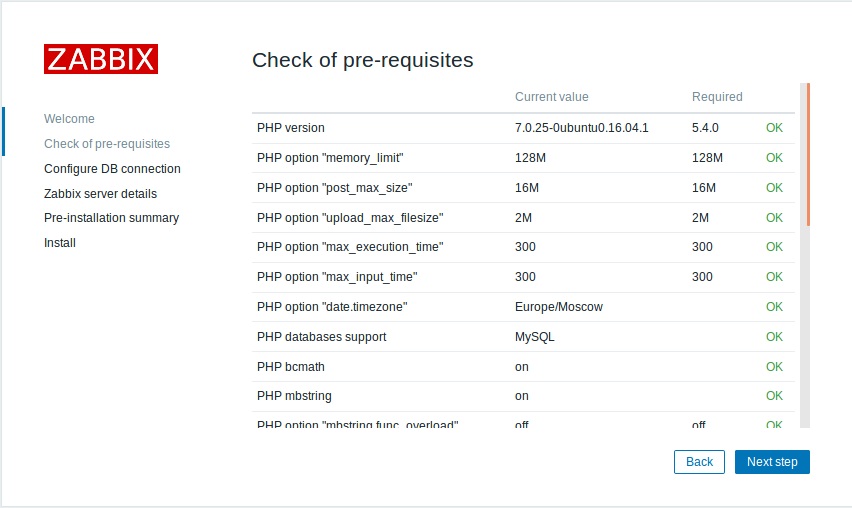
For the most part, we’ll click next.


Here you need to enter the previously set password.
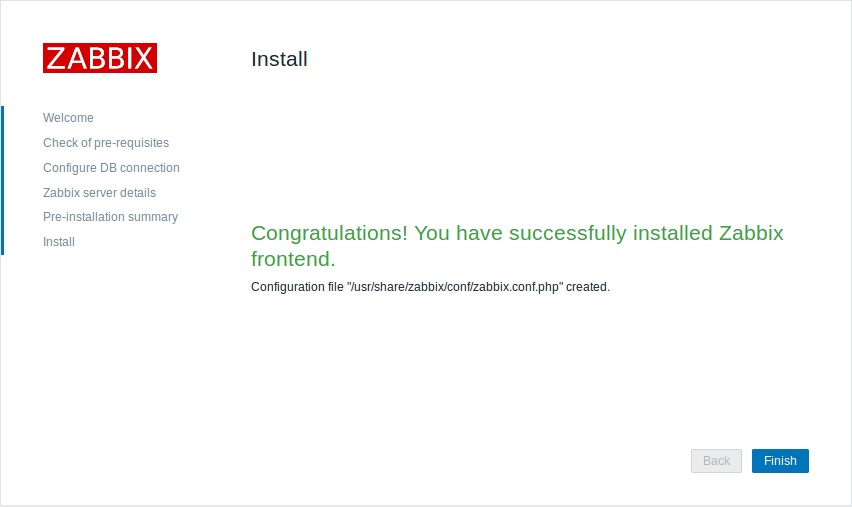

At the end, the authorization window will appear, by default the user is Admin, the password is zabbix.
Here you need to enter the previously set password.
At the end, the authorization window will appear, by default the user is Admin, the password is zabbix.
We change the language through the user settings.
Go to profile.
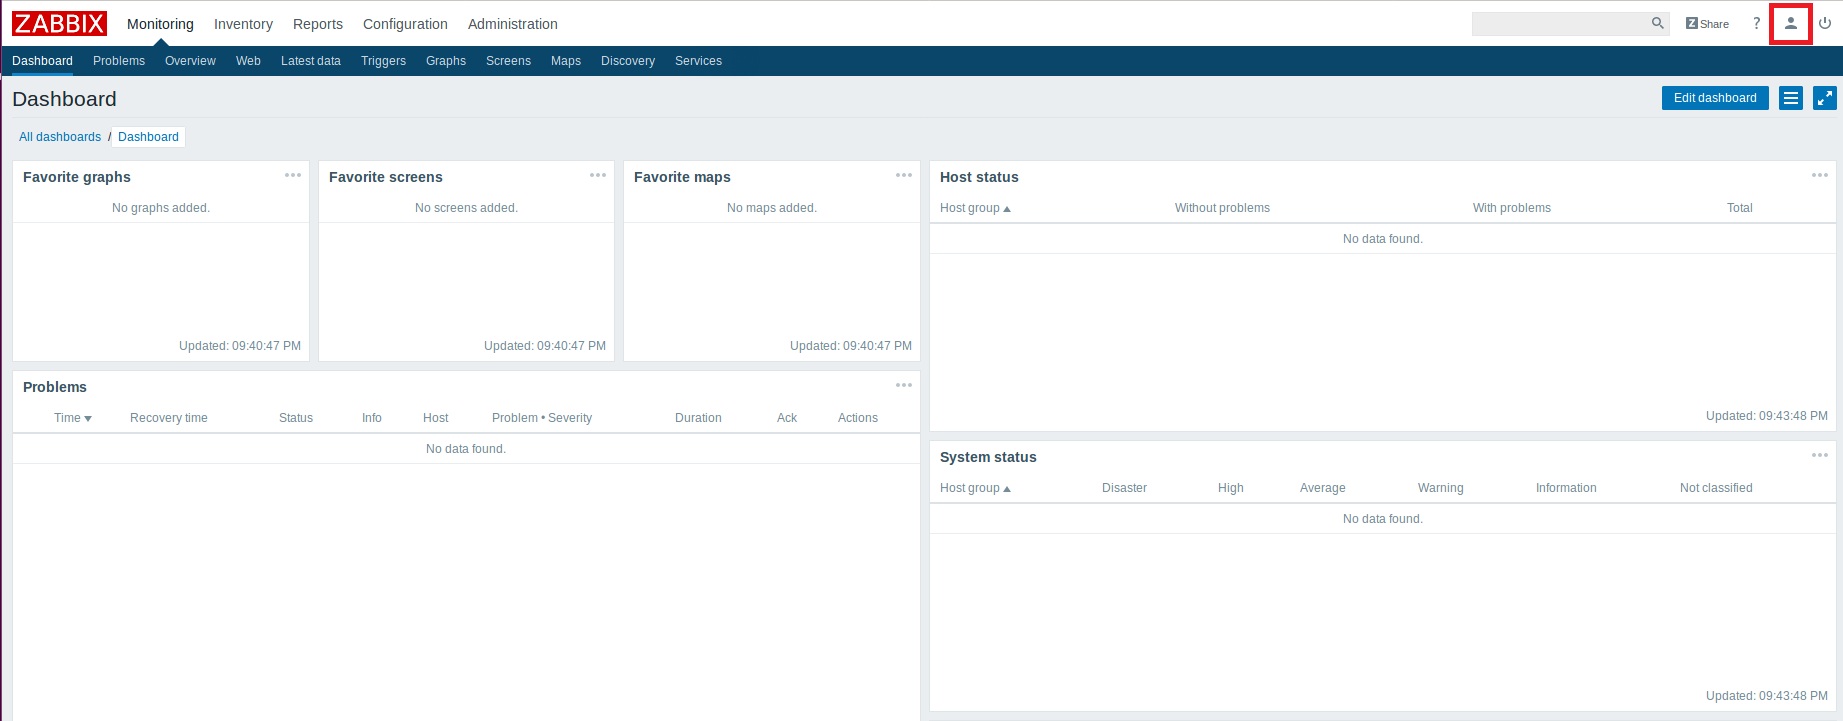
Choosing Russian language.

Change the password from zabbix to your own and click Update.

Choosing Russian language.
Change the password from zabbix to your own and click Update.
Monitoring settings, templates, triggers
Zabbix server
We now turn to the main point, namely setting up monitoring.
Go to "Settings" - "Host groups".
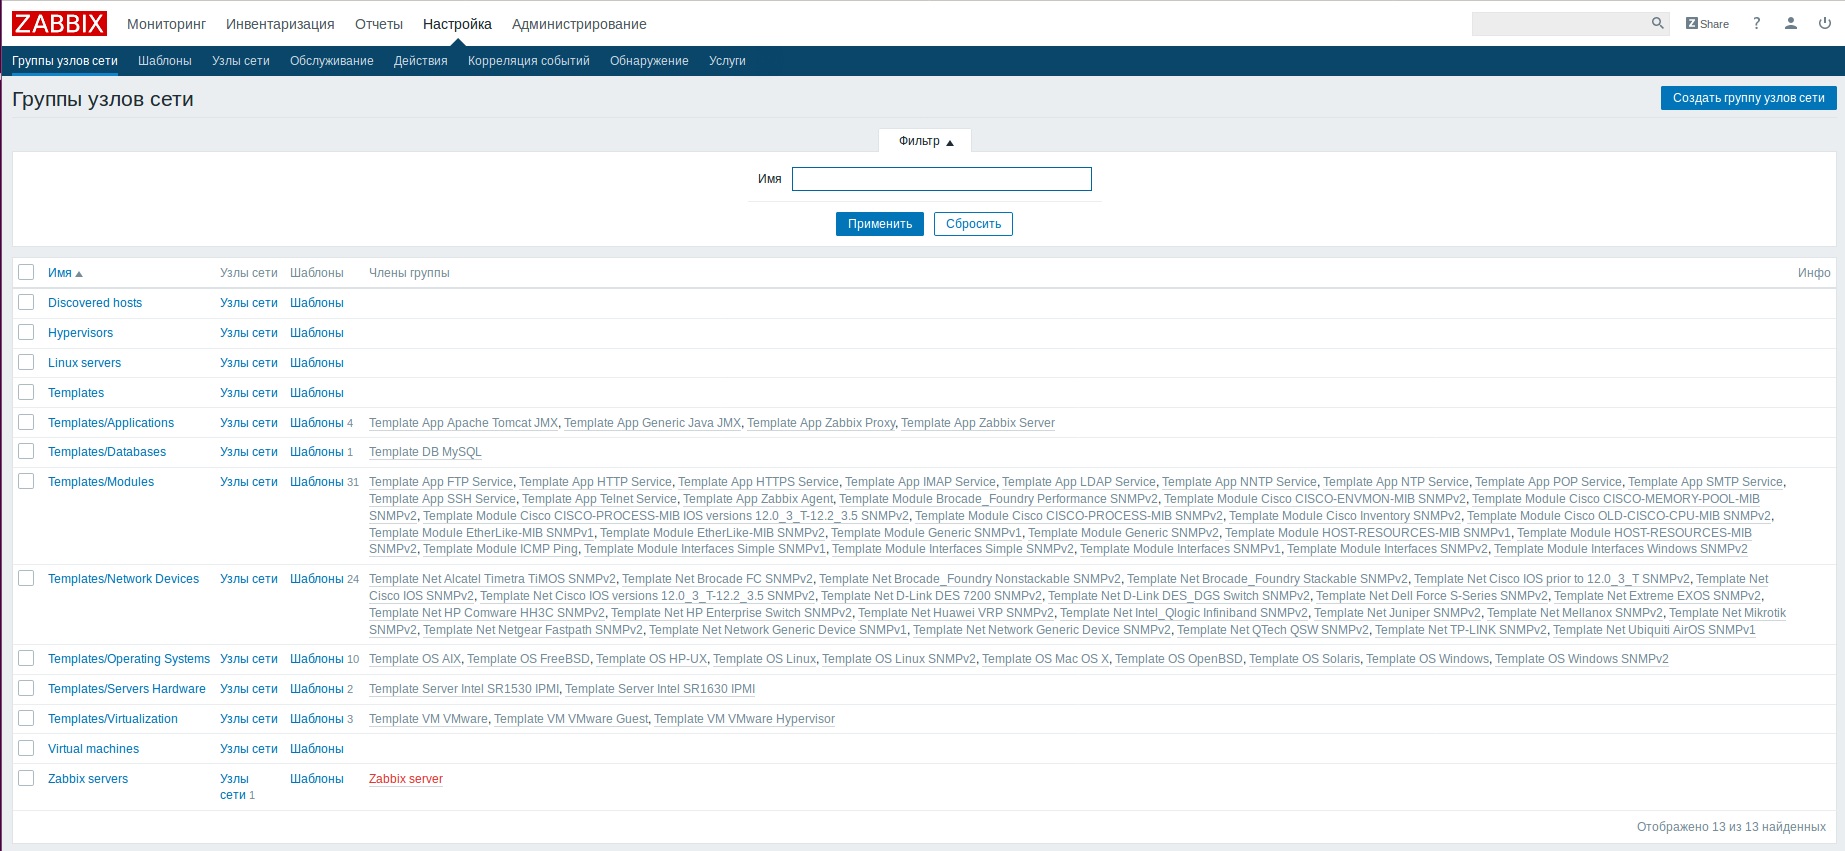
Here we will see the previously created system groups, you do not need to delete them.
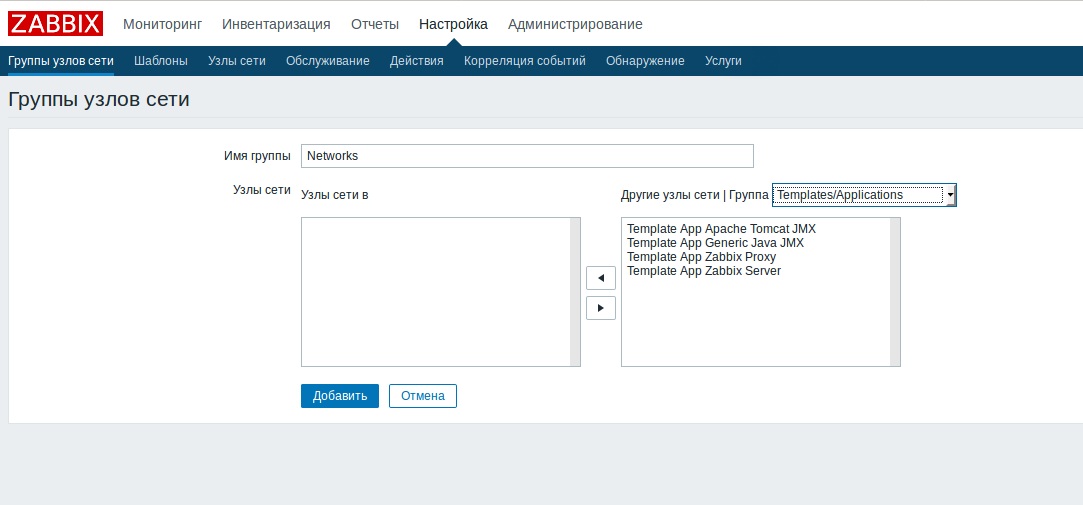
Click "Create a host group". Fill in the group name, for example, Networks. We do not add nodes yet. Click "Add".
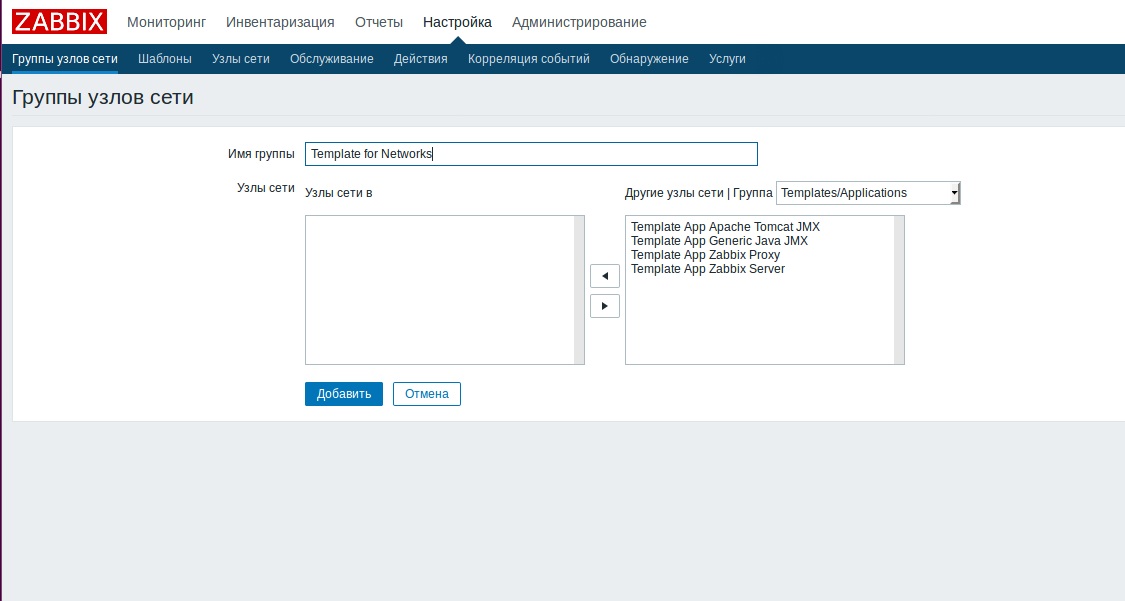
We will also need a group for our templates, click "Create a group of network nodes", in the "Name" field we write: Templates for Networks. Click "Add".
Templates
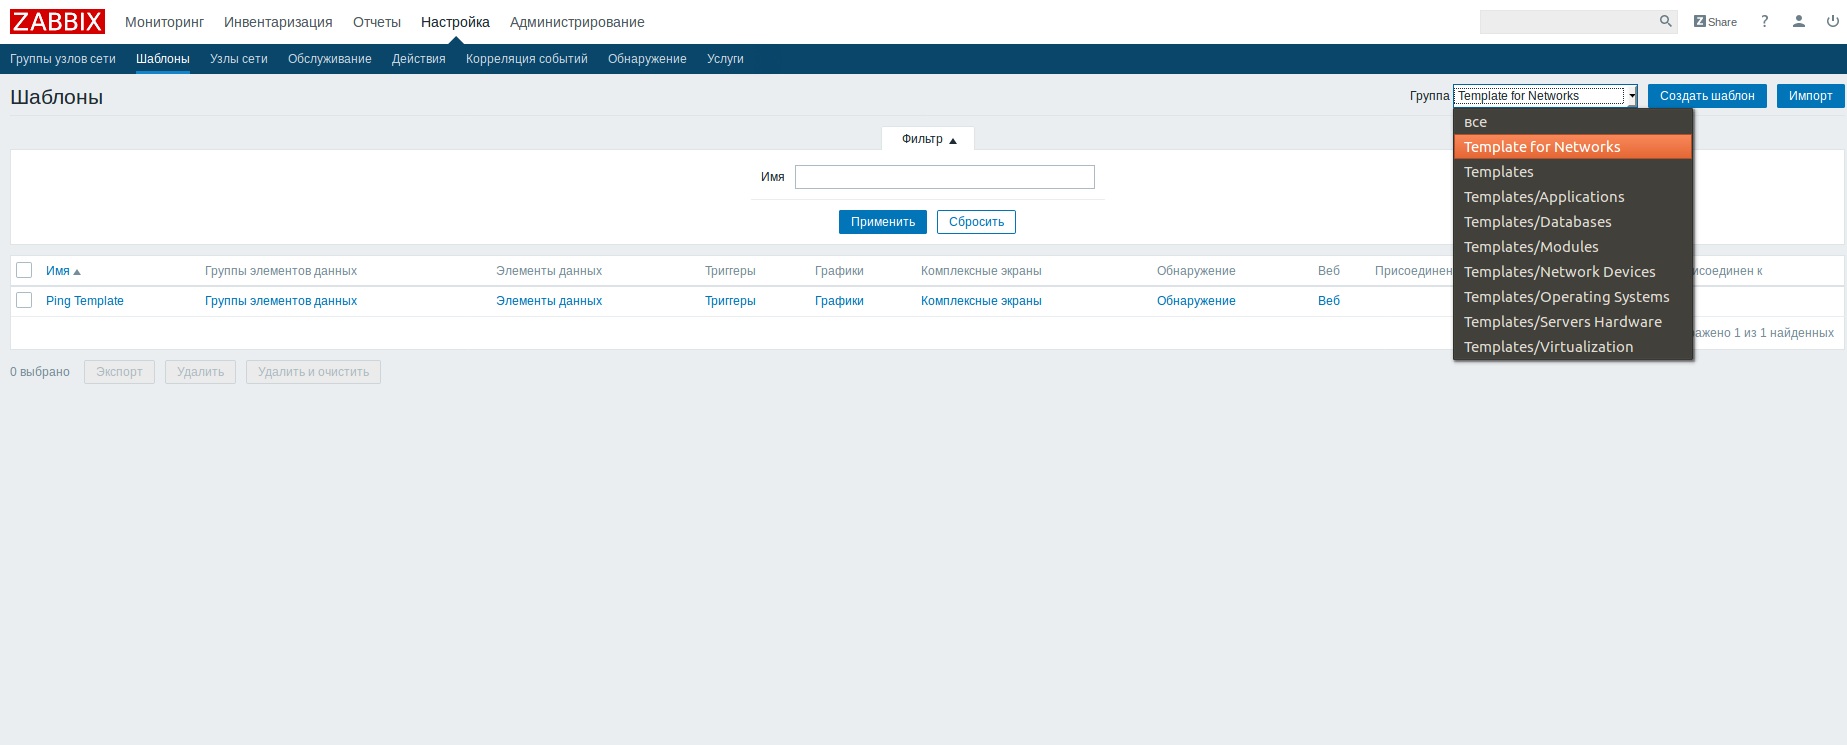
Now let's move on to the templates: “Settings” - “Templates” - “Create a Template”.
Since we work with IP cameras and servers, the first template is to make a node check by pinging.
Enter the name of the template, for example, Ping Template. We add our group Templates for Networks and we can add a description by the “Add” button.

Now we can select a group for templates to see our templates.
Add a data item to the template, to do this, click "Data items" - "Create data items".
In the field "Name" we indicate Ping.
"Key" - click "Select" and select the first key. It will return 1 if successful ping and 0 if unsuccessful, that's enough for us.
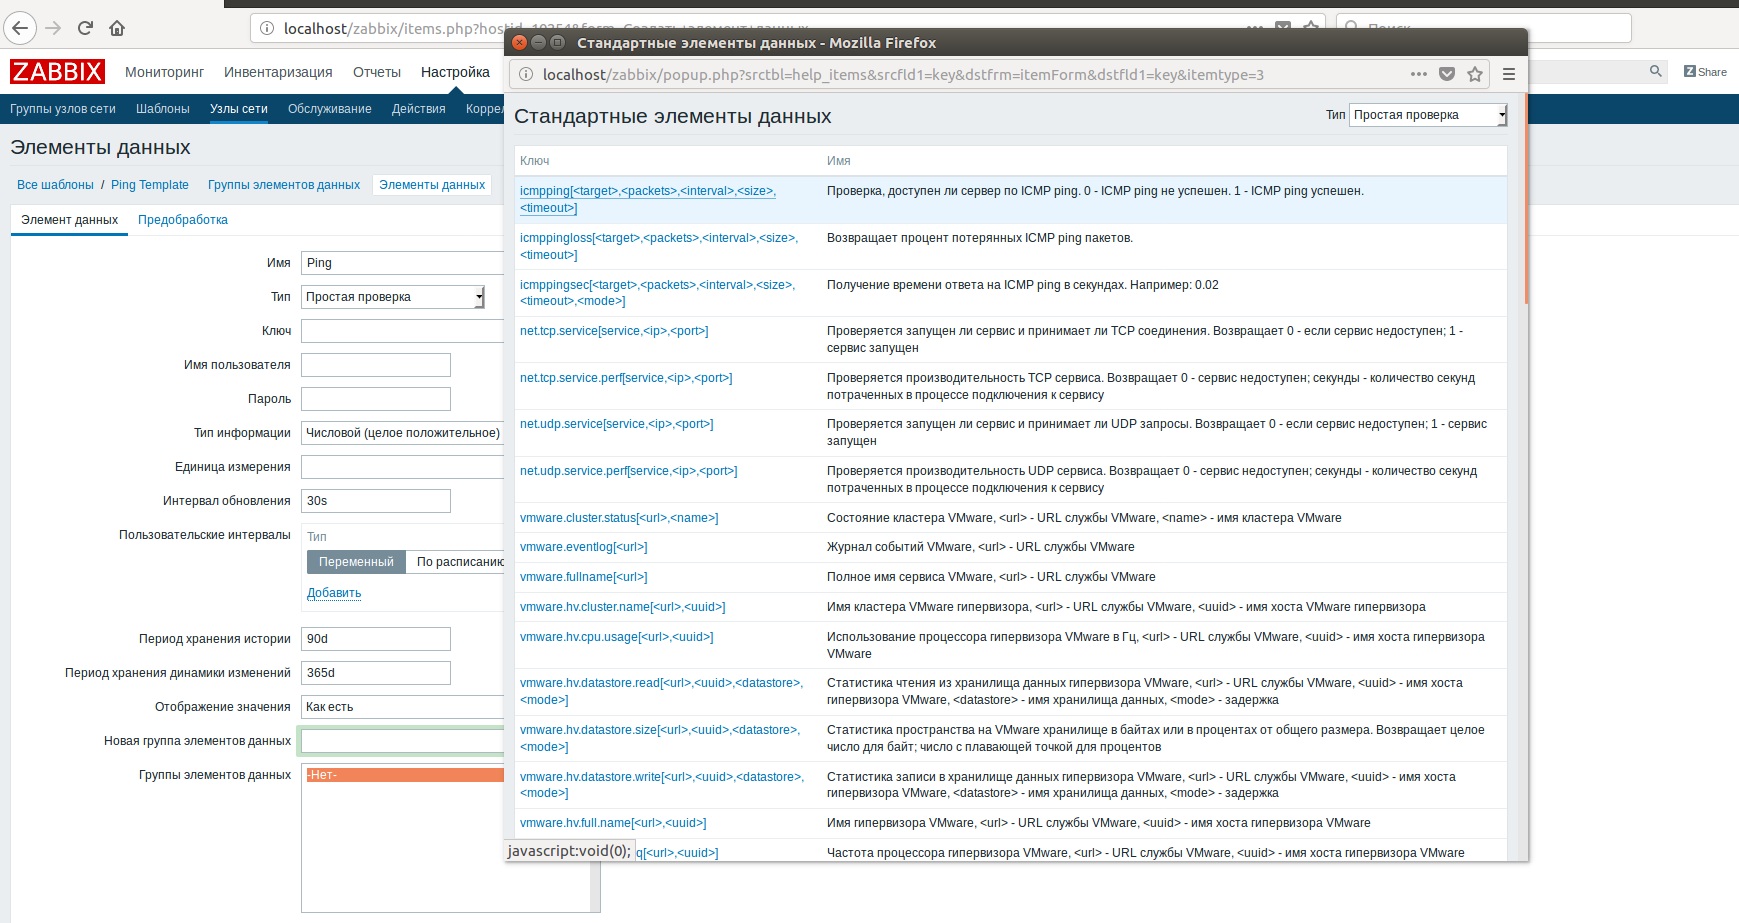
All parameters are set by default, therefore we delete everything that is in square brackets:

Click "Add".
Now we can select a group for templates to see our templates.
Add a data item to the template, to do this, click "Data items" - "Create data items".
In the field "Name" we indicate Ping.
"Key" - click "Select" and select the first key. It will return 1 if successful ping and 0 if unsuccessful, that's enough for us.
All parameters are set by default, therefore we delete everything that is in square brackets:
"Type of information" - select "Numeric (positive integer)".
The field "Unit of measurement" is left blank.
“Update interval” - here we select the ping interval, for example 60 s.
“History retention period” - in order to reduce the size of the database, put 1 d.
"The storage period of the dynamics of change" - 5 d.
Click "Add".
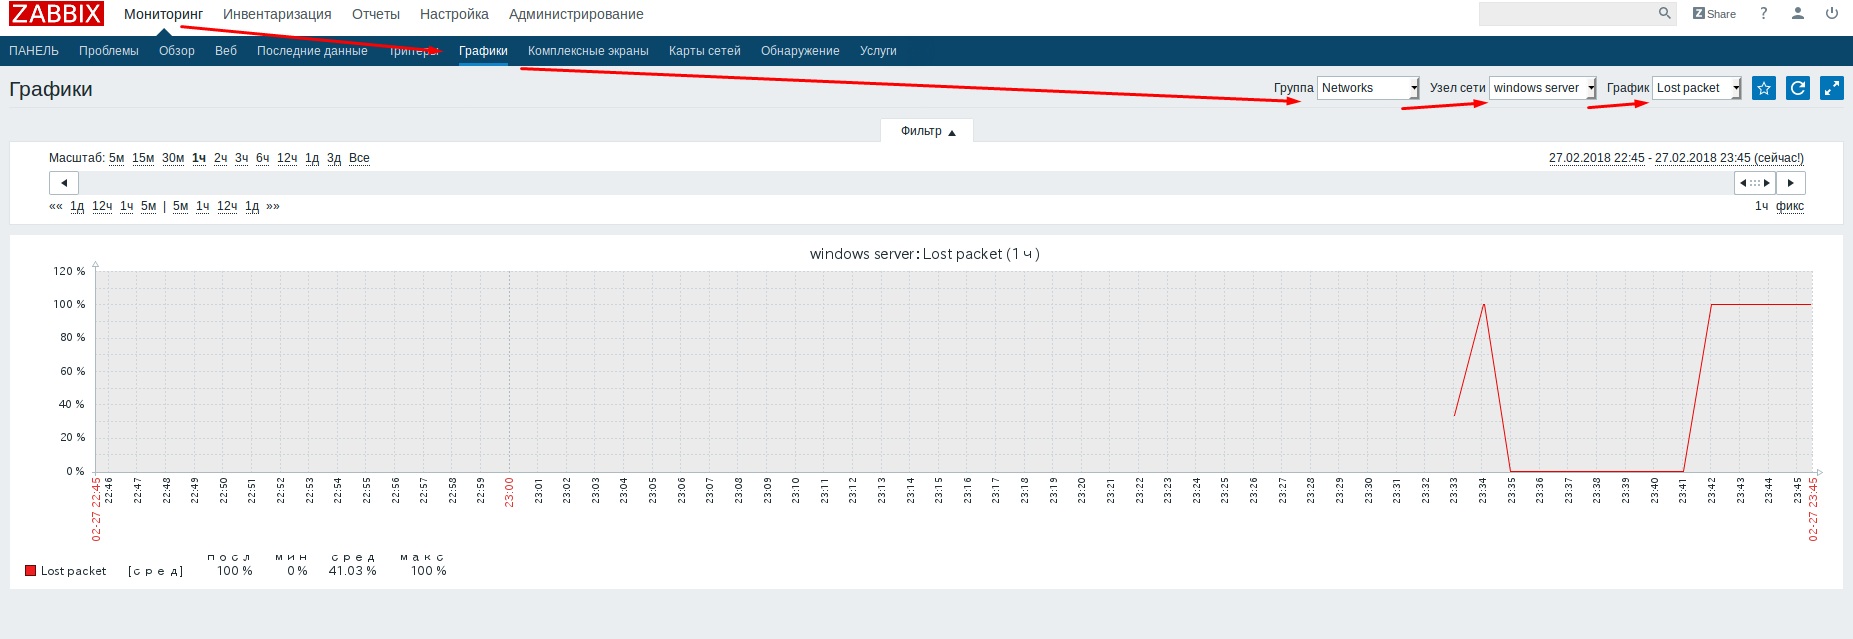
And you also need to know the percentage of lost packets.
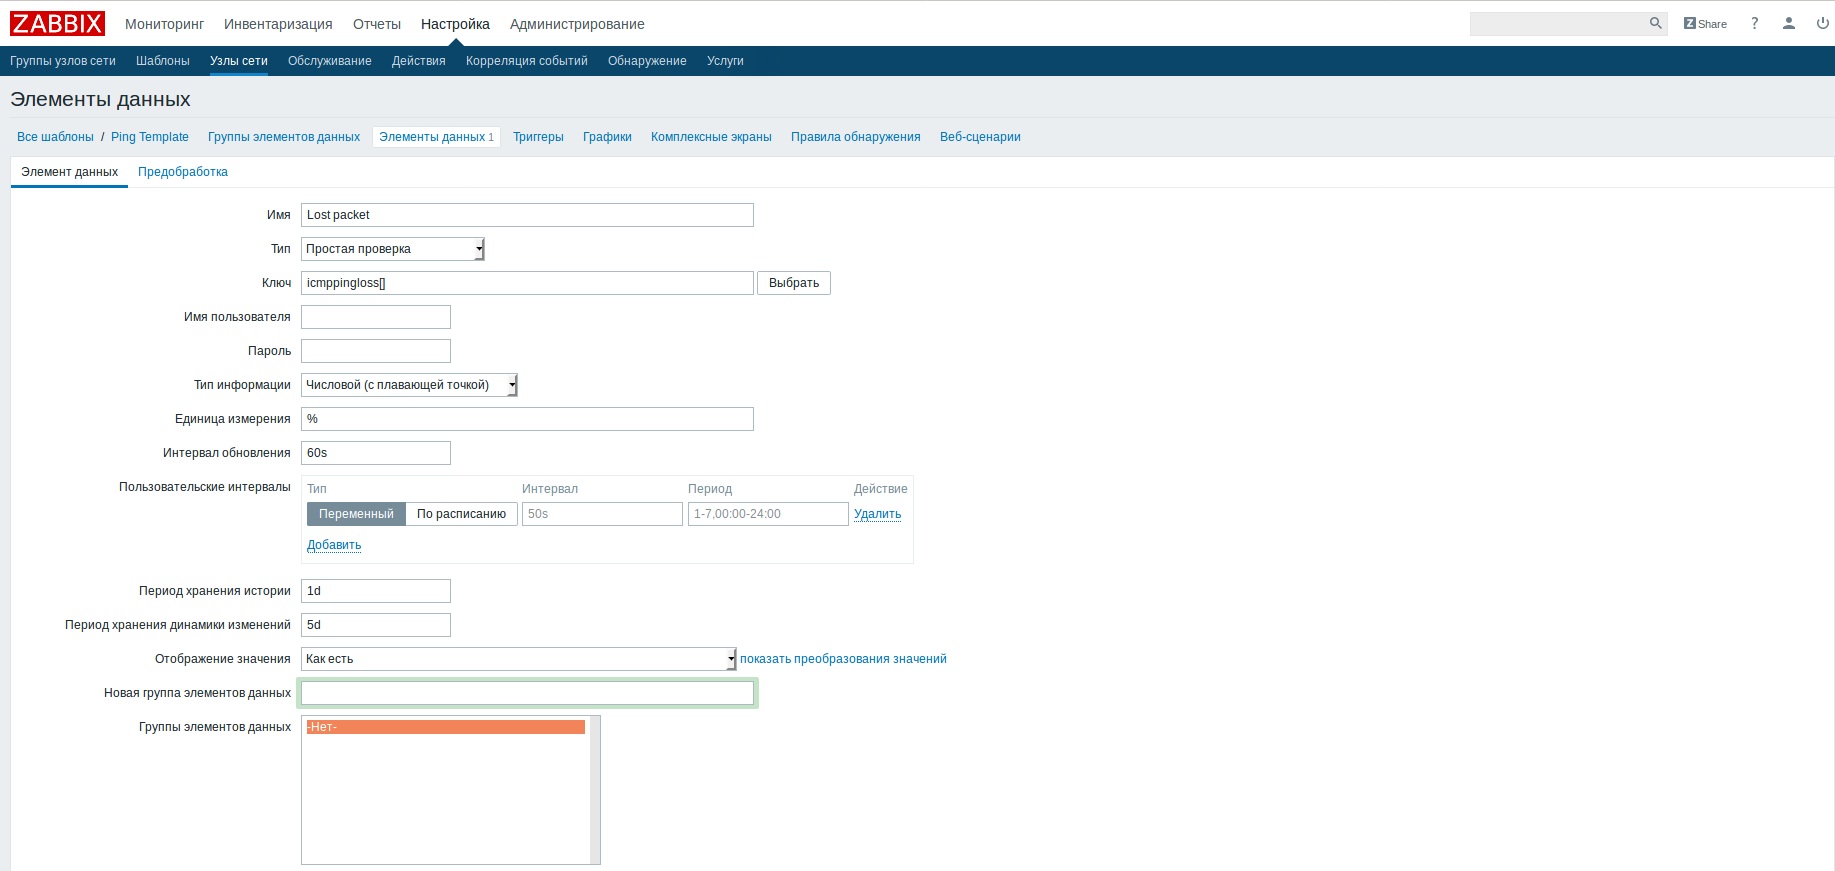
Add immediately one more element - the percentage of lost packets.
Click "Create a data item".
Click "Add".
Click "Create a data item".
In the "Name" field, specify the lost packet.
"Key" - click "Select" and select the second key.
Also delete everything that is in square brackets.
"Type of information" - "Numeric (floating point)".
"Unit of measurement" - enter "%".
"Update Interval" - 60 s.
“History retention period” - 1 d.
"The storage period of the dynamics of change" - 5 d.
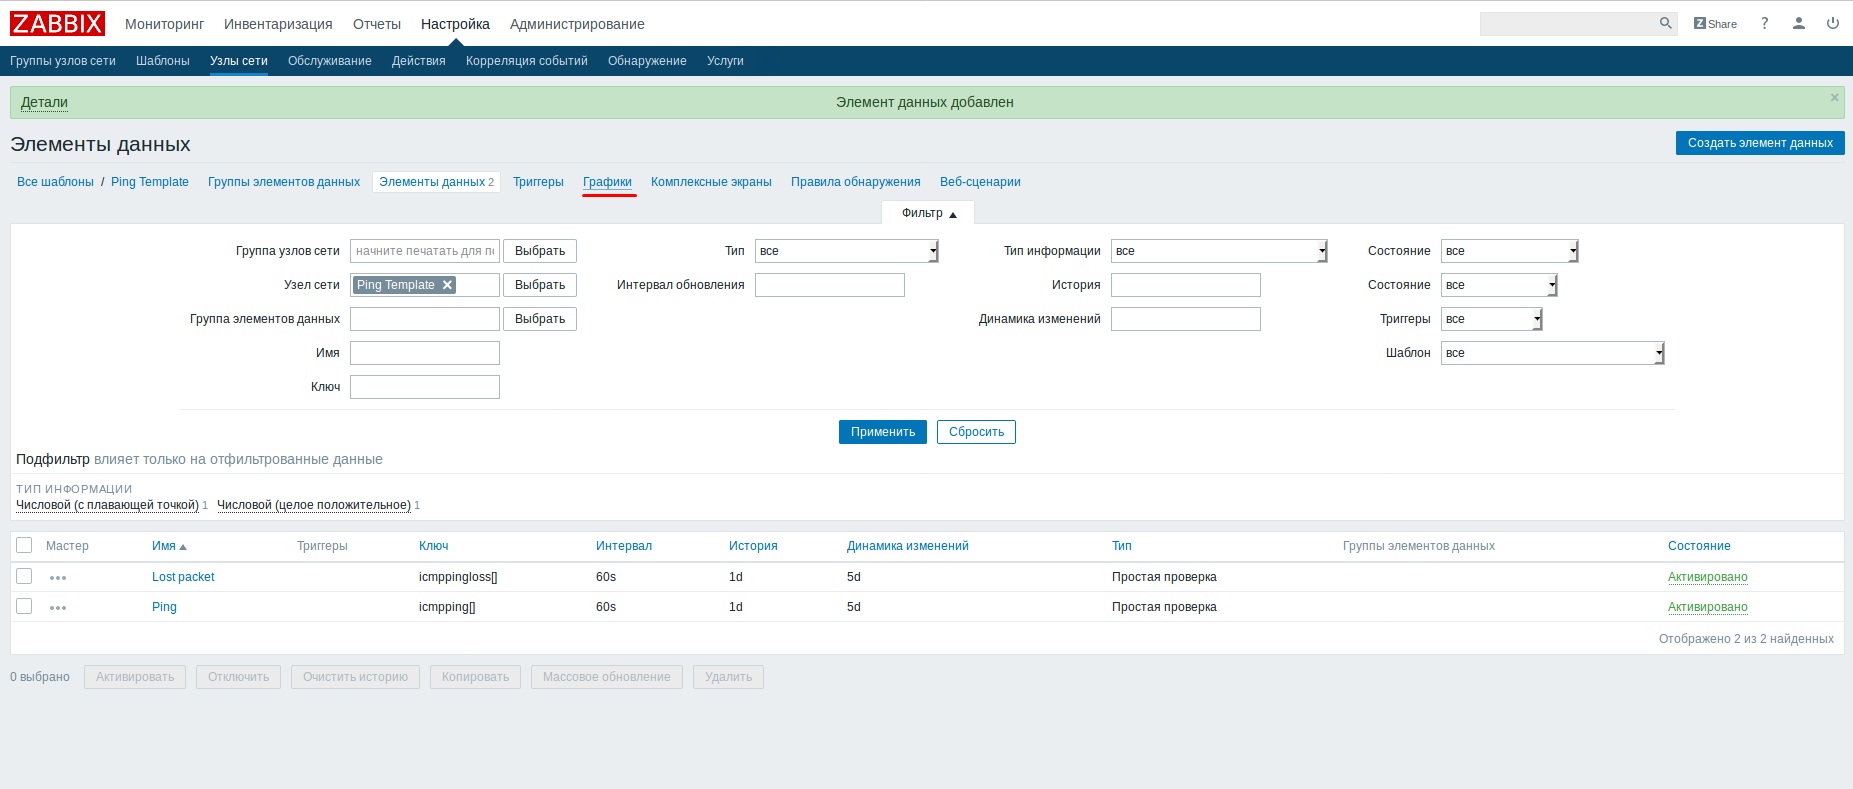
Click "Add".
Charts
To visualize the information, we need charts. Select "Charts" and click "Create a graph."
In the "Name" enter Ping.
Uncheck “Display Triggers”.
“Data elements” - “Add” - choose our Ping.
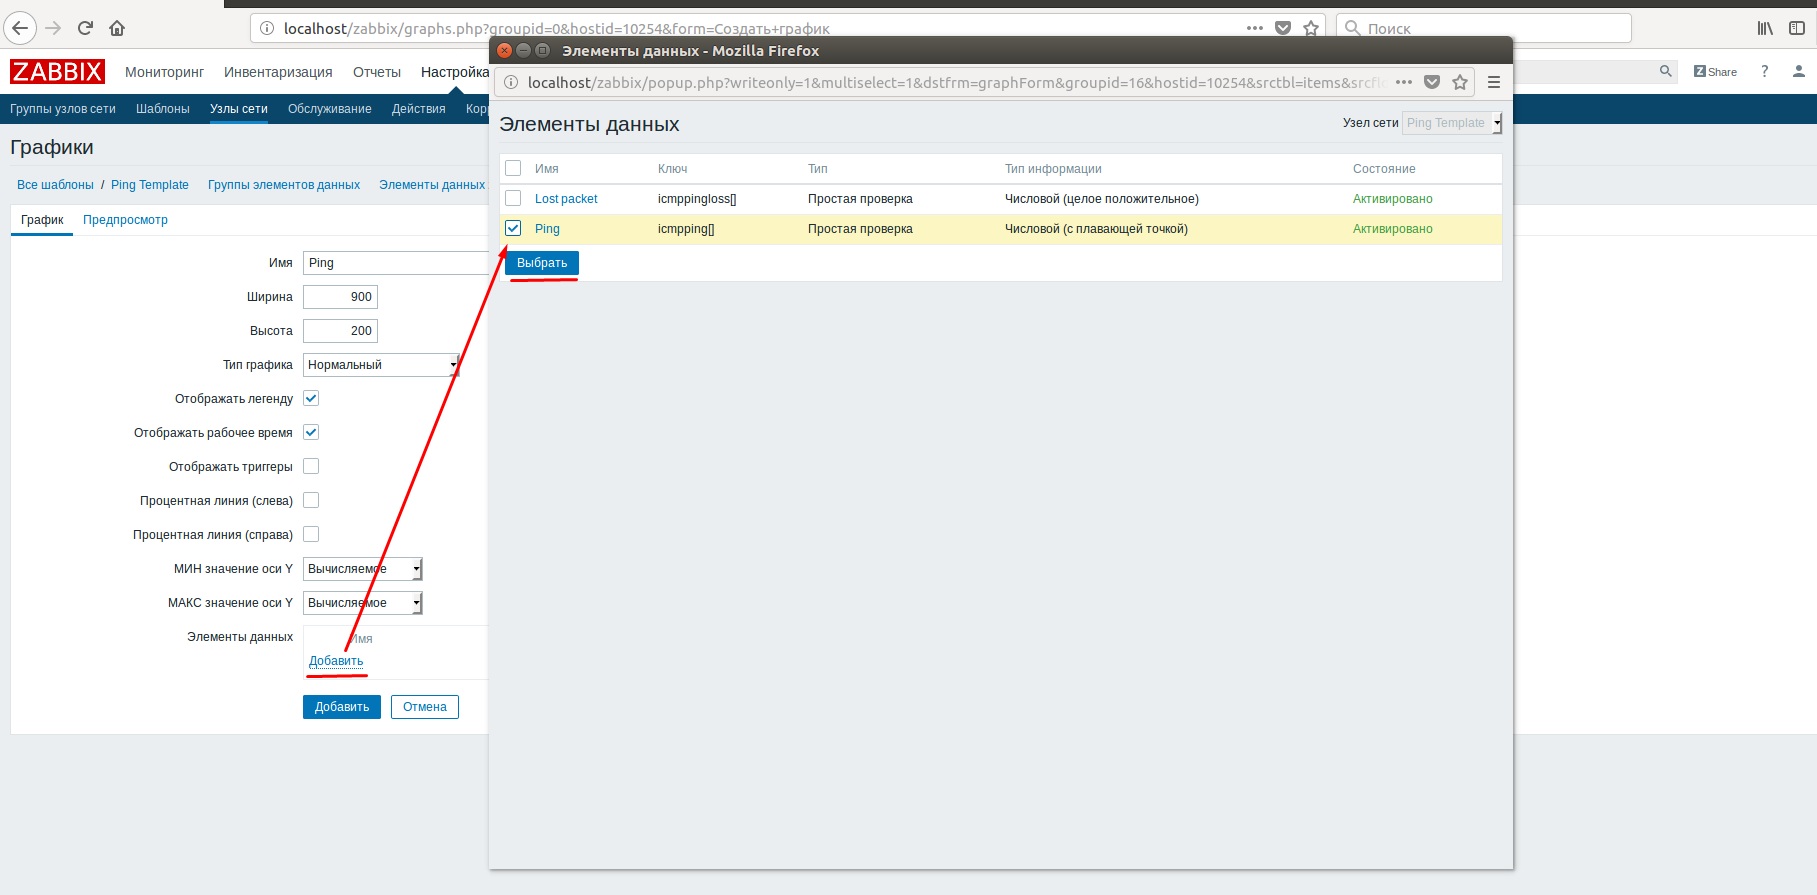
Also add the lost packet.
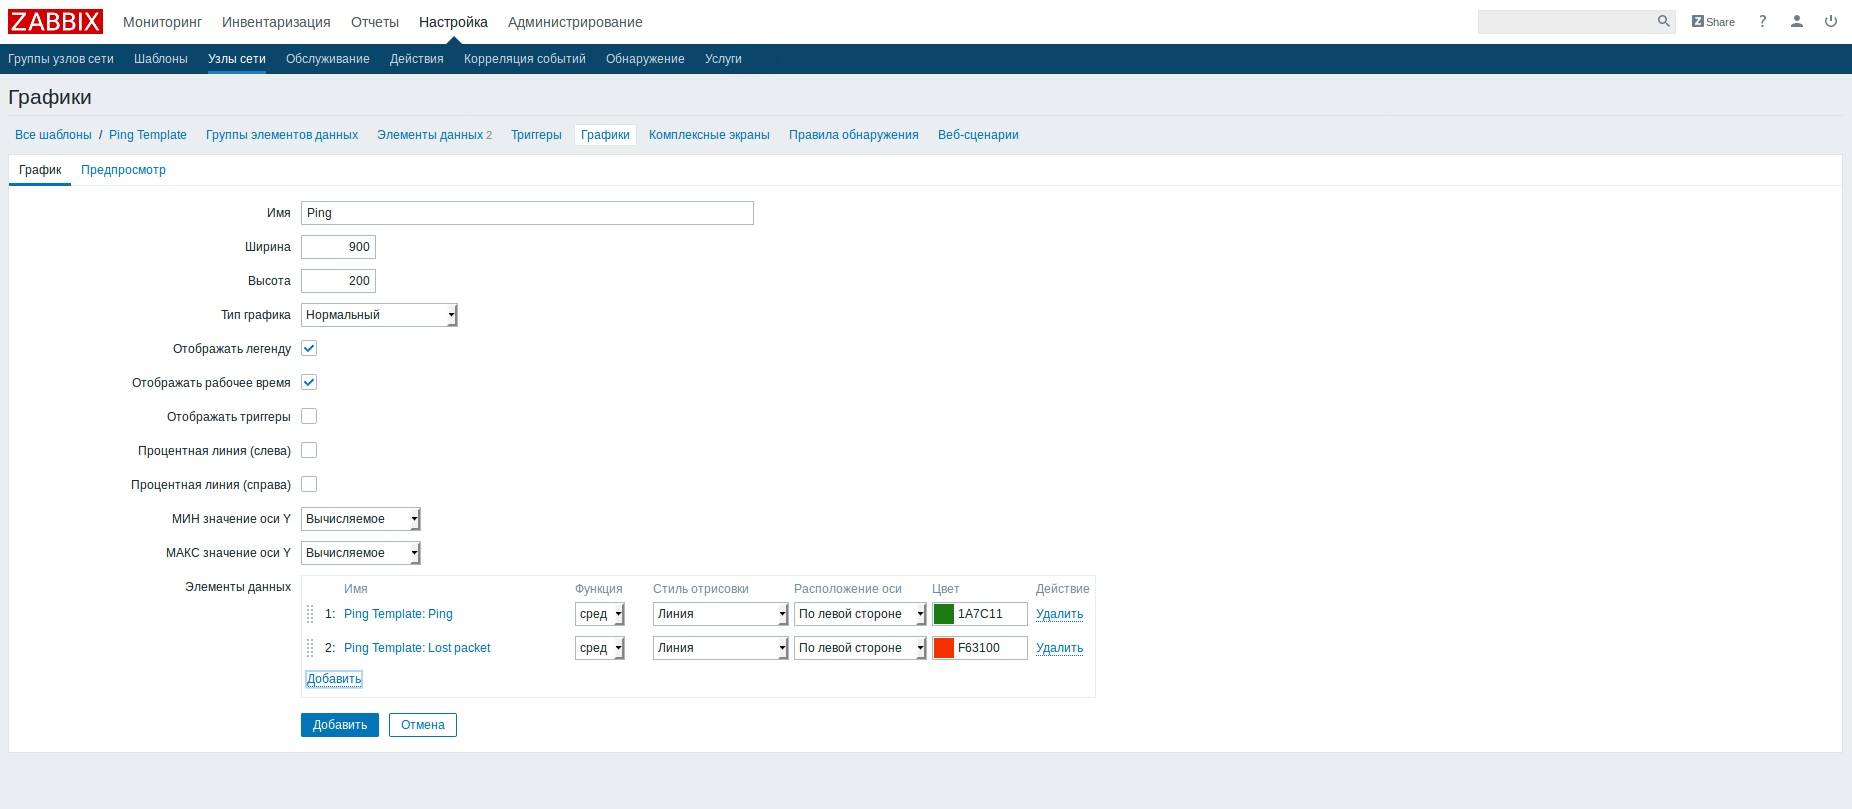
Click "Add".
Setting up remote server monitoring
Now we give an example of setting up monitoring of a remote server.
Now, for example, let's add our remote server, which has a white IP address.
Go to "Setup" - "Network nodes" - "Create a network node."

Set the name, IP-address, description (optional) and go to the addition of the template.
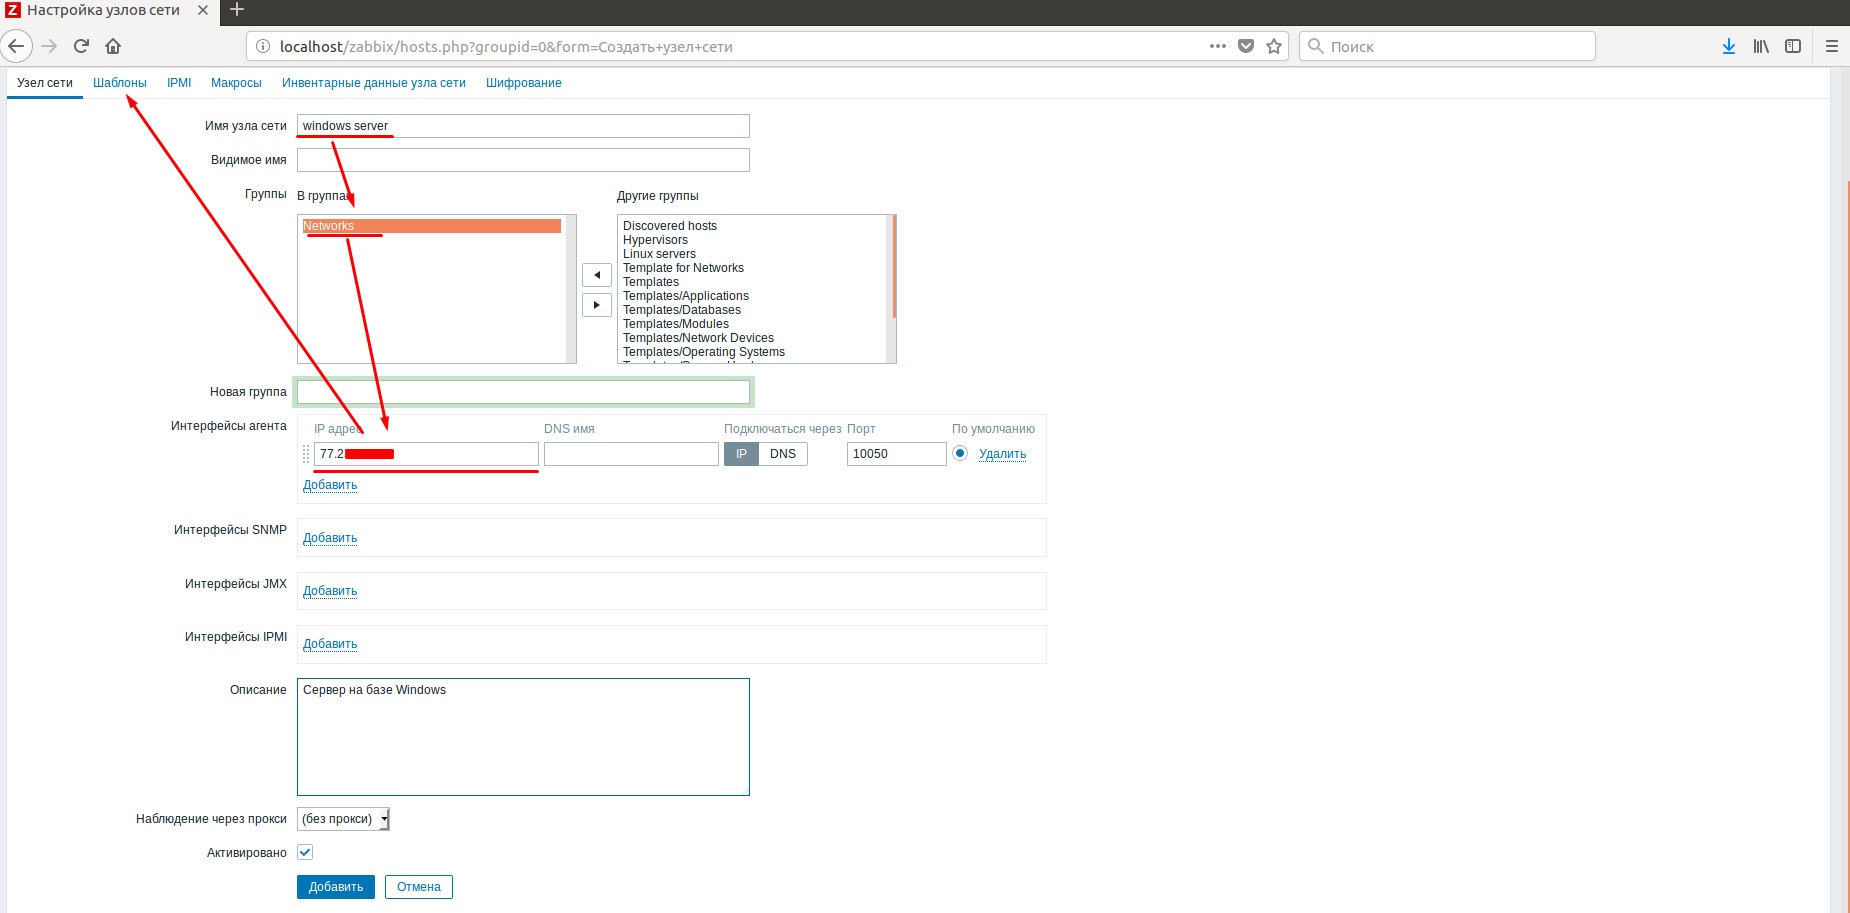
In the templates, in the "Connect with new templates" field, select our template for the network and click "Add" twice.

In the nodes of the network can be seen adding our site. It has two data elements, a graph and an active state.
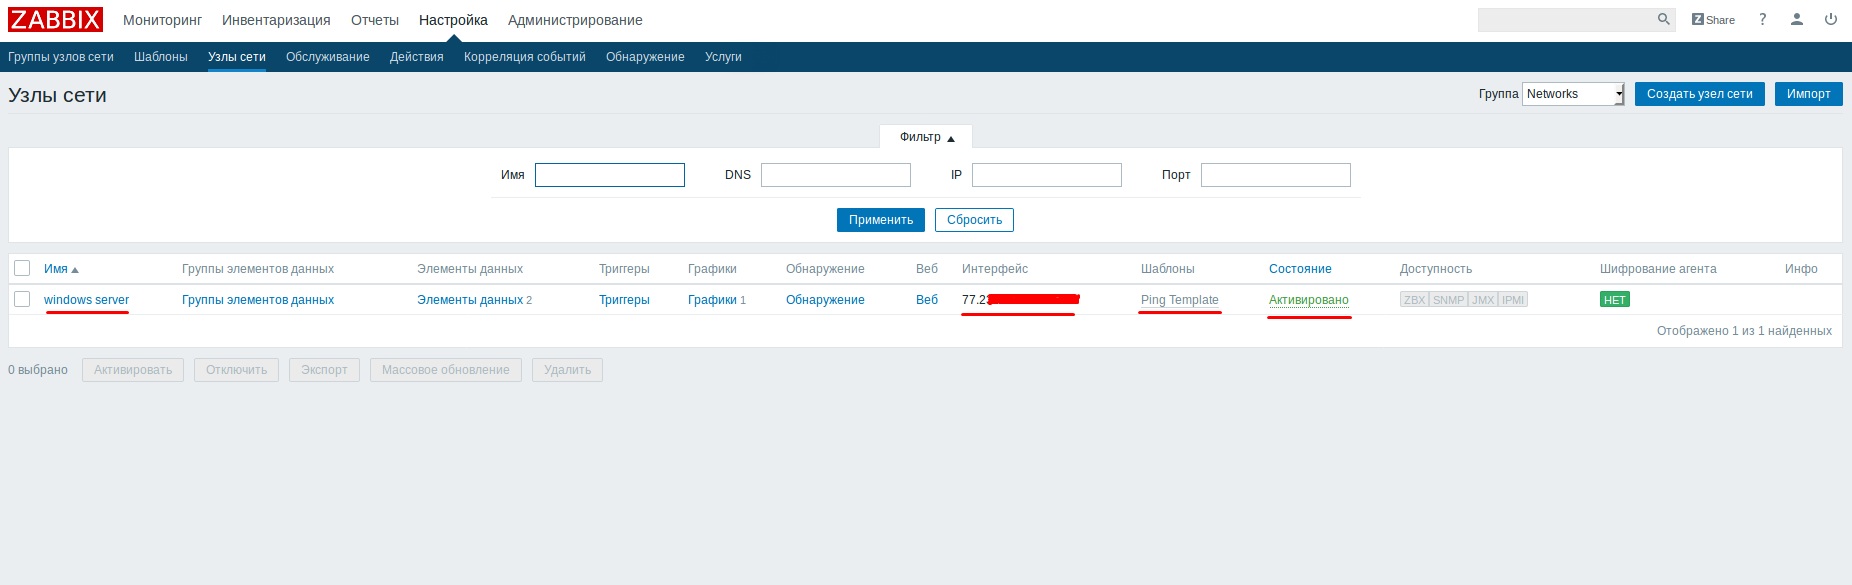
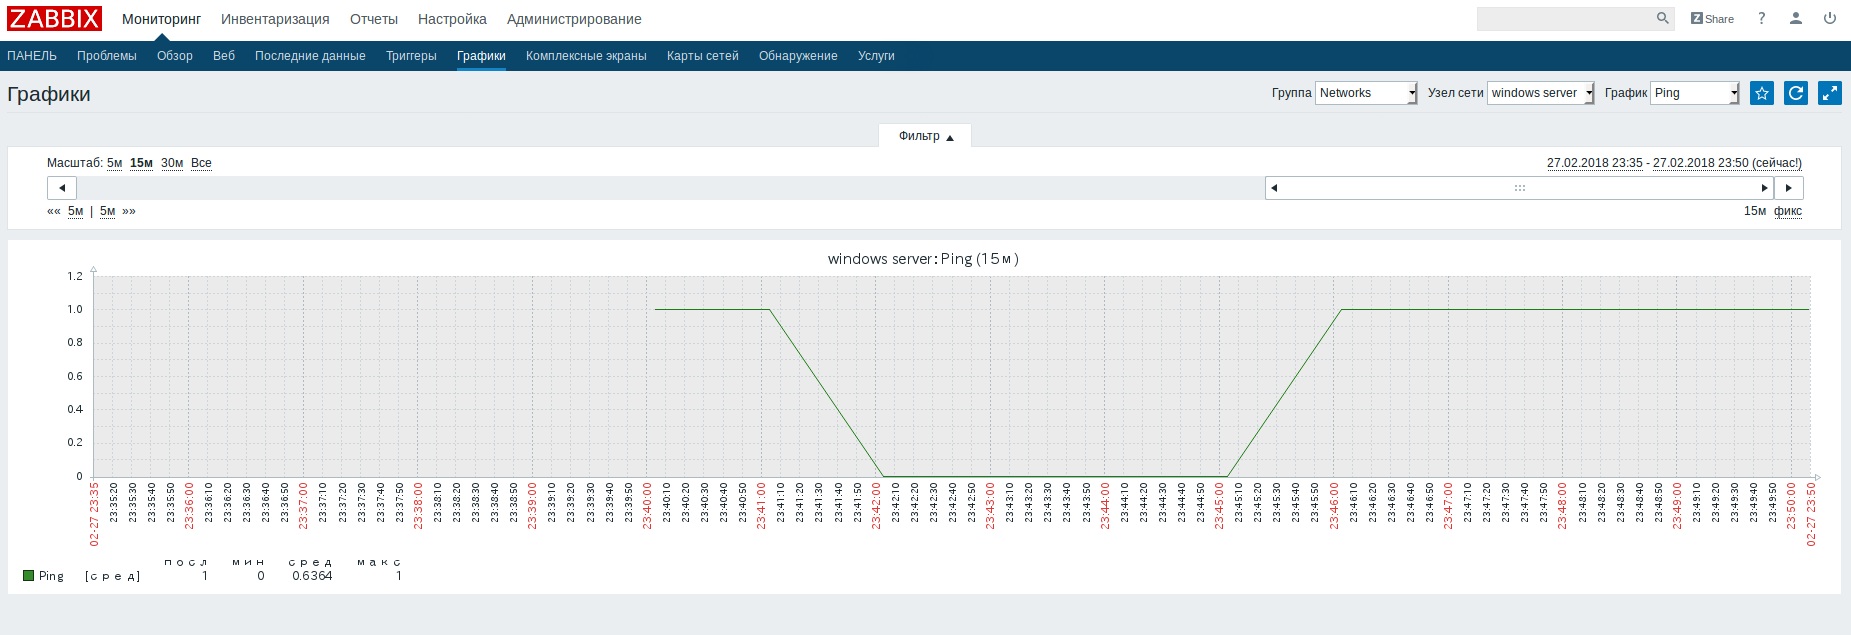
Now we specifically turn off the network for a few minutes and see the graphs.
“Monitoring” - “Charts” - choose our group, node and schedule.
Go to "Setup" - "Network nodes" - "Create a network node."
Set the name, IP-address, description (optional) and go to the addition of the template.
In the templates, in the "Connect with new templates" field, select our template for the network and click "Add" twice.
In the nodes of the network can be seen adding our site. It has two data elements, a graph and an active state.
Now we specifically turn off the network for a few minutes and see the graphs.
“Monitoring” - “Charts” - choose our group, node and schedule.
Send Setup
To receive notifications about problems in the system, set up sending notifications
Go to the "Administration" - "Ways to notify."
Select and delete standard methods.
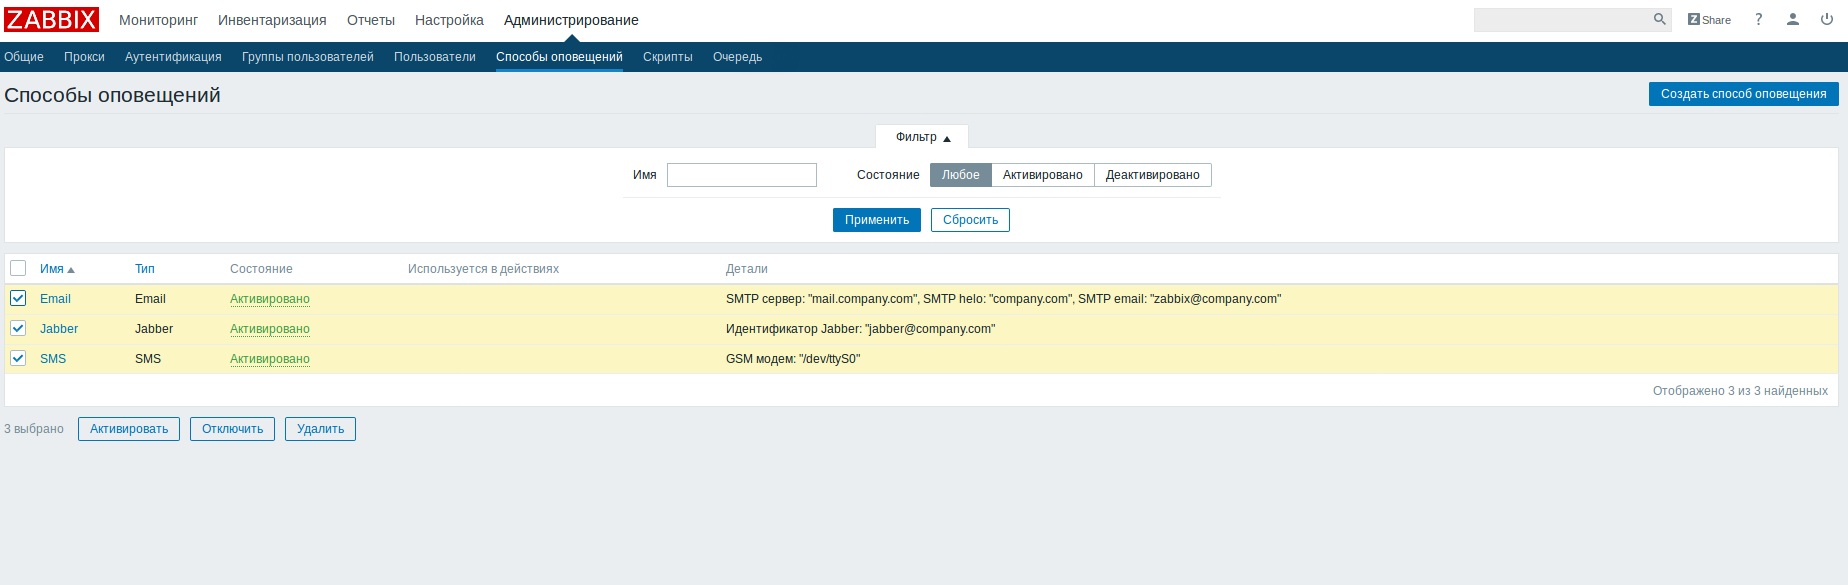
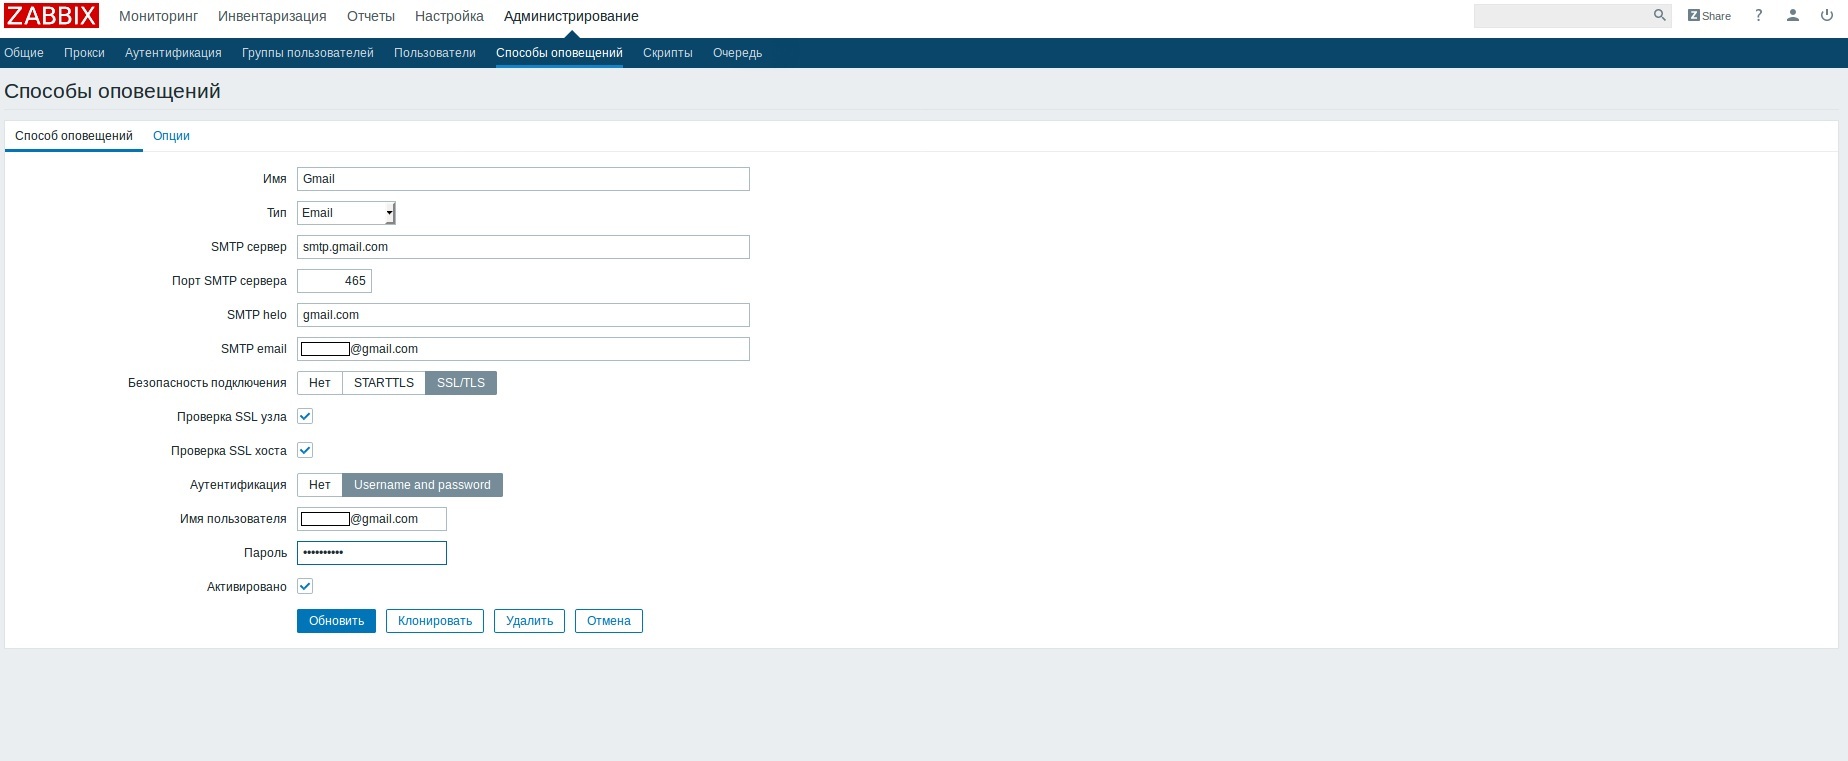
Now create a new way using the button "Create a way to alert."
Fill in the settings of our smtp-server.
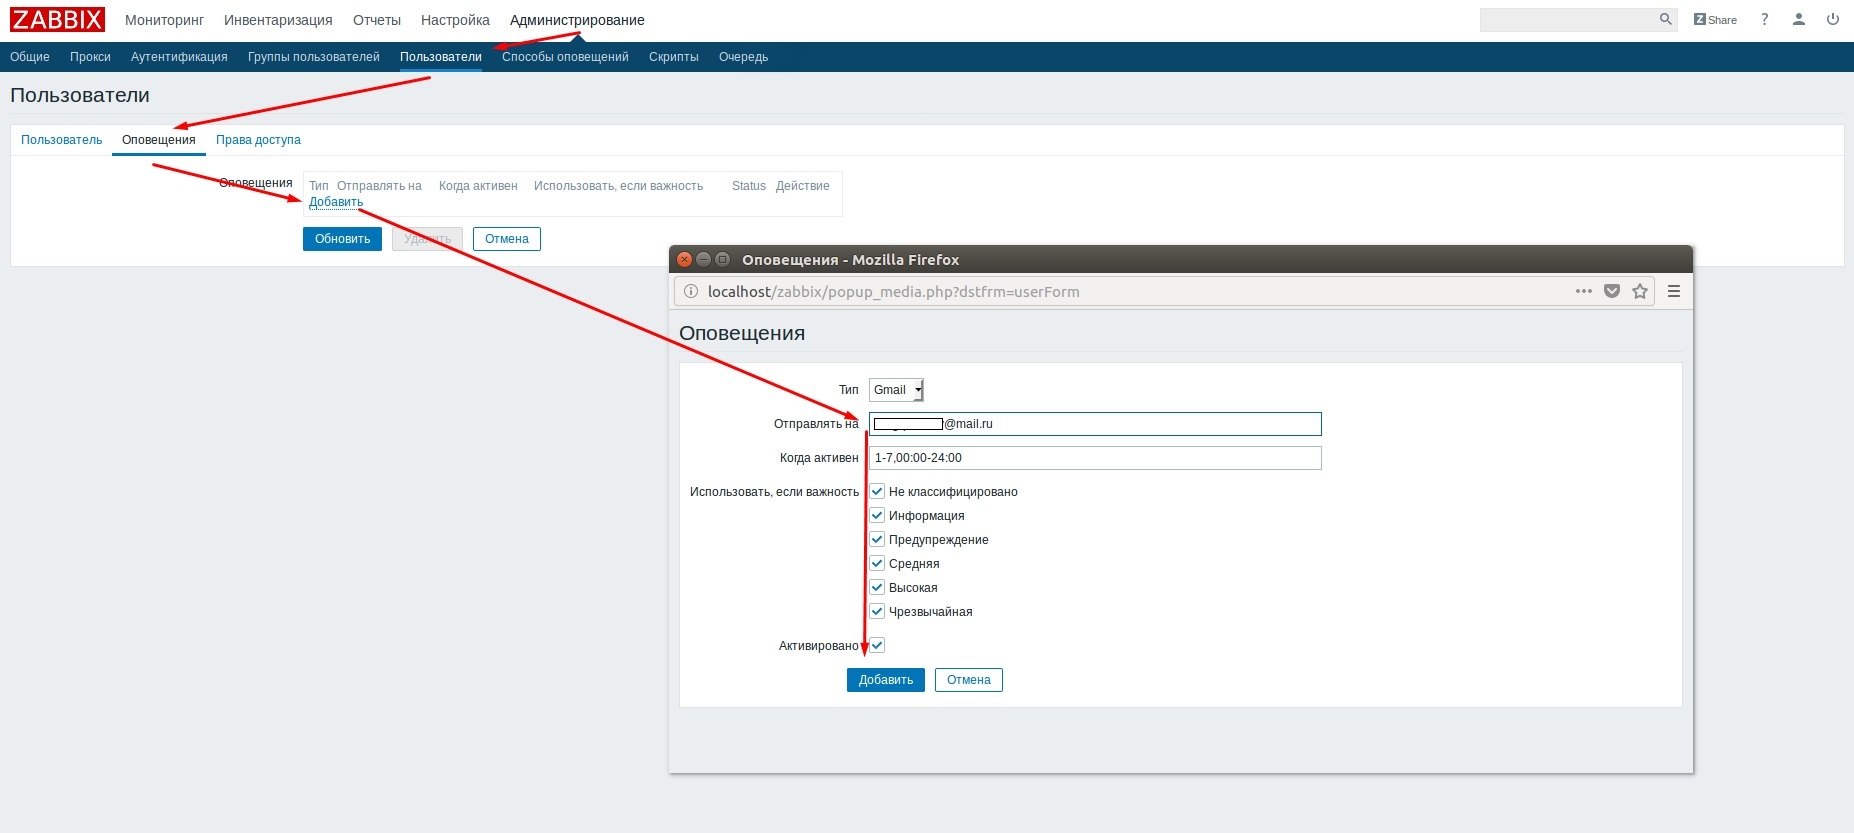
Next you need to fill in the data of users who will be sent mail.
Go to the "Administration" - "Users". We select our user: Admin - “Alerts” - “Add” - in the field “Send to” we enter our mail - “Add”.
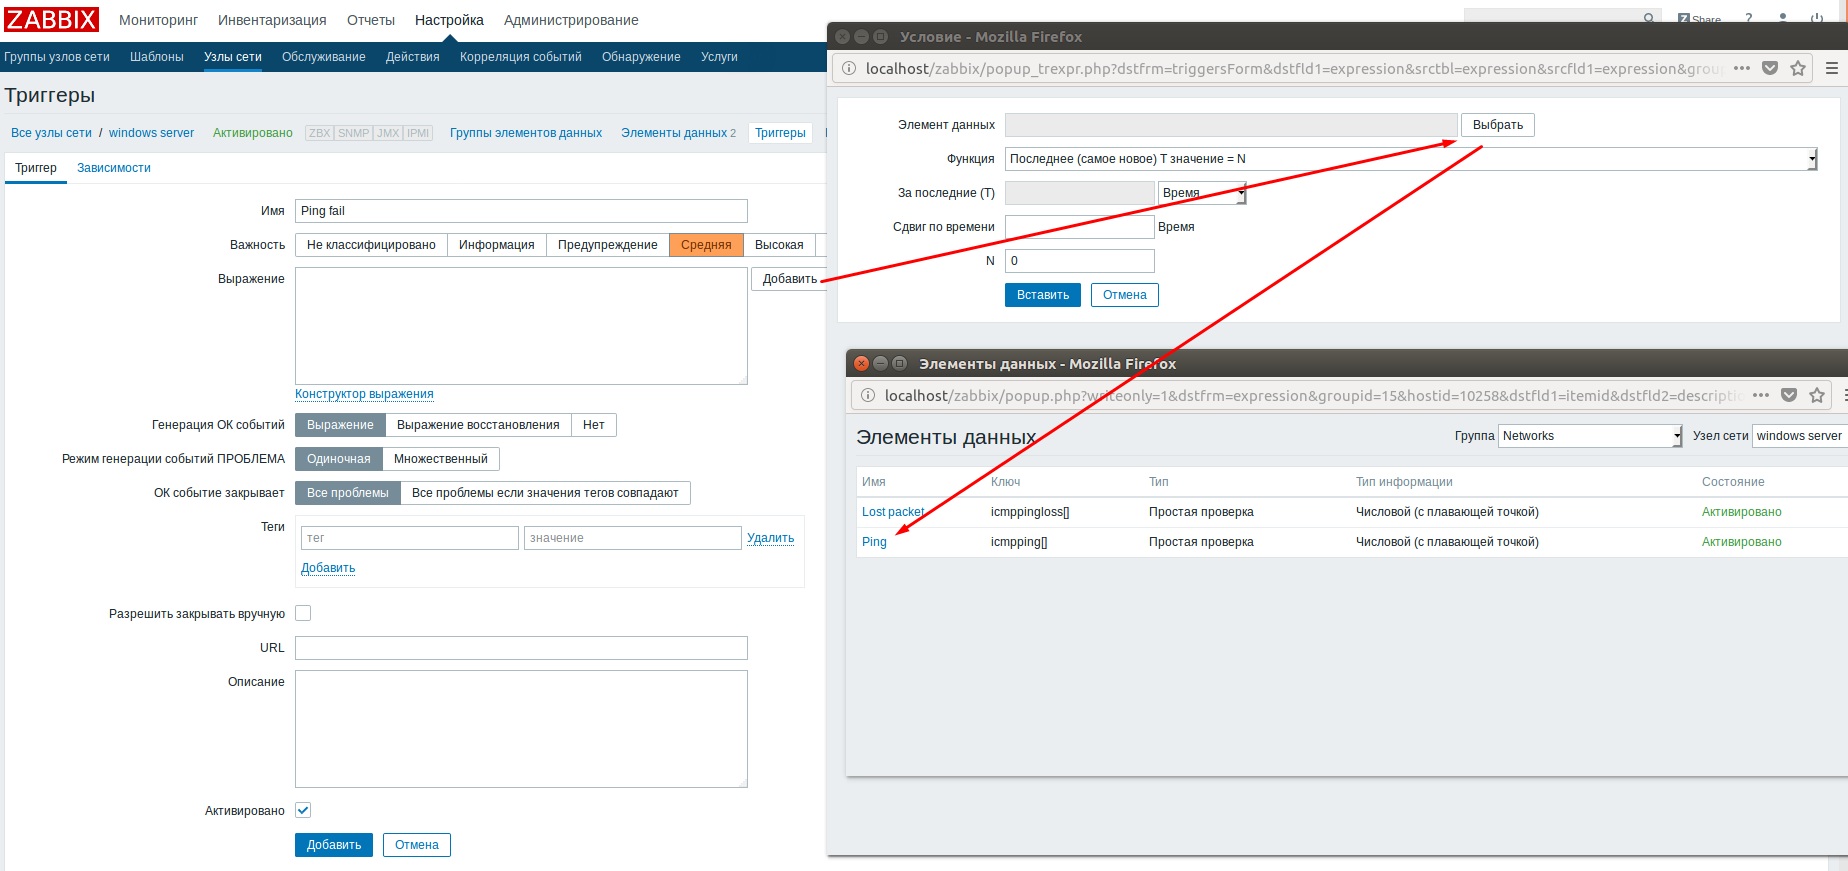
Now we will create a trigger that, when triggered, will require sending an email message.
“Settings” -> “Network nodes” -> “Triggers” -> “Create trigger”.

Add our item.
"Add".
Create an action that will send us alerts when triggers are triggered.
“Setup” - “Actions” - “Event Source” - “Triggers” - “Create Action”.

Enter the name of the action, delete the standard condition and add our own type “Trigger” - “Select”.
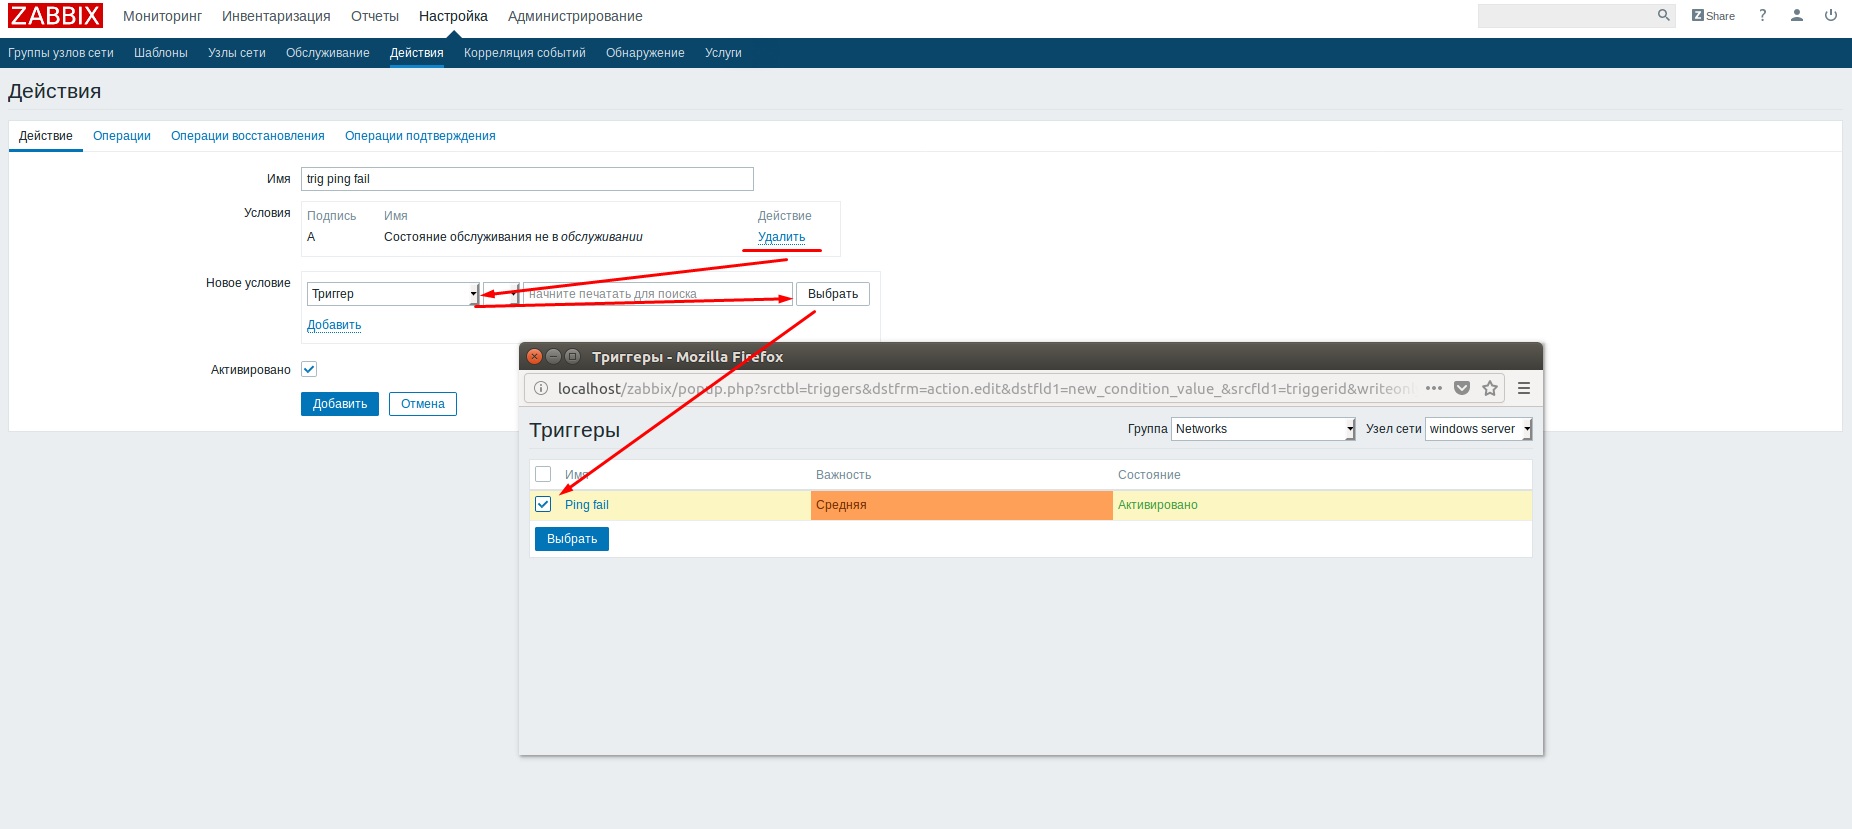
In the "New condition" field, click "Add" and go to the "Operations" tab.
Here you can choose the duration, subject and text of the message. Leave them by default.

Turn off the network for verification.

We go to the "Monitoring" - "Problems" and see our mistake.

We check mail and see a letter about the problem.

After receiving the letter and fixing the problem, you can click on “No” in the “Confirmed” column in the “Problem Monitoring” and confirm the event by setting yourself a note.
Select and delete standard methods.
Now create a new way using the button "Create a way to alert."
Fill in the settings of our smtp-server.
Next you need to fill in the data of users who will be sent mail.
Go to the "Administration" - "Users". We select our user: Admin - “Alerts” - “Add” - in the field “Send to” we enter our mail - “Add”.
Now we will create a trigger that, when triggered, will require sending an email message.
“Settings” -> “Network nodes” -> “Triggers” -> “Create trigger”.
Add our item.
“Name” - enter Ping fail.
“Importance” is set independently, here “Average”.
"Add".
Create an action that will send us alerts when triggers are triggered.
“Setup” - “Actions” - “Event Source” - “Triggers” - “Create Action”.
Enter the name of the action, delete the standard condition and add our own type “Trigger” - “Select”.
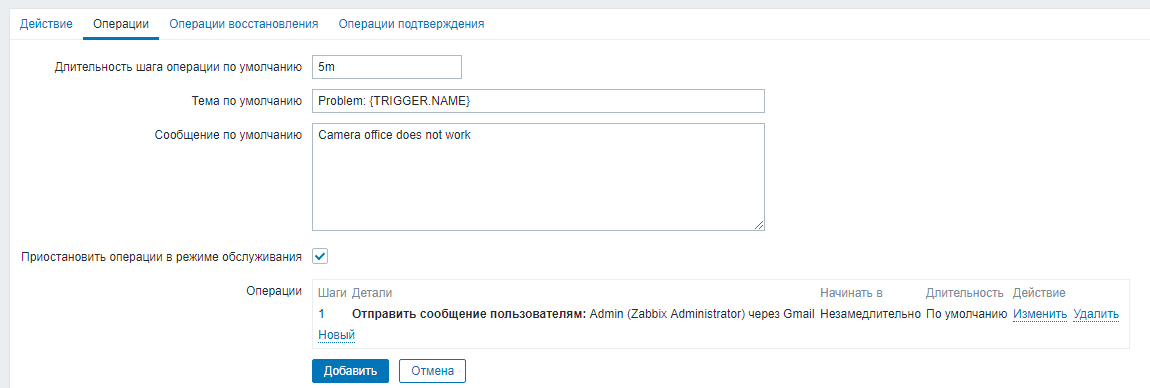
In the "New condition" field, click "Add" and go to the "Operations" tab.
Here you can choose the duration, subject and text of the message. Leave them by default.
"The default operation step duration" - set 10 m.Add our action.
“Send to users” - choose our user.
"Send only through" - email.
Turn off the network for verification.
We go to the "Monitoring" - "Problems" and see our mistake.
We check mail and see a letter about the problem.
After receiving the letter and fixing the problem, you can click on “No” in the “Confirmed” column in the “Problem Monitoring” and confirm the event by setting yourself a note.
Zabbix client
Above shows a small part of the work with zabbix, now we proceed to the most interesting. Our goal is to put the server under control, namely the load on the central processor.
So, let's start, with this will help us zabbix-agent.
Windows agent
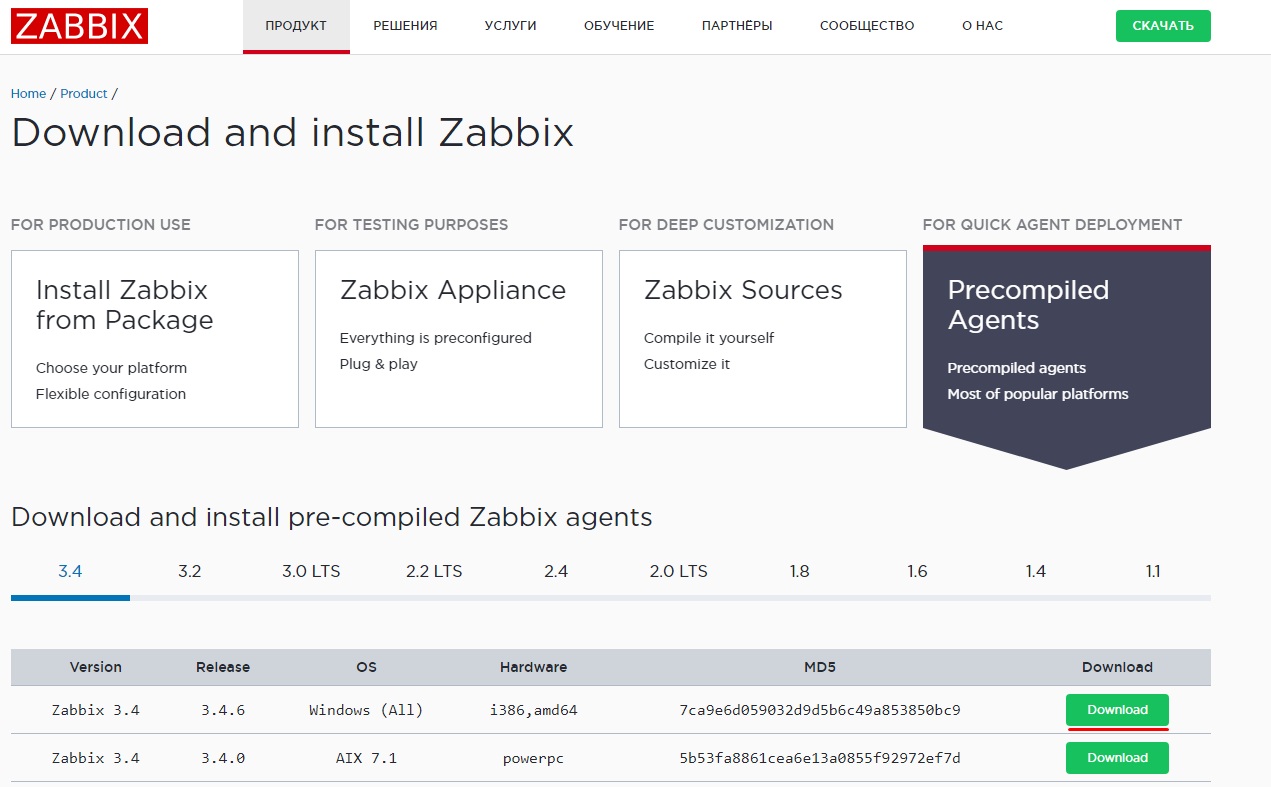
Let's start with the Windows agent.
It can be downloaded from the official Zabbix website by selecting the zabbix-agent for windows.
After you need to create a folder in which our agent will lie, for example: C: / Program Files / zabbix.
In the downloaded file, go to the bin folder and, depending on the bitness of your operating system, go to the win32 or win64 folder. The following describes the actions for a 64-bit OS:
/zabbix_agents_3.4.6.win.zip/bin/win64 and from this folder we copy 3 files zabbix_agentd, zabbix_get and zabbix_sender into the folder C: / Program Files / zabbix; Next, copy the /zabbix_agents_3.4.6.win.zip/conf folder to the C: / Program Files / zabbix folder.
It should turn out like this:

Now you need to configure the configuration file in C: / Program Files / zabbix / conf /. Open zabbix_agentd.win.conf and change the following lines:
We save.
Next we need to open a command prompt in admin mode.
Install the service:
We start the service:
Now you need to create a rule for the firewall.
Go to the "Control Panel" - "System and Security" - "Windows Defender Firewall" - "Advanced Settings" - "Inbound Rules" - "Create a Rule". Select "For the program" - "Next" - "Path of the program." Specify the path to zabbix_agentd - “Next” - “Allow connection” - “Next”. We tick off all profiles - “Next” - “Name” - zabbix-agent - “Next”.
Is done.
It can be downloaded from the official Zabbix website by selecting the zabbix-agent for windows.
After you need to create a folder in which our agent will lie, for example: C: / Program Files / zabbix.
In the downloaded file, go to the bin folder and, depending on the bitness of your operating system, go to the win32 or win64 folder. The following describes the actions for a 64-bit OS:
/zabbix_agents_3.4.6.win.zip/bin/win64 and from this folder we copy 3 files zabbix_agentd, zabbix_get and zabbix_sender into the folder C: / Program Files / zabbix; Next, copy the /zabbix_agents_3.4.6.win.zip/conf folder to the C: / Program Files / zabbix folder.
It should turn out like this:
Now you need to configure the configuration file in C: / Program Files / zabbix / conf /. Open zabbix_agentd.win.conf and change the following lines:
LogFile = c: /zabbix_agentd.log
change to
LogFile = C: / Program Files / zabbix / zabbix_agentd.log;
# LogFileSize = 1
change to
LogFileSize = 100;
# EnableRemoteCommands = 0
change to
EnableRemoteCommands = 1;
Server = 127.0.0.1
we specify the IP address of our server on which there is a zabbix-server
Server = 192.168.1.105;
# ListenPort = 10050
change to
ListenPort = 10050;
ServerActive = 127.0.0.1
we specify the IP address of our server on which there is a zabbix-server
ServerActive = 192.168.1.105.
We save.
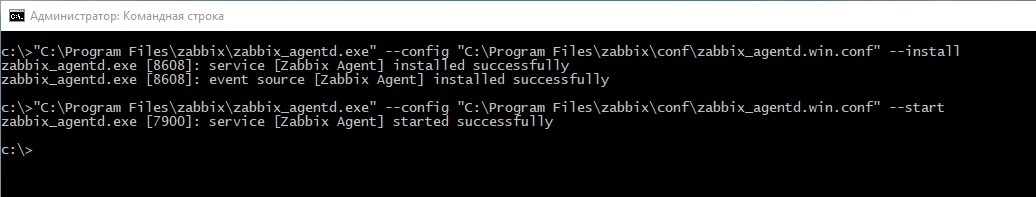
Next we need to open a command prompt in admin mode.
Install the service:
"C:/Program files/zabbix/zabbix_agentd.exe" --config "C:/Program files/zabbix/conf/zabbix_agentd.conf" –install. We start the service:
"C:/Program files/zabbix/zabbix_agentd.exe" --config "C:/Program files/zabbix/conf/zabbix_agentd.conf" –start. Now you need to create a rule for the firewall.
Go to the "Control Panel" - "System and Security" - "Windows Defender Firewall" - "Advanced Settings" - "Inbound Rules" - "Create a Rule". Select "For the program" - "Next" - "Path of the program." Specify the path to zabbix_agentd - “Next” - “Allow connection” - “Next”. We tick off all profiles - “Next” - “Name” - zabbix-agent - “Next”.
Is done.
Linux agent
For Linux, installing a zabbix agent is much easier. Moreover, some of the work has already been completed during the installation of the zabbix server.
On the video surveillance server, you need to download and install the zabbix repository:
Then install the client
Configuring the configuration file is the same as for the windows version, with the exception of the LogFile parameter, which does not need to be touched:
Restart zabbix-agent:
Is done.
On the video surveillance server, you need to download and install the zabbix repository:
wget http://repo.zabbix.com/zabbix/3.4/ubuntu/pool/main/z/zabbix-release/zabbix-release_3.4-1+xenial_all.deb sudo dpkg -i zabbix-release_3.4-1+xenial_all.deb sudo apt update Then install the client
sudo apt install zabbix-agent Configuring the configuration file is the same as for the windows version, with the exception of the LogFile parameter, which does not need to be touched:
sudo mcedit /etc/zabbix/zabbix_agentd.conf Restart zabbix-agent:
sudo /etc/init.d/zabbix-agent restart Is done.
Getting information from the agent
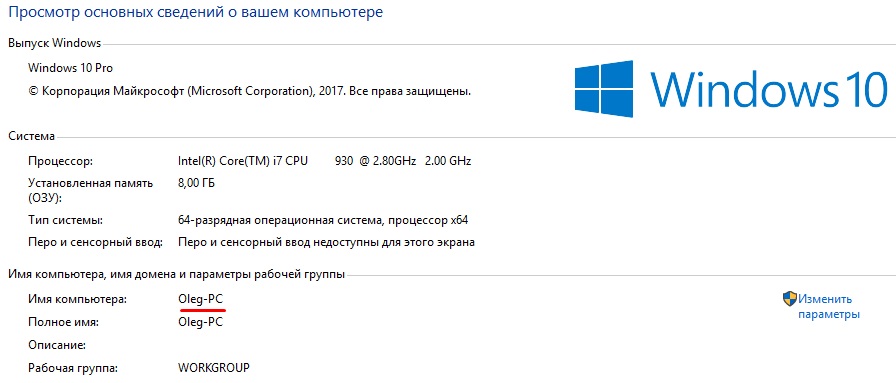
Find out the name of the node on which there is a zabbix-agent. For Windows, this can be viewed in the system properties.
For Linux, you can use the traceroute IP address command.

Now go to the web interface of the zabbix server. Go to "Settings" - "Network nodes" - "Create a network node."
Go to the tab "Templates" and in the "Connect with new templates" click "Select".
We use the standard template.
Select the Templates / Operating Systems group and select the Template OS Windows template. Double click "Add".

Similarly, the setting of information receipt from a server based on Linux is configured.
So we get the mapping of two servers.
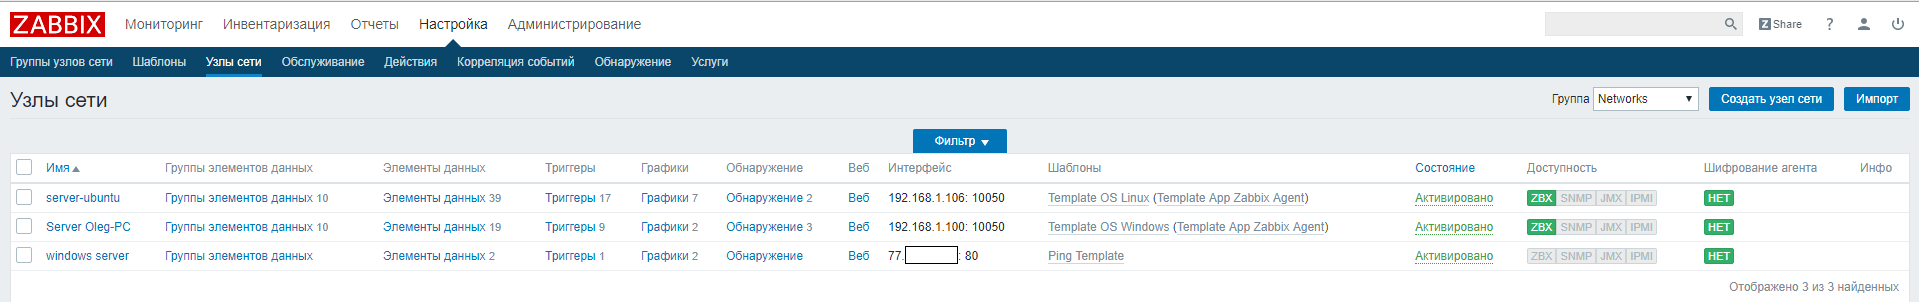
We go to the "Monitoring" - "Charts", choose our group Networks - the server-ubuntu network node and see what graphs are available to us.

On the Windows server, we look the same.

We have standard triggers that you can customize actions for. For example:
let's go to “Settings” - “Actions” - “Event Source” - “Triggers” - “Create Action”.
Remove the standard condition and add a new one.

In the "Operations", as well as before, we set up receiving email messages.
Thus, we will receive notifications when CPU is high on this node.
Full instructions on the agent can be obtained here.
For Linux, you can use the traceroute IP address command.
Now go to the web interface of the zabbix server. Go to "Settings" - "Network nodes" - "Create a network node."
“Host name” - we indicate the name of our host, for example, Oleg-PC.
“Visible name” - we specify a name that is understandable to us, for example Server Oleg-PC.
"Agent Interfaces" - enter the IP address of our agent 192.168.1.100.
Go to the tab "Templates" and in the "Connect with new templates" click "Select".
We use the standard template.
Select the Templates / Operating Systems group and select the Template OS Windows template. Double click "Add".
Similarly, the setting of information receipt from a server based on Linux is configured.
So we get the mapping of two servers.
We go to the "Monitoring" - "Charts", choose our group Networks - the server-ubuntu network node and see what graphs are available to us.
On the Windows server, we look the same.
We have standard triggers that you can customize actions for. For example:
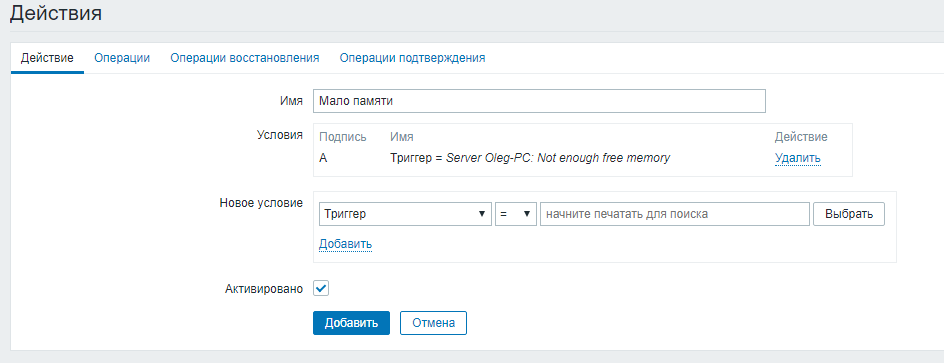
let's go to “Settings” - “Actions” - “Event Source” - “Triggers” - “Create Action”.
"Name" - High load CPU.
Remove the standard condition and add a new one.
In the "Operations", as well as before, we set up receiving email messages.
Thus, we will receive notifications when CPU is high on this node.
Full instructions on the agent can be obtained here.
Templates for server monitoring
Standard templates can greatly help save time. But it is better to use your own templates.
For example, create a template to monitor the amount of free memory.
Add another group called My test server and a template called Test agent.
Place our group in a template and create a new data item in it.

Click "Add", add a trigger.
Thus, when the amount of free memory is less than 1 GB, our trigger will work.
After adding a data item, click "Add".
We attach this template to our network node, as we did before.
For clarity, we create a graph, the name for which can be set in Russian, for example, “Free memory”.

Create an action with sending a notification to the mail.
Place our group in a template and create a new data item in it.
"Name" - change for example to My Free memory.“Key” - choose vm.memory.size [<mode>], instead of <mode> set available.
View the full list of modes can be in the official documentation.
“Type of information” - “Numeric” (positive integer).
"Unit of measurement" - "B" (bytes).
"Update Interval" - 10 m.
“History retention period” - set the number of days that we want to store the history, for example, 3 d.
“The storage period of the dynamics of change” - change to 10 d.
Click "Add", add a trigger.
"Name" - Not enough free memory.
“Importance” is high.
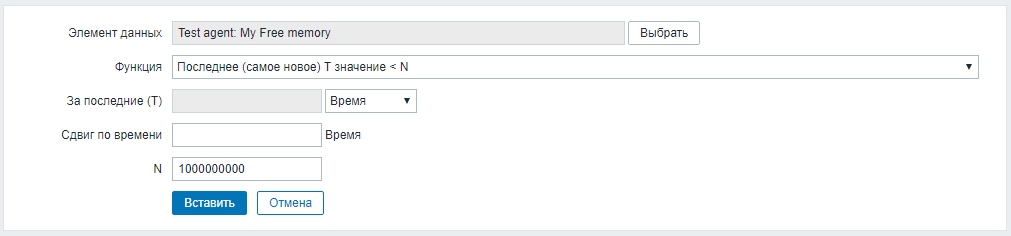
In the field "Expression" we add our data element, then we select the function "Last (most recent) T value <N" (set N value to "1,000,000,000").
Thus, when the amount of free memory is less than 1 GB, our trigger will work.
After adding a data item, click "Add".
We attach this template to our network node, as we did before.
For clarity, we create a graph, the name for which can be set in Russian, for example, “Free memory”.
Create an action with sending a notification to the mail.
Camera access monitoring
In the “Line” video surveillance system, it is possible to send simple GET requests to the server and receive a response from it, which will greatly assist us in monitoring the system. The full specification can be found at the link: devline.ru/aboutweb .
Let's consider the request for a separate frame from camera number 9 on our server.
General view of the request (numbering of cameras from 0)
Go to the menu "Settings" - "Templates". At the template, click on the "Web", then "Create a web script."
A full description of the fields can be found here.
Fill in the fields:
Go to the "Steps" section and add a step with the following characteristics:

Go to the section "Authentication":

Click "Add".
Go to the "Monitoring" - "Web".
We see our web monitoring.

Now in this template we will create the trigger.
Click "Add".
Next, configure the action with our trigger.

Turn off the camera and check the mail.

Let's consider the request for a separate frame from camera number 9 on our server.
General view of the request (numbering of cameras from 0)
http://localhost:9786/cameras/8/image Go to the menu "Settings" - "Templates". At the template, click on the "Web", then "Create a web script."
A full description of the fields can be found here.
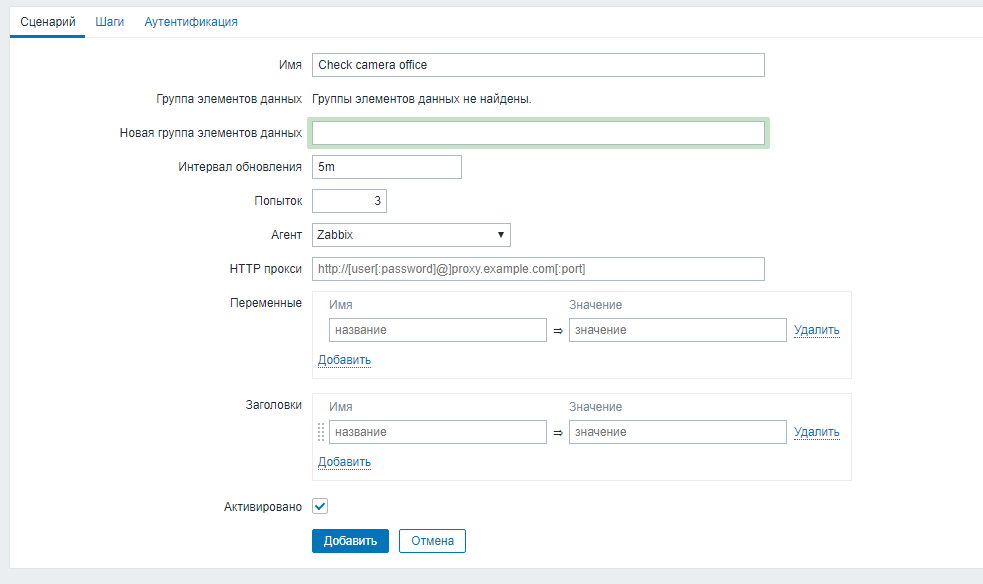
Fill in the fields:
"Name" - Check camera office;
"Update Interval" - 5 m;
“Attempts” - 3;
“Agent” - Zabbix.
Go to the "Steps" section and add a step with the following characteristics:
“Name” - we come up with the name of the step;
“URL” - from the specification we take the request for a frame: 127.0.0.1 : 9786 / cameras / 8 / image ”;
“Follow redirects” - uncheck;
“Download headers only” - note;
"Waiting time" - 15 s;
“Required status codes” - 200.
Go to the section "Authentication":
"HTTP authentication" is simple;
“User” and “Password” - data for connecting to the “Line” server.
Click "Add".
Go to the "Monitoring" - "Web".
We see our web monitoring.
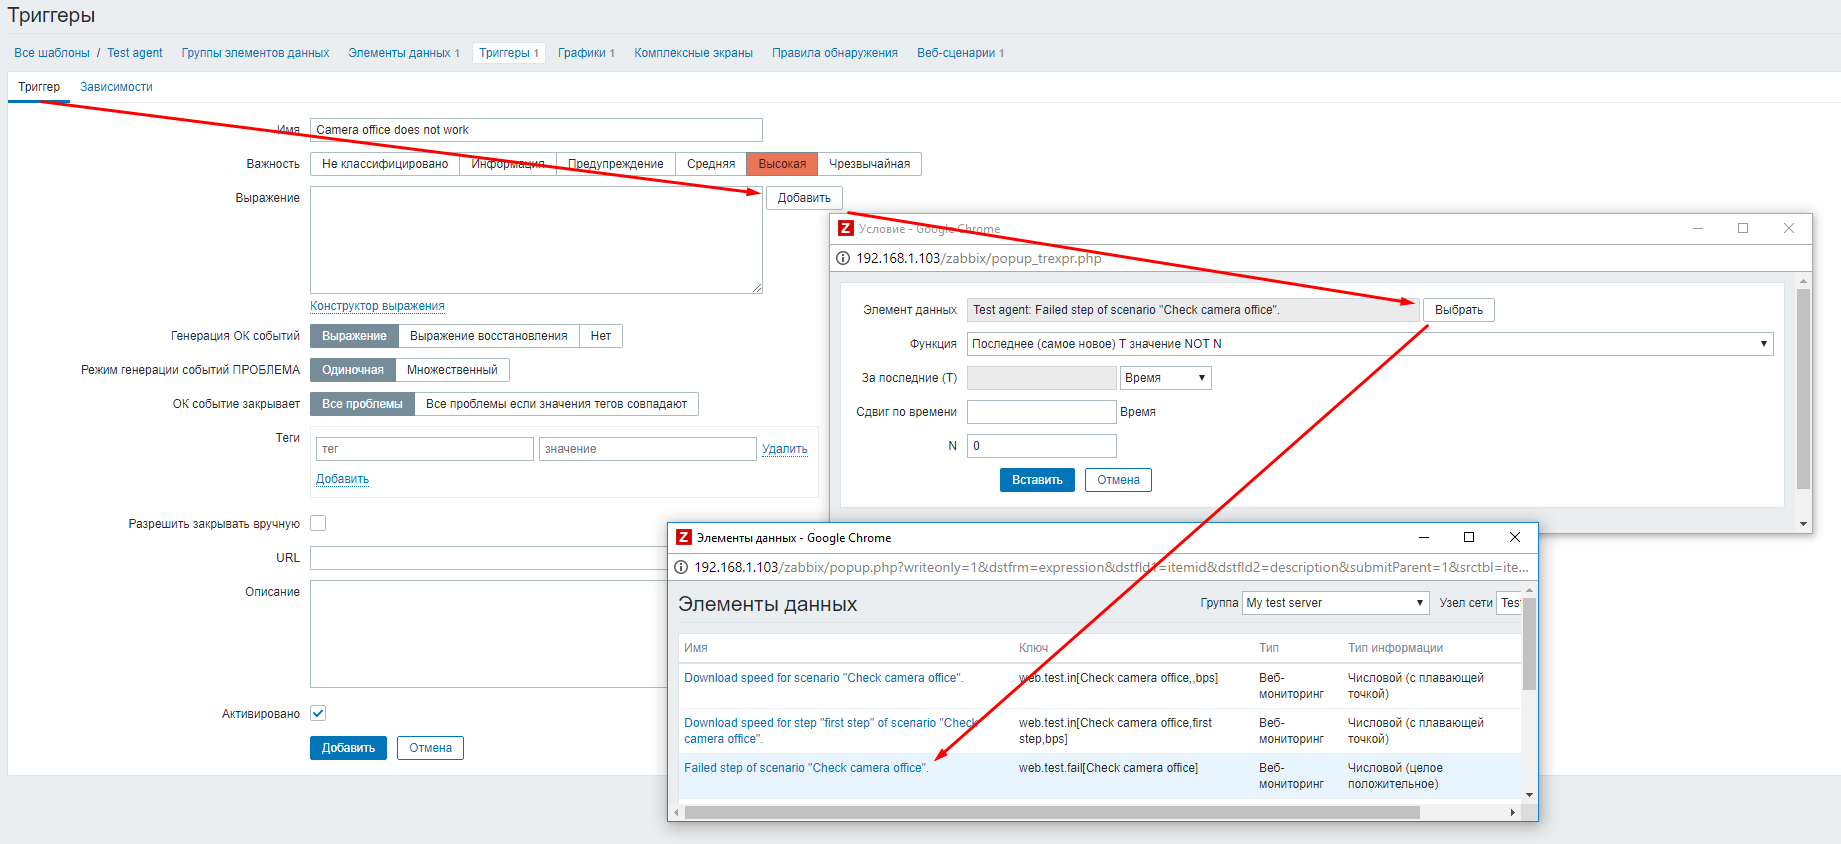
Now in this template we will create the trigger.
“Name” - specify the name for our trigger.
“Expression” - create an expression with the data element “Failed step of scenario - Check camera office.
“Function” - “Last (most recent) T value is NOT N”.
"N" - set to 200.
Click "Add".
Next, configure the action with our trigger.
Turn off the camera and check the mail.
"Cloud Line"
Additionally, monitoring server availability can be configured using the free Line Cloud service . To do this, you must register the server based on the software "Line" in the service.
To do this, open the “Observation Post”, then go to the “Administration” menu, in the “Network” tab, select the “Services” item.
The next step is to put a tick "Enable Dynamic DNS", enter a valid email address, the desired domain name and click "Register".
Further, a confirmation code will be sent to the specified box, which must be entered to complete the registration.
After entering the code, you must click "Confirm".
This completes the process of enabling the Dynamic DNS service and registering a domain name.
Next, go to the Line Cloud service and go to the Monitoring tab. Here we put a tick "Enable monitoring" and enter the email, which will receive letters. You can also specify a phone number to send sms-messages (the cost of one SMS will be 3 rubles).
Reactions
Camera monitoring can be configured using reactions in the Line software itself.
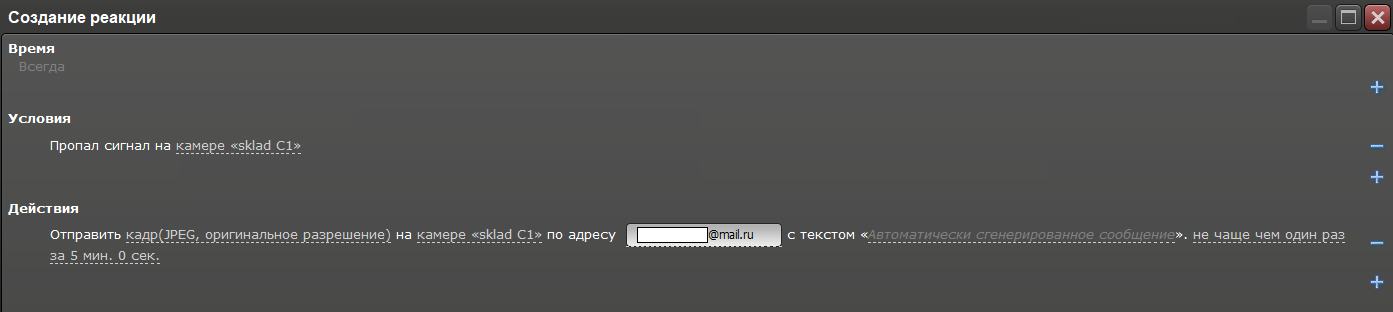
To do this, go to the "Administration" - "Reactions" - "Add a reaction."
Time - we leave "Always."
The condition - "Missing signal from the camera."
Action - “Send Email”.
We fill our mail, choose which camera to send frames from, and set the interval to 5 minutes.
Zabbix and video surveillance
So, we have reviewed the main ways of working with the zabbix monitoring system. This is by no means all of its capabilities, but we hope that this article has benefited you and was interesting. We hope that with this knowledge you will be able to continue to customize the monitoring of your video surveillance system. If you have any questions, we will be happy to answer them in the comments.
We also offer to share your experience in the comments. What tools for monitoring network / servers / routers / sites do you use?
Source: https://habr.com/ru/post/371325/
All Articles