Virtual expedition to the moon. Practical guide
By the beginning of the 21st century, mankind has accumulated a vast array of data about our natural satellite, the Moon. However, the search for these materials for non-professionals may be difficult due to their scatter on various highly specialized resources. In this review, I suggest you familiarize yourself with a very interesting resource LROC , which is a high-resolution map of the moon (1-0.5 m / pixel). The map is supplemented with a solid scientific toolkit and 3D display of the required area. Thanks to the "Lunar Orbital Scout" , anyone can go on a journey on the surface of our natural satellite.
The map is made up of a synthesis of various images of the Moon, made from both the Earth (low resolution) and the lunar orbit. Scientific information includes data from LRO, GRAIL, Clementina and Chandrayan 1. The LRO-LROC lunar probe chamber is a modified version of the photographic technique installed on the Martian fellow of the MRO probe. It includes a high resolution camera of 1-0.5 m / pixel (NAC) and a wide-angle camera with a resolution of 100 m / pixel (WAC).
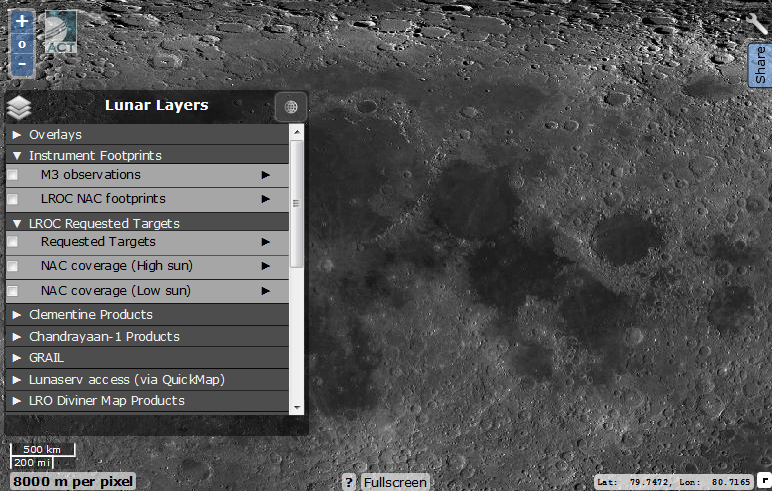
The LROC resource at the first acquaintance gives us the visible hemisphere of the Moon in the orthographic projection (that is, the way we see it from the Earth). By default, an array of high-resolution images (up to 1-0.5 m / pixel) has been applied, made by LRO for most of the lunar surface.
')
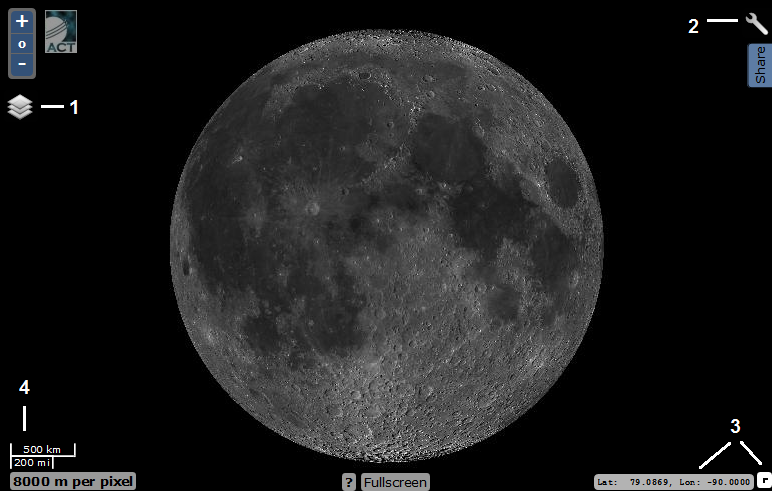
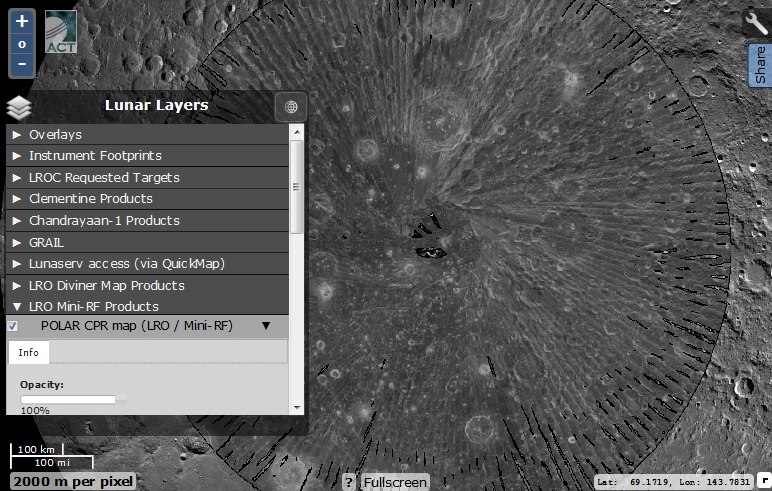
1 - layers menu; 2 - the menu of geodetic study of the surface relief; 3 - navigation menu (coordinates, navigation); 4 - scale
If you want to have the whole area of the moon "at hand", I recommend that you change the projection to cylindrical (equidistant cylindrical), which can be done in the layers menu
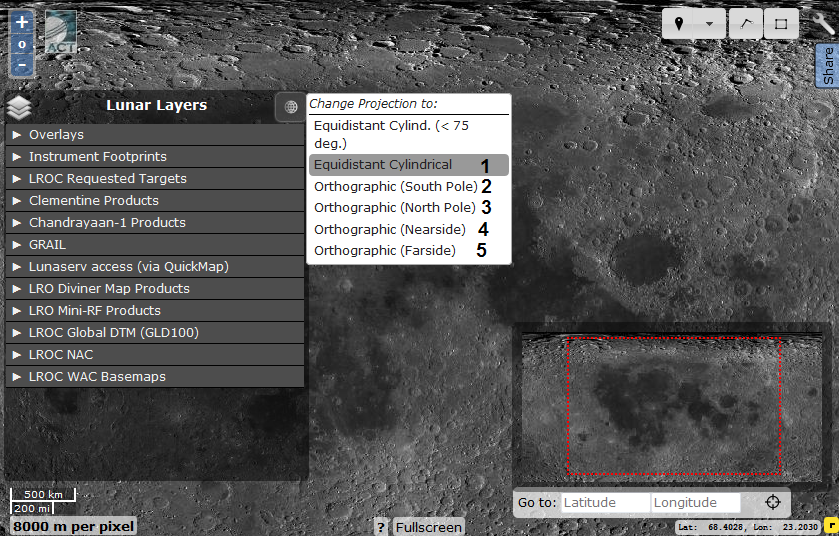
1 - Cylindrical projection (the entire surface of the Moon); 2 and 3 - orthographic projection of the south and north poles; 4 and 5 - orthographic projection of the visible and reverse hemispheres of the Moon.
Let's start with the study of various scientific "layers" available in the resource LROC. The overlay of these layers works on the same principle as in adobe Photoshop - select the desired layer with a checkmark and adjust the transparency to make them superimpose on each other. It should be noted that different layers have different resolutions.
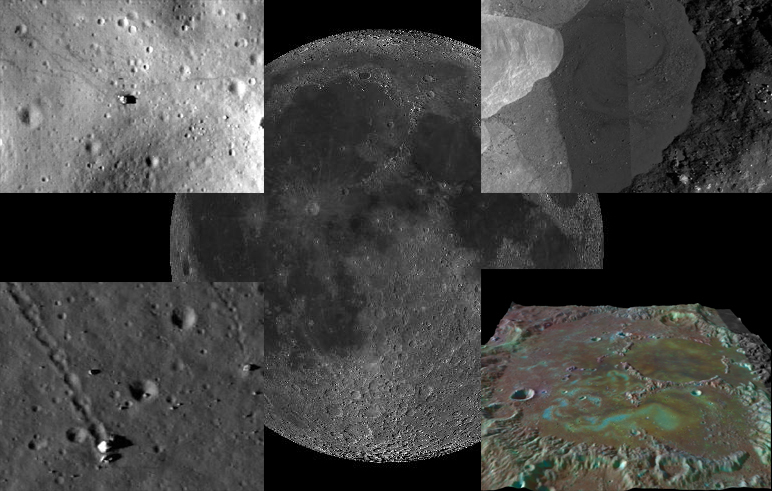
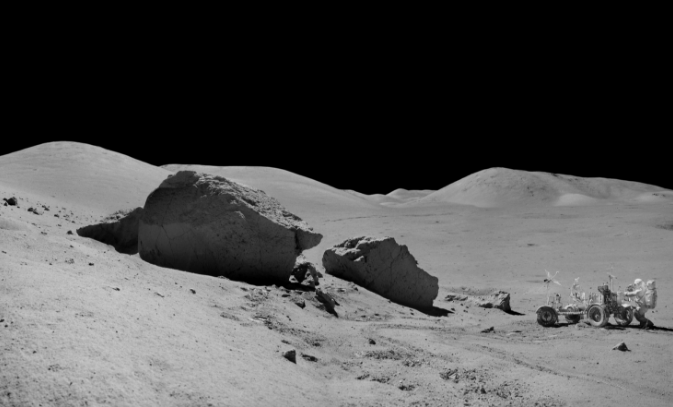
The first activated layer is an array of high-resolution orbital images. It is thanks to him that the main potential of the resource is revealed. On the map we see a cobblestone rolling down from the mountain at a resolution of 0.5 m / n and a thin dark line of tracks below it.
The same pieces of the split stone, taken by the Apollo 17 expedition.
But still we will not stop in this group of layers, looking ahead, everything is in order.

The first group of layers: 1 - coordinate grid; 2 - the area of the lunar surface illuminated at the given time; 3 - position of the satellite LRO; 4 - regions taken in stereo mode (double click on the desired point and load the map); 5 - marks the zones whose images were laid out on the LRO website; 6 - the nomenclature of objects on the surface of the moon (with a resolution of 500 m / pixel and more). In the nomenclature submenu there is a search that is very reluctant to search for the majority of artificial objects on the surface of the moon. In the submenu of most layers, you can adjust their transparency.
The next two groups of layers: 1 - the area of the mineralogical studies conducted by the Chandrayaan 1; 2 - published surface images (in fact, displays areas taken in high resolution); 3 - surface areas that must be removed again (when the map resolution is higher than 1 km / n); 4 and 5 - the surface area taken at the zenith of the Sun (small shadows) or at its low position (long shadows).
We proceed directly to the geological layers.
Clementine Products
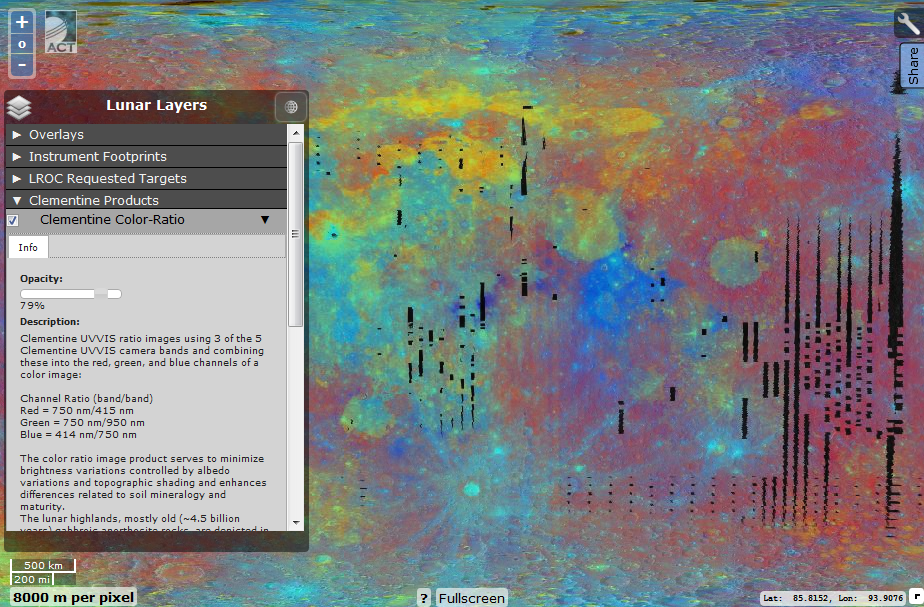
Clementine's lunar probe in the 90s created a mineralogical map of the moon, based on different color ratios of its surface. Her data and presented in this layer. The most ancient regions are marked in red (up to 4.5 billion years). Lunar seas (3.9-1 billion years old), rich in iron at different titanium ratios, are marked by yellow / orange gradations (rich in iron, poor in titanium) and blue (rich in iron at maximum titanium admixture). In general, the oldest regions are marked in dark red, the youngest ones are dark blue.
"Magnetic Sunblock Cream"
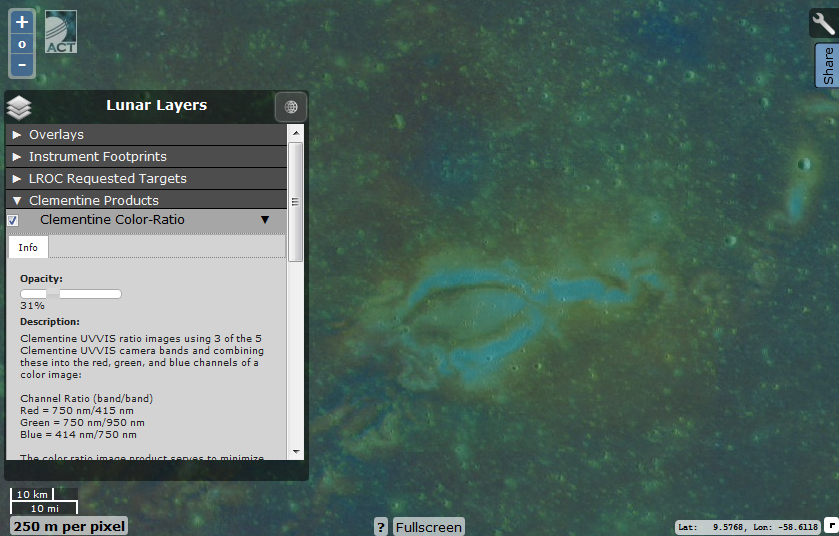
In this area of the image, the region of the selenium-magnetic anomaly is visible - Reiner Gamma (with a layer of Clementine applied). It corresponds to the local concentration of heavy metals. In the visible range, the region is clearly visible from the Earth, since it is brighter than the surrounding surface. Local magnetic fields protected the regolith from the solar wind, which tends to obscure the lunar seas. This predetermined the unusual "turbulent" appearance of the area.
Chandrayaan 1 Products
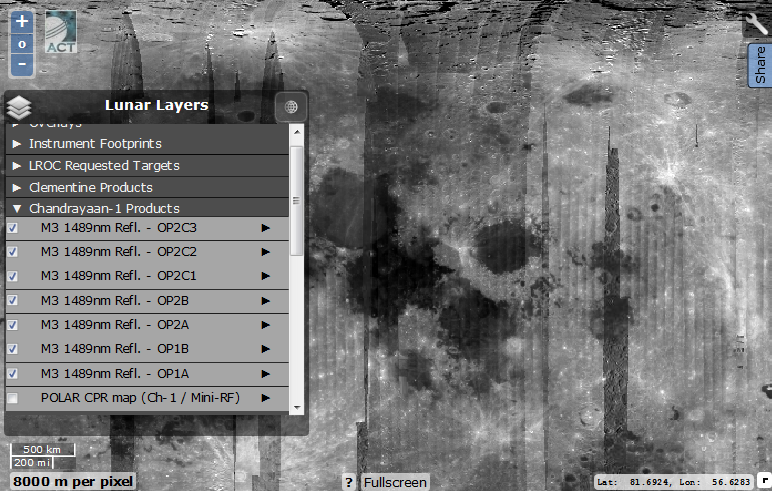
The Indian probe Chandrayan mapped the reflectivity of the lunar surface at a wavelength of 1489 nm. The most visible is the albedo layer of polar regions (it is necessary to switch to the desired polar projection), the brightest zones of the poles correspond to the local concentration of water ice.
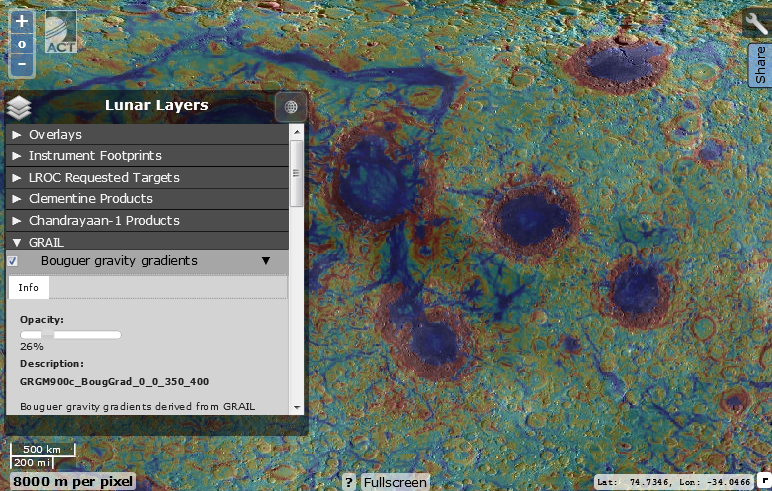
GRAIL, a layer of gravitational gradient of the surface of the Moon, composed of two probes of the program of the same name. Dark blue indicates areas with high values of gravity, dark red - areas with the lowest gravity. However, in terms of mass concentration, the map should be interpreted in the opposite way - the crust on the far side of the moon is much thicker and more massive than on the visible. Features of the tidal capture of the Moon by the Earth have led to the fact that we see the least massive, rich in the seas, hemisphere of a natural satellite.
Lunaserv access
These layers can help in case you need alternative surface illumination, or you need images of areas not affected by LRO.
LRO diviner map products
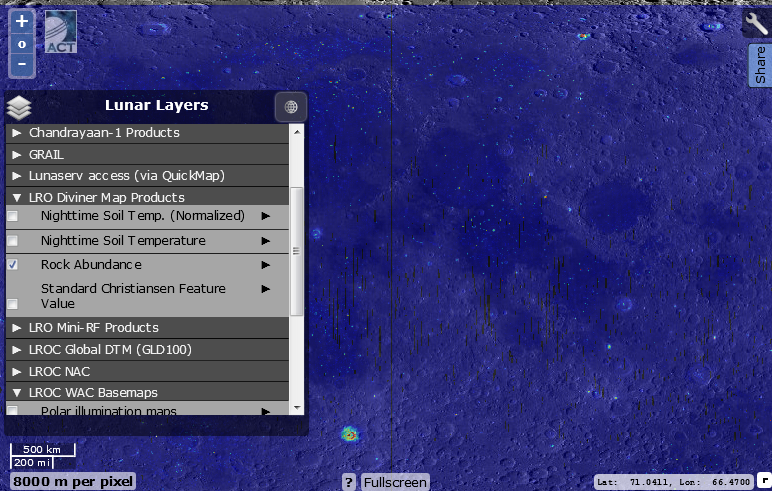
Temperature and geological layers. The first two show the difference in night temperatures of the lunar surface. Green indicates the average value (about -153 ° C), dark blue - a colder deviation from this value (up to -180 °), red, the warmest (up to -120 °). The third, activated layer is a map of rock accumulations on the lunar surface. These rocks usually cool down more slowly than the surrounding soil, and automatic stations use them to search for them. 4 - Christiansen scale for silicate rock composition. The dark blue denotes silicates characteristic of plagioclase (composed of sodium, calcium, aluminum, silicon and oxygen), the dark blue, silicates rich in olivine (consists of magnesia, iron, silicon and oxygen).
LRO Mini- RF Products
Another polar albedo map of the polar regions (visible in the polar projection) used to search for water ice.
LROC Global DTM
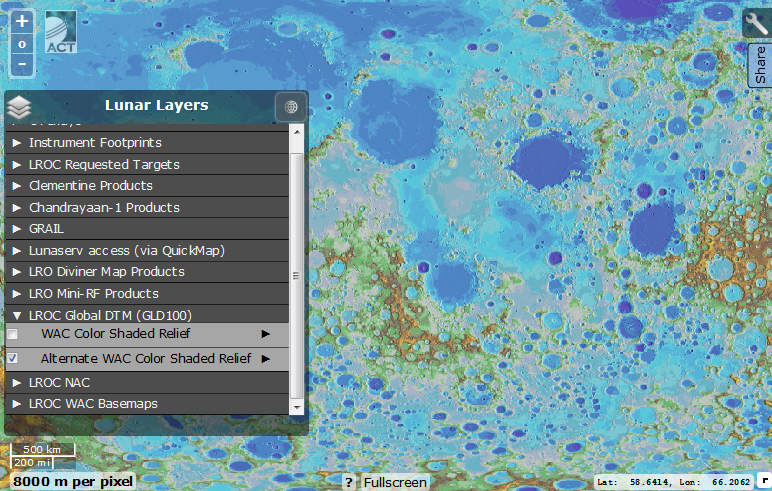
To choose from, two layers illustrating the surface relief of the satellite. As in most other layers, in the submenu you can adjust the transparency of the map in projection on other layers.
LROC NAC (high resolution camera layers)
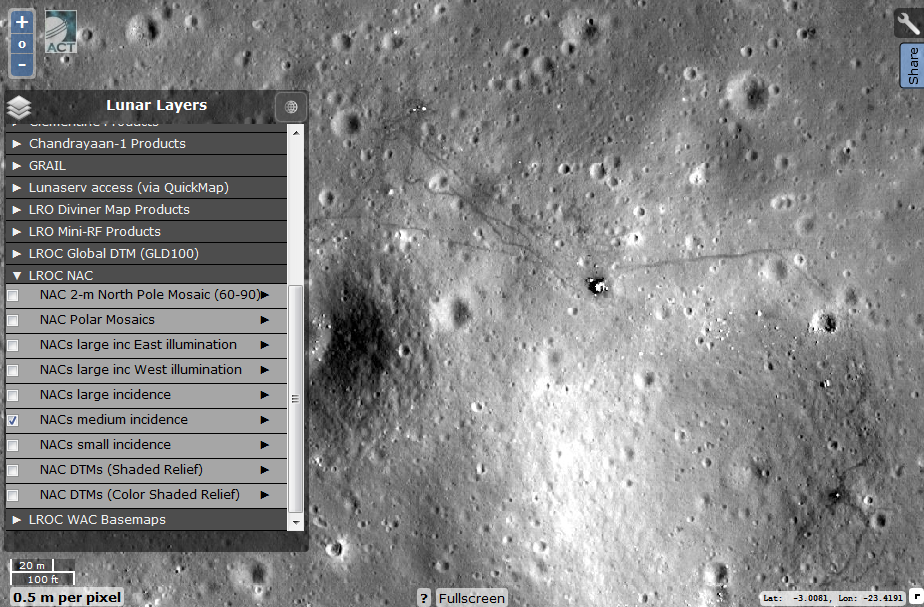
LRO was engaged in shooting the surface of the moon at different angles of incidence of sunlight. Lower resolution cameras were also filmed at different angles to the satellite surface. In this group of layers, you can select a map of zones taken at different angles of illumination (zones are visible at a resolution above 2 km / pixel). Often the same regions were filmed at different angles of illumination: east - the illumination falls from the east, the west - from the west. Large - the sun is low over the horizon, long shadows; medium - the sun is located approximately between the horizon and the zenith, moderately long shadows; small - the sun is high above the horizon, the minimum shadows.
The workplace of the Apollo 12 expedition, shot at different angles of illumination.
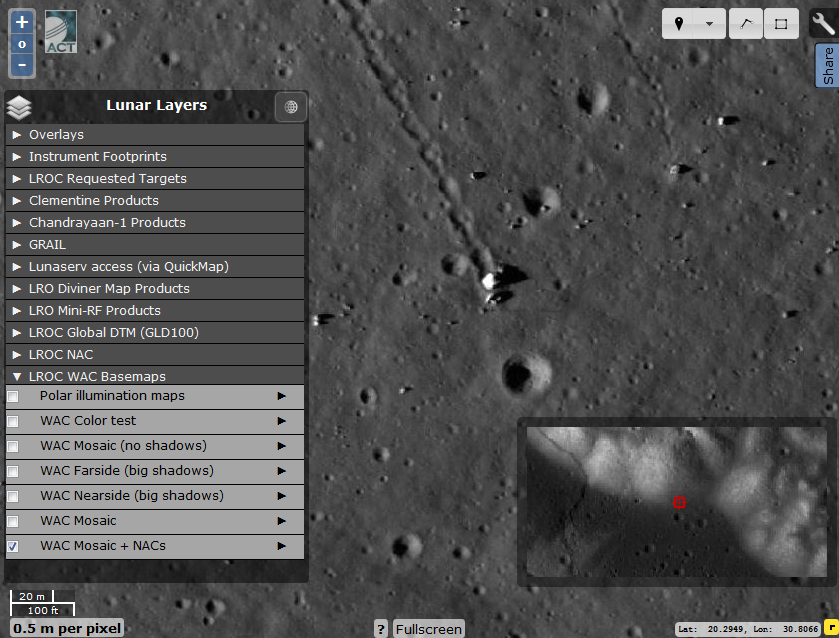
LROC WAC Basemaps (wide-angle camera layers)
The last group of layers, and the first we saw.

1 - Polar map of illumination, the dark zones of this layer show areas of "eternal darkness" where sunlight never hits. Light areas, on the contrary, are constantly illuminated by the sun. These regions are the most interesting for future manned or automated expeditions. 2 -5, low resolution carts (100-500 m / pixel): 2 - Color map of the Moon; 3 - Map of the Moon without shadows; 4-5 - Maps of the reverse and visible sides of the moon with long shadows; 5 - Map of the Moon with moderate shadows; 6 - Base layer WAC snapshots with embedded NAC high resolution layer.
Change the different layers of the moon's surface display. Let me remind you that these layers, like many others, have a transparency setting.
Moon in 3D
Of course, sometimes it is very interesting to stroll through the lunar expanses using 2D images of the Moon in high resolution. But it is no less interesting to look at the moon in the third dimension. To do this, we use the geodesic menu.
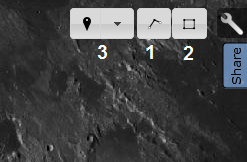
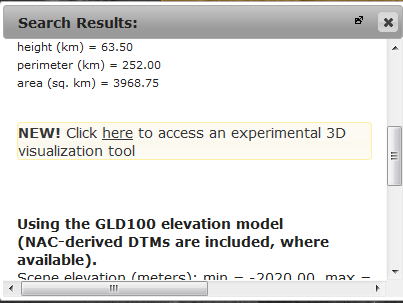
The first ruler performs two functions — calculating the distance / dimensions and simultaneously drawing up a geodesic graph of the elevation difference from point “A” to point “B”. The flexibility of the ruler allows you to measure dimensions (and height difference) for objects of irregular, circular or distorted shape. To do this, at the last point, press the left mouse button twice.

Geodesic graph of the heights of the endogenous catena of Huygens (a geological layer is imposed). Catenas are chains of craters on the surface of celestial bodies. There are endogenous catens (appearing due to rock collapse in cracks in the ground) and shock, caused by the simultaneous fall of a group of objects (large meteorites often collapse when approaching massive objects, due to the tidal action of the latter).
The length of the graph is limited only by the surface of the moon. Resolution from tens, to hundreds of meters / pixel.
The second option offers a full 3D projection of the selected area of the moon, with a similar geodesic scale, resolution. The maximum area available for 3D rendering is approximately 1 million km2 (1000x1000km). This function also works simultaneously with any scientific layer.
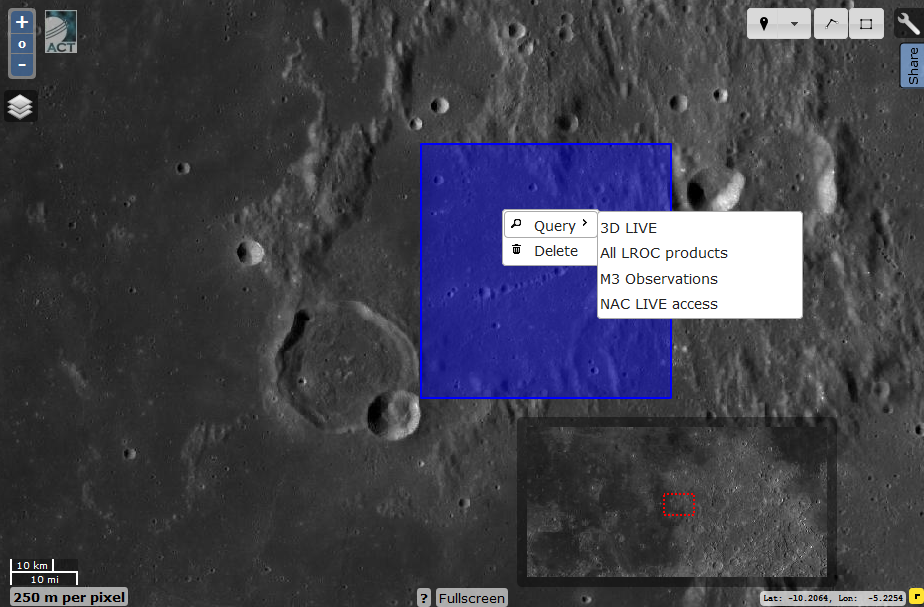
To obtain a 3D projection, select the desired zone, click the left mouse button and select 3D Live in the menu.
We are waiting until the program loads the region, and in the window that pops up we follow the link.
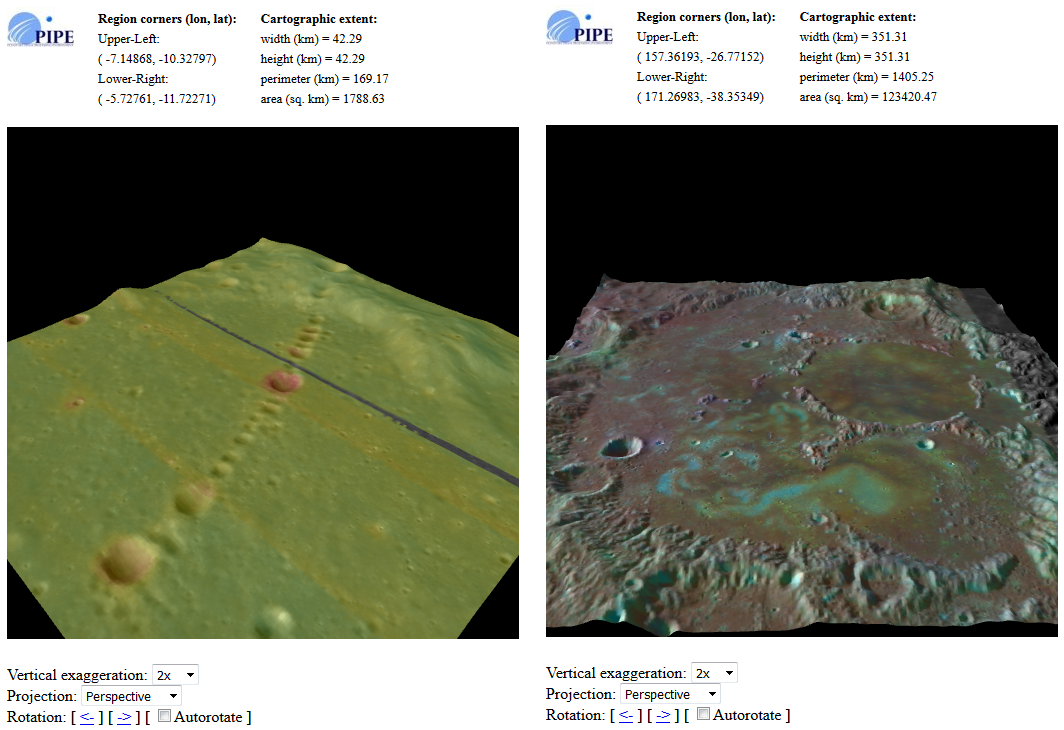
On the left, a 3D model of Davy's shock catena, with a superimposed layer of night temperatures. Now the region can be viewed from all sides, enable automatic rotation, change for clarity, the elevation difference (up to x10) and the display mode (perspective and orthographic). On the right, the Sea of Dreams with a superimposed geological layer, accumulations of heavy metals and selenium-magnetic anomalies are visible, similar to Rainer Gamme.
The LROC server allows you to download raw data about the 3D landscape, which can be useful for developers of scientific applications or computer games.
The third point represents a bookmark where you can save the coordinates of interesting finds on the surface of the moon.
At the same time with this server, I advise you to use google moon maps. Although google moon maps are inferior to LROC in terms of functionality and resolution, but they surpass it in the search for artificial objects. These cards will make it much easier for you to find traces of American and Soviet missions.
Have a nice expedition!
Source: https://habr.com/ru/post/370121/
All Articles