What does the technical director spend his time on: a minute report for the whole year
 The question of effective management of your working time is relevant for any developer. For technical director - all the more. CTO of one of the British startups, spoke about the samopisny solution, which allowed him to analyze his own productivity for more than 1 year. Next we bring to your attention the text of the publication, translated into Russian and adapted by the editors of the blockchain-startup Wirex .
I am a co-owner and CTO of a successful SaaS startup Overleaf. Our office is located in London. From August 2014 to December 2015, I manually monitored my working time, minute by minute, and analyzed the data in R.
Like most people involved in time accounting, I set out to improve my own productivity. I received data that helped answer questions if I did not spend too much or too little time on certain types of activities. For example, on user support or client projects. The data obtained showed that my intuitive feeling in these questions was often incorrect.
My experiment had other, less significant, but quite useful results. I was encouraged by the fact that on Fridays I had an answer to the traditionally rhetorical question “Where has all my time been this week?”. I also noticed that I was less likely to switch between tasks: if I paused in the main activity to respond to a message or letter, I had to record it in my tracker. I suppose such an additional obstacle has paradoxically increased the overall performance.
')
This post documents a simple system that I created to take my time, data analysis approaches and results into account. The main thing that I understood in the process:
- I tracked that on average I spend a little more than 50 hours a week doing real work. Now I am skeptical about the stories about the 130-hour week.
- Time management costs increased by 230%, while the team grew by 200% (from 2 to 6 people). Curiously, time wasted on meetings and meetings reduced by 70%.
- Time for the development itself remained in the previous framework, but this is primarily because it shifted from weekdays to weekends.
The role of the CTO is multidimensional, and I do not think that the results I obtained will be true for everyone. This is just my experience. I hope it will be interesting, in the end it is based on real data.
Background
I should tell you about the company so that you understand the context.
I and the coaounder founded Overleaf at the end of 2012. By August 2014, when I began my experiment taking into account time, we passed through the accelerator Bethnal Green Ventures , hired our first developer (there were three of us) and went through a sowing round of Digital Science - a London-based trade investor. By December 2015, when I finished the experiment, we were already 9 people. Five of them - the developers in my submission. We started mainly as B2C, but gradually shifted towards B2B, began to sell ourselves to universities and scientific publications. We now have about 400,000 users.
Our product is a multiplayer online editor modeled on Google Docs, but focused on scientific work. It is great for a set of equations, charts, tables, reference documents, since it is based on the LaTeX recruitment system. So we are a company for geeks, where such strange experiments are encouraged.
Methods
You can find out how I collected and processed the data in this section, or skip and go directly to the results .
Application "metime"
Update of 08/30/2016: I opened the “metime” source code in case you want to know some details.
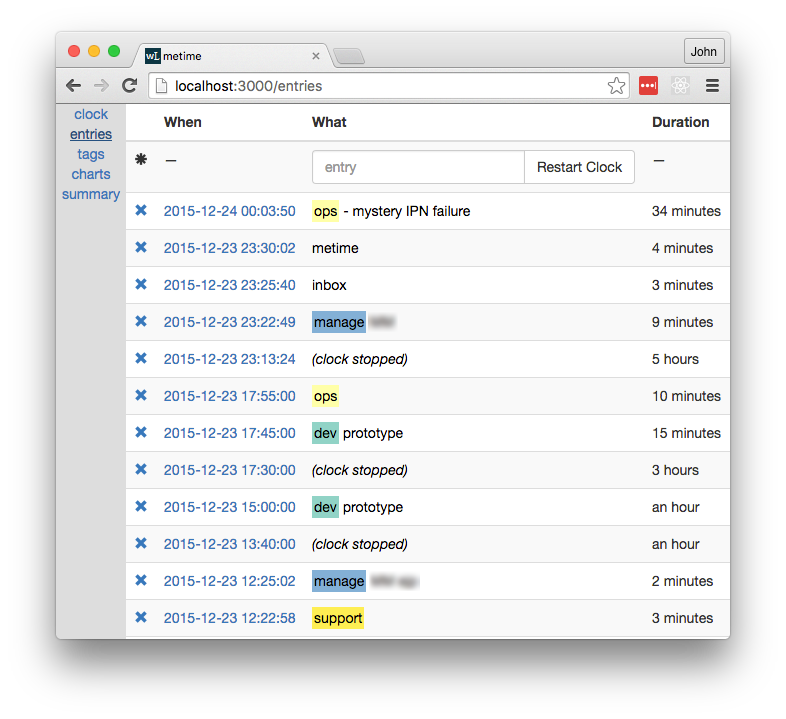
I wrote a simple web application to record how time is spent. There are many tracker apps, but I wanted something that I could customize. It is written on meteor , so I called it “metime”. It will not win awards, but it does its work. It looks like this:
Key features:
- At the end of each activity, I made a descriptive entry in the application.
- Each entry is accompanied by one or more tags and an optional comment.
I used the “simple text” format to simplify input. Tags are separated by spaces, and their list is separated from the comment by a hyphen.
For example, at the top of the screenshot, for 2015-12-24 00:03:50 , I ended up working with the ops tag and added a comment that I tried to debug the “mysterious IPN error”. The previous entry has a mark 2015-12-23 23:30:02 , that is, the duration of work with the ops tag was 34 minutes.
If I was finishing work on something, I would press the “Restart Clock” button before returning to work. Clicking created a special entry “ clock stopped ”. For example, I did not work from 17:55:00 to 23:13:24 , that is, 5 hours. Most likely, I spent this time at dinner and chatting with my family.
Of course, sometimes I forgot to create records. In this case, I made several entries at a time and then edited the time stamps manually to get the correct duration. That is why some marks have suspiciously round numbers. I didn’t like doing that, so I tried to track my work in real time.
Tags
I decided to use tags, not categories, so I could tag a business meeting with the tags “ biz ” and “ meeting ”. The application recognized and applied color coding to some tags, but each word before the dash was considered a tag. I tagged people, projects, and customers (they are the ones in the screenshot above). For obvious reasons, I must respect the confidentiality of such information.
As is often the case with tags, the preference for setting has changed in the course of the experiment. So at the end of the reporting period, I had a lot of work on combining different tags into a single set suitable for analysis. Here are the main tags and their meaning:
- biz : administration, sales, marketing, investment, working with suppliers, working with user feedback, metrics and analytics
- dev : coding, prototyping, creation of structural schemes (wireframing), searching for bugs and fixing them
- hiring : reading resumes, conducting interviews, contracts, meetings, contacts with recruiters
- inbox : work with mail and notifications
- manage : personal planning, sprint planning, developer training, one-on-one meetings, code review, retrospectives
- meeting : scheduled meetings, meetings and calls
- metime : time spent on accounting time in the application (and a bit on the development of the application itself)
- qa : manual testing
- support : end-user support
Data processing
It took additional actions to correctly take into account time zones, the transfer of hands, weekends and holidays.
The application did not fix the time zone for each record, although it would be worth it. To calculate the “time of day”, it was necessary to take into account time zones in order not to lose sight of the translation of the hands and the trip. I had quite a few business trips to the USA and to the continent. I had to review all the material and manually add data on time zones, referring to the calendar.
I initially did not think that you need to enter special annotations for the holidays. The fact that I referred them to the “clock stopped” category led to significant emissions in statistics, because the week of vacation is obviously not typical. So I had to manually mark the time of vacation.
Yes, I had a vacation. Professional advice: want to go offline, visit China. A great firewall will protect you from most of the email.
results
As a result, I received a table containing 11978 records for the period from 2014-08-17 to 2015-12-23, that is, for 493 days. For each entry, the start time (UTC), time zone, and duration (in seconds) are indicated, plus one column with a Boolean value for each tag. I also added the “ stopped ” pseudo-tag, which means that the clock was stopped. The table for the screenshot above looked like this:

I marked 41 days as weekends and holidays and excluded them from the results that you will see next. As a result, 452 days remained, each of which had an average of 26 entries. Go to the charts!
Clock time
Perhaps the most popular question is: how many hours did it go? For the average, I took 52 hours a week (the dotted line in the graph below). The failure in May-June 2015 caused by the holidays.

The resulting schedule is based on a strict definition of "working time". If it took me a couple of minutes to pour tea, stretch my legs, go to the toilet or read an article on Hacker News, I stopped the clock, and those minutes were not counted during working hours.
In an industry where we often talk about the work week at 130 hours, 52 hours is no reason to brag. I can hardly be called lazy. I did not count my non-working hours, but I definitely never approached them so consciously. A few hours every day it took me to eat, to get to work, hygienic procedures and other everyday things. In those weeks when it was possible to work for 70 hours, I, as a rule, simply neglected some things from this list. And, of course, we all need to sleep, and when it comes especially hard, we are glad to have every opportunity to live outside of work. But a startup is a marathon, not a sprint distance.
Tagging time
Go ahead. What did I spend my time on? For the entire period, the biz and dev tags have become the most voluminous. For each, on average, accounted for 18 hours a week. In the third and fourth place are management and meetings. They are followed by hiring and user support.

It is worth noting that often tags were combined (for example, “ biz meeting ”), in these cases the clock was not added to different tags. In this case, a comparison between the tags is quite acceptable.
It should also be borne in mind that I counted the time for counting time. This kind of activity is marked with the tag " metime ". Under this tag, I only counted time if it took more than one minute to calculate. Most often this happened when I entered several entries in hindsight. Obviously, the number of hours here is understated, but relatively slightly. No more than an hour a week.
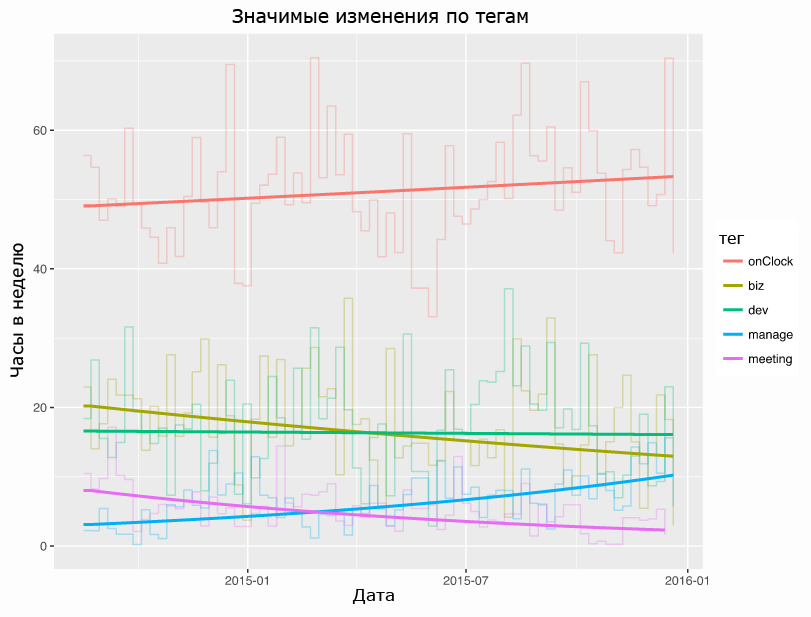
Change in trends over time
How, over time, did the distribution of hours vary across different activities? The overall schedule for the breakdown by week and tag would be too voluminous and loaded. To answer the question I tried several regression options, eventually settling on a logarithmic regression. Significant trends and exemptions are shown in the table below.
| Tag | Initial number of h / week | Final qty h / week | % Change | p <0.05 |
|---|---|---|---|---|
| biz | 20 | 13 | –36% | ✓ |
| dev | 17 | sixteen | –3.1% | |
| inbox | 1.3 | 2.9 | 120% | ✓ |
| manage | 3.1 | ten | 230% | ✓ |
| meeting | eight | 2.3 | –72% | ✓ |
| qa | 1.2 | 2.8 | 120% | ✓ |
| support | 3.3 | 1.6 | –51% | ✓ |
| (total time on the clock) | 49 | 53 | 8.6% |
For example, the average time I marked with the “ biz ” tag decreased by 36% from 20 hours to 13 hours a week during the course of the experiment. A check mark in the last column indicates that the trend was statistically significant with a deviation of at least p = 0.05. Thus, despite the weekly changes, we can be sufficiently confident that this tag is characterized by a constant downward trend.
If we look closely at other significant trends, the overall picture will be as follows. With the growth of the team changed my role. I began to spend more time on management (“ manage ” tag), quality control (“ qa ”) and mail (“ inbox ”). A rather unexpected was the descending trend of meetings (“ meeting ”), despite the increase in the number of management hours. Most likely, this happened because I implemented many types of management activities, such as code analysis, not at meetings, but through GitHub and using chat rooms. Finally, many meetings took place on tasks that could get a tag " biz ", such as meeting with clients. In sum, the activity on the biz tag decreased as it was replaced by management activities.
I included two rows in the table for which no significant changes were noted. This is “ dev ” and total running time (total time on the clock). According to the total work time, there were no significant changes, because there was no significant growth during the experiment. Basically, the changes affected the content of the tasks I worked on. And why the number of development hours (" dev ") has not changed, we will find out in the next section.
Let's sum up. Here is a graphical display for changing the number of hours for each of the 5 main tags and their logarithmic regression, which shows the changes. This also added the pseudo-tag " onClock ", which shows the total number of working hours.
Weekdays vs weekend
What days did I do this or that job? Has anything changed here? To answer this question, I divided all the entries into three categories - by time:
- weekends : from 7 pm Friday to 7 am on Monday
- weekdays : 7.00-19.00, monday-friday
- working nights : remaining time (Monday to Thursday evenings)
The time interval from seven in the morning to seven in the evening - local time, taking into account the time zone.
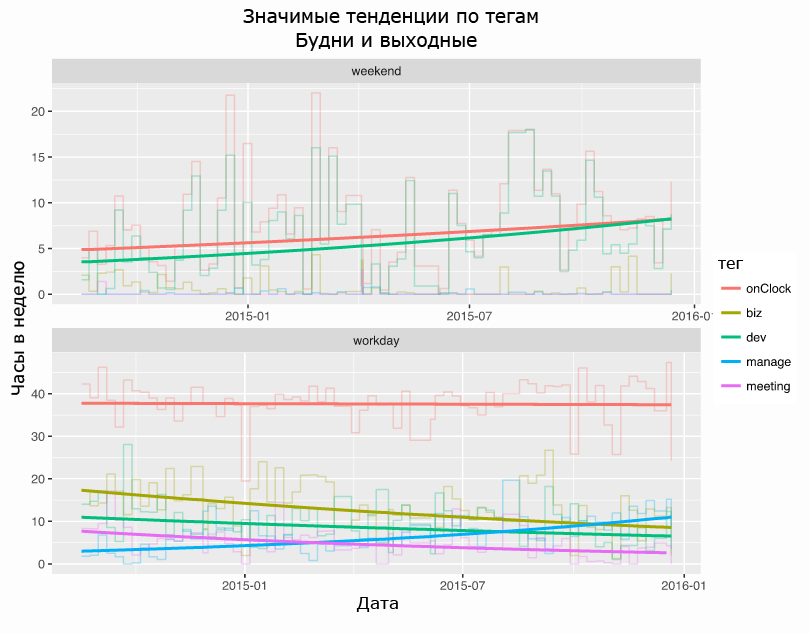
I repeated the regression analysis from the previous section for each category. Since most of the time taken into account fell into the category of everyday life, statistically significant trends here remained unchanged. However, the breakdown on weekdays and weekends revealed statistically significant trends for the “ dev ” tag and brought some clarity to the situation with the “ support ” tag, as can be seen below.
| Tag | Category | Initial number of h / week | Final qty h / week | <% Change |
|---|---|---|---|---|
| dev | weekends | 3.6 | 8.5 | 140% |
| dev | Weekdays | eleven | 6.5 | –40% |
| support | weekends | 0.29 | 0.68 | 130% |
| support | Weekdays | 2.4 | 0.83 | –65% |
The table shows that about 5 hours of development per week moved from weekdays to the weekend. In other words, while management activities on weekdays ousted development, I moved it over the weekend. Similarly, user support has moved there, but this shift does not exhaust the overall negative trend that we saw in the previous section.
The opened fact was for me a peculiar bell. First, I did not notice what was really going on. Secondly, "I will deal with this important task of developing over the weekend" - this is a so-so strategy. The information proved extremely useful for planning further rounds of hiring.
And this is how it all looks in graphic form. The graph is similar to the previous one, but the data is divided by the time of day. Positive and negative trends on the « dev » tag are clearly visible, as well as other significant changes from the previous section - for everyday life.
Conclusion
A logical question arises: why did I stop time tracking? As you can guess, such scrupulous accounting is tiresome. In addition, it began to seem to me that data collection is far ahead of the quality of their analysis. This is a significant moment for any research project. There were some simple graphical representations in my application, but there was no truly in-depth analytics. Only now, six months later, I had the opportunity to penetrate into the collected information. And I was finally able to get new ideas, what else can I track and which systems to use for this.
This project was for me the closest to the real research work over a long period. And since Overleaf is a tool for researchers and scientists, my project has become a good illustration of what a real research paper is. To forget how chaotic the process is is very easy. At the core of this post are about 3000 lines in the R-markdown files, on paper, most likely, all this would take much more space.
The original plan implied that all data and analytics for the post would be open, as I always did. However, this time I decided otherwise. Initially, I did not anticipate how personal the final data array would be, even though it’s only about my working time, even though I painted over the tags and notes that are classified as commercial secrets. As a result, I am pleased that the information that I gathered through my simple application belongs to me, not to a third party.
Having ceased to keep a record of working time, I was disoriented. But a few days later it passed. I switched to todo lists. With their help, I began to compile a list of daily tasks, it was less labor-intensive than to keep records throughout the day. I tried to take some finds, such as reducing the frequency of changing the context, and put them into practice. In the very near future, I do not plan to scrutinize working time equally scrupulously. But I ponder over repeating the experiment a month or two long and making a comparison - “was” and “became”. So - stay tuned!
You can learn the details of building a regression model, on the basis of which the author described the results described above, in the Appendix: Regressions section of the original article.
Continue to follow the updates of the Fintech blog of Wirex , which specializes in international money transfers without bank participation, and stay up to date with the most relevant materials on the implementation of technological solutions.
Source: https://habr.com/ru/post/369629/
All Articles