Earth from space: 15 amazing things in 15 years
In December 1999, NASA launched a satellite that opened a new era in our ability to see, measure and understand the Earth. The satellite, named Terra , was launched into space on December 18, 1999 (it was developed for a 5-year research mission, but still continues to collect invaluable data on land, atmosphere and ocean). In 2002 and 2004, two new satellites, called Aqua and Aura, launched after Terra. They are often called the three main satellites of the NASA Earth Observation System, which began seriously with Terra and now includes a fleet of 18 satellites. They revolutionized the ability to observe our planet from space.
NASA, as well as other space agencies, launched satellites to explore the Earth before. But the last 15 years have produced a more comprehensive look at the Earth from space than any other period in history. At a time when our planet is undergoing critical changes, this global view offers not only stunning pictures, but also vital information about how the Earth is changing.
In order to celebrate 15 years of successful operation of the Earth observation system, NASA collected 15 impressive and interesting images collected by three NASA orbiting satellites.
')
Getting a complete photograph of the Earth from space requires a complex sequence of actions. In 1972, the Apollo 17 crew took a camera to the moon in order to get a picture with a full image of the earth's sphere in sight. In 2002, NASA scientists and visualizers stitched together the results of long months of observation of the earth’s surface, oceans, sea ice and clouds into a true-color mosaic without any seams using the MODIS (Moderate-resolution Imaging Spectroradiometer) scanning spectroradiometer, tool on board terra. They added a layer of clouds to create the final composition Blue Marble , which has become one of the most iconic images of the Earth of the new century. In 2007, Apple chose Blue Marble as the default background for the iPhone. The MODIS Blue Marble version is currently used as the base layer for many NASA Earth data visualizations.
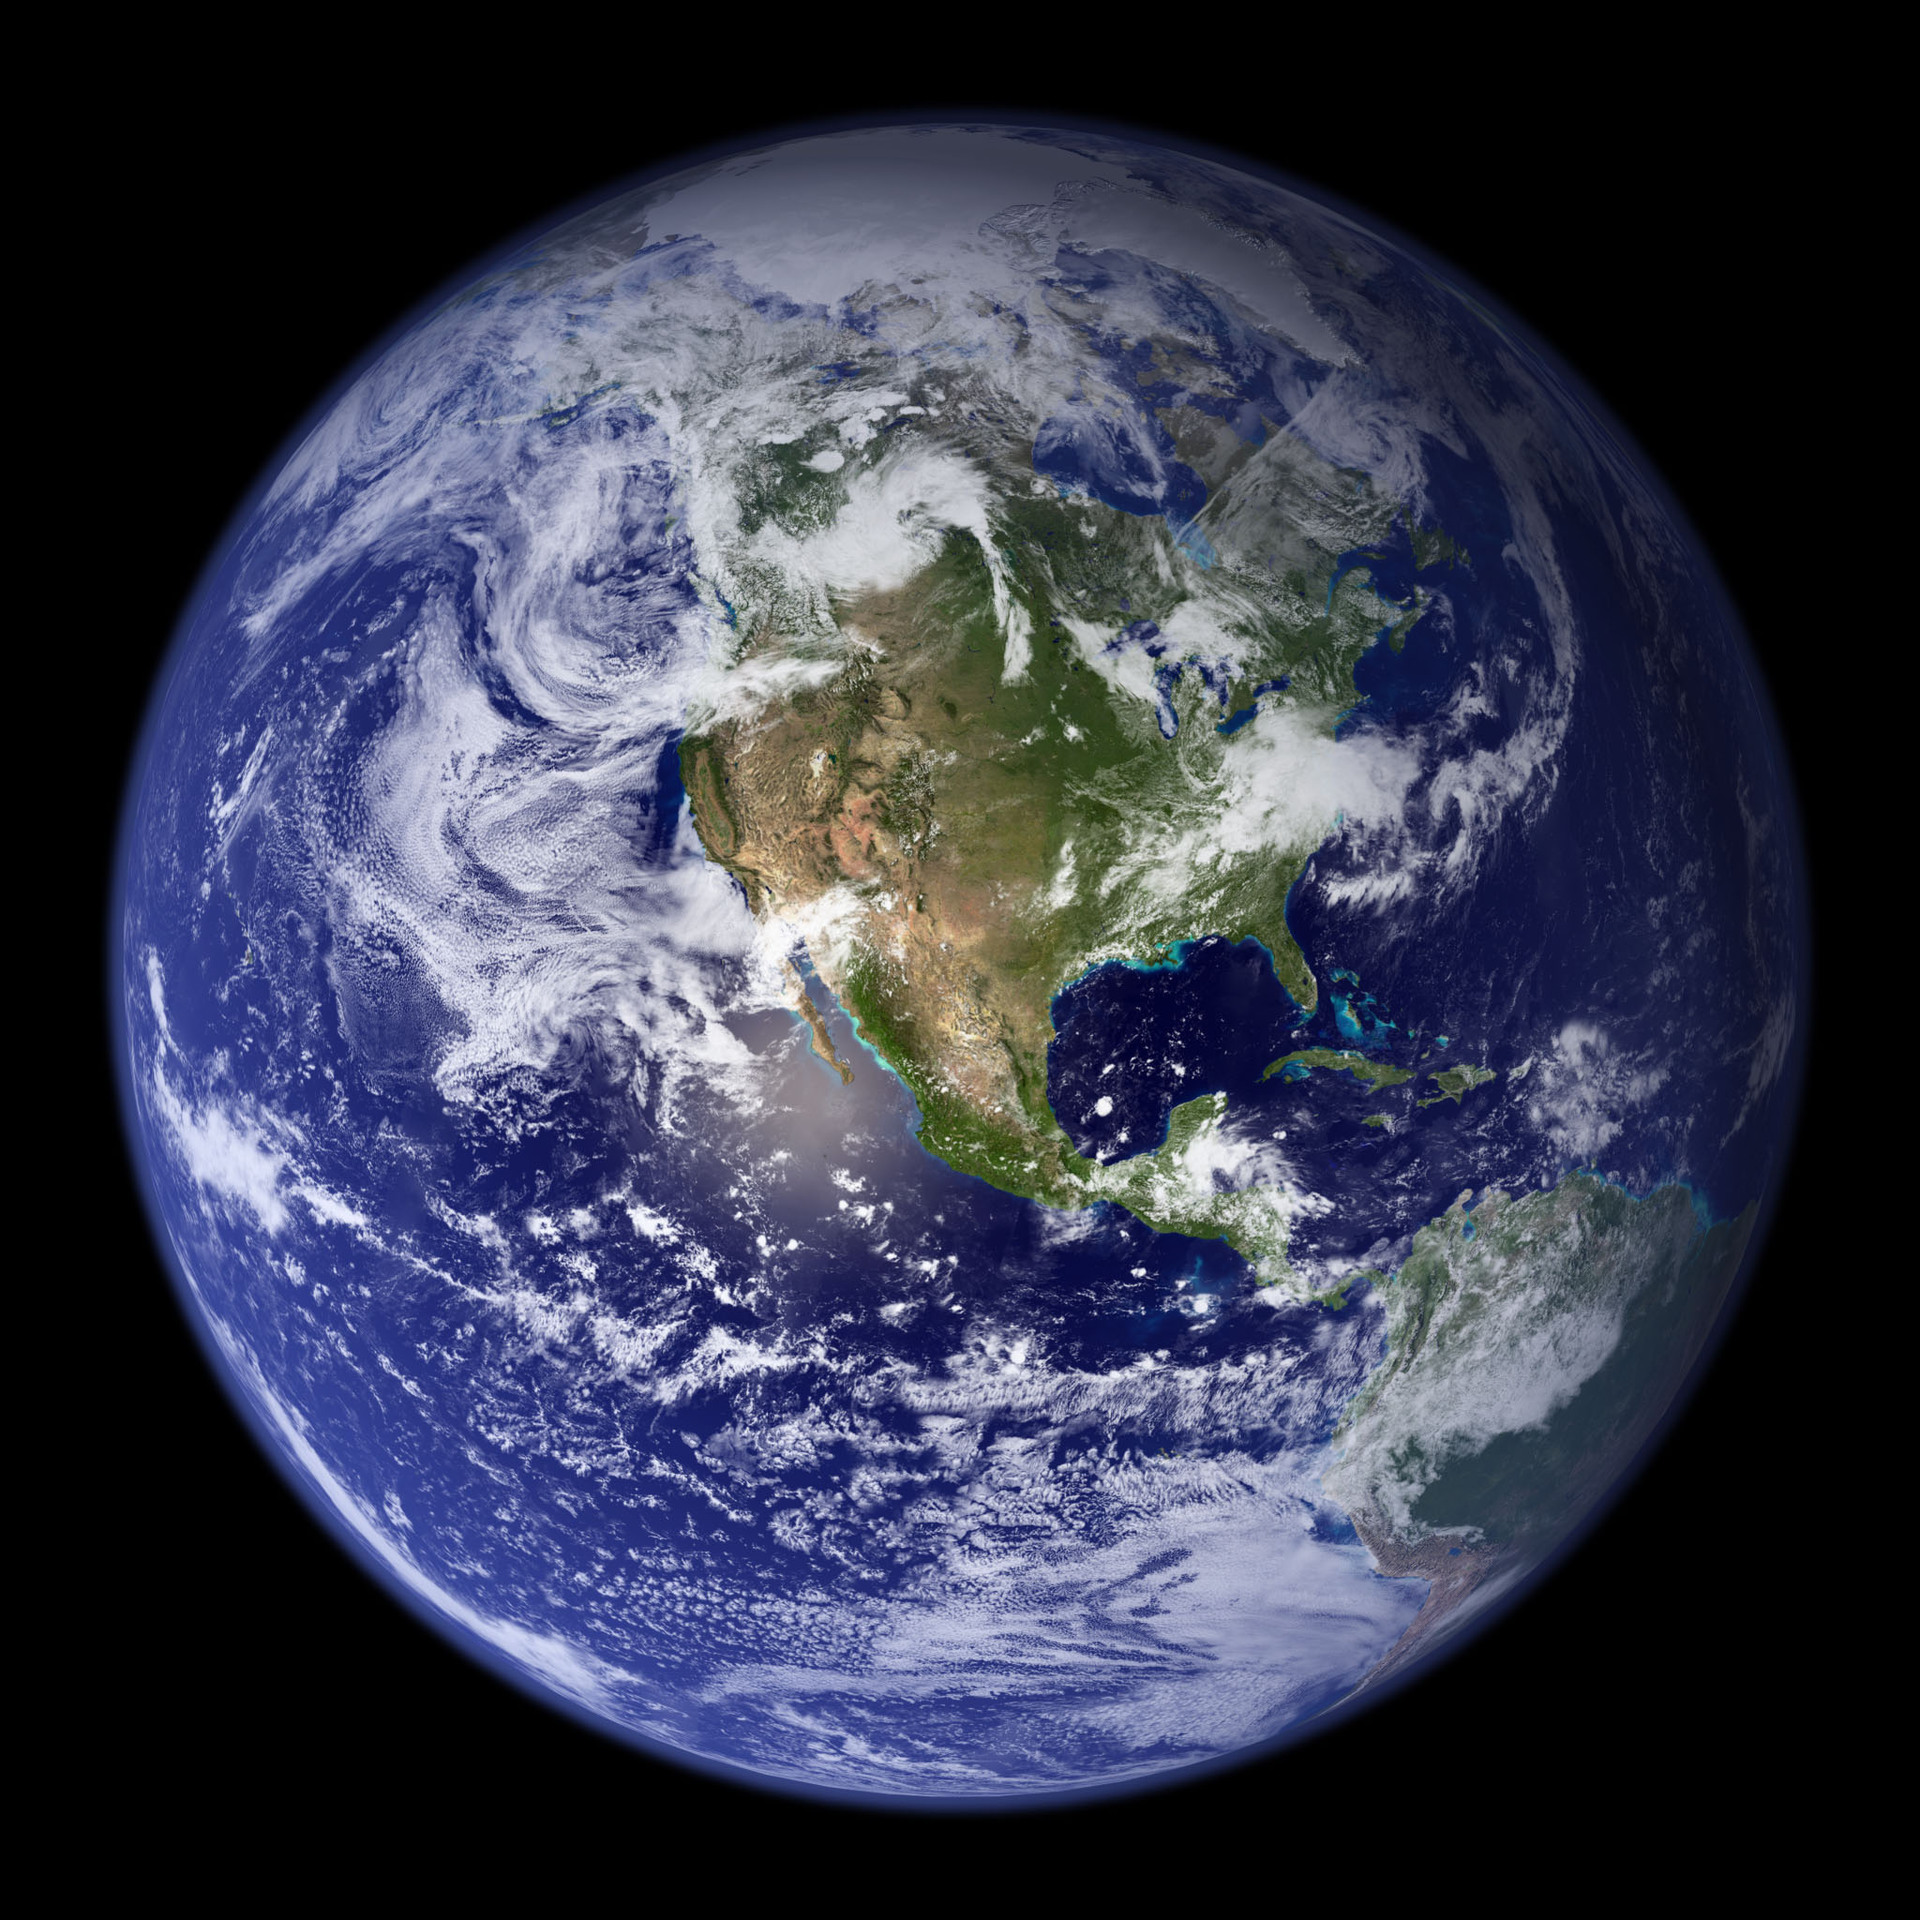
Western Hemisphere Blue Marble, created in 2002
The ridge runs up the spine of the Antarctic Peninsula, while the ice shelves frame it on both sides. Since the beginning of 2002, for several months, the MODIS instrument on board the Terra has observed one of the moments of the destruction and disappearance of ice shelves, giving scientists and the world the opportunity to observe this dramatic phenomenon from a bird's eye view. In January, the surface of the Larsen ice shelf went rippling , began to form accumulations of water from the melting ice. In mid-February, the front edge of the ice shelf retreated by about six miles, and large icebergs began to split off and float far into the sea. March 7, 2002 the shelf was already completely destroyed.
Destruction of the Larsen Ice Shelf in Antarctica, from January 31 to April 13, 2002
Detection of gas molecules of ozone, determining their location in the atmosphere requires going beyond the edge of the Earth's disk. From orbit, the edge of the Earth’s disk appears to be a fuzzy blue halo that shines above the surface. Tools such as Microwave Limb Sounder (MLS) onboard the Aura satellite allow you to observe the edge of the Earth's disk. As a result, the Earth’s atmosphere is viewed from the side, down to where it is thinned into space. This perspective allows scientists to measure the chemical composition of the Earth’s atmosphere layer by layer. This is important for monitoring gases that contribute to the formation of holes in the ozone layer and, with regard to the assessment of the effects on clouds, on climate change. With the help of Microwave Limb Sounder, all cosmic gases that participate in the ozone layer destruction cycle were measured for the first time, giving scientists the first information that can be used to simulate the entire process of ozone layer destruction.

MLS measurements of the low stratospheric layers: temperatures and concentrations of H2O, O3, ClO, BrO, HCl, OH, HO2, HNO3, HCN and N2O, their effects on the depletion of the ozone layer, the transformation of greenhouse gases and radiative forcing on climate change
From the satellite you can get photos of the Earth, showing where trees and plants grow. But data from satellite instruments can tell us even more information, for example, how much carbon dioxide plants absorb from the atmosphere during photosynthesis. MODIS hyperspectral systems onboard Aqua and Terra measure carbon absorption, which allows scientists to compare plant productivity around the world. The animation shows this cycle throughout the year, reflecting the seasonal growth and decline of green vegetation on the planet. Dark shades of green show a higher carbon absorption rate.
One year of the global cycle of vegetation on Earth. Seasonal variations can be seen in different parts of the world.
The main reason for the decline of summer sea ice in the Arctic is the loss of a white reflective surface, which reflects the energy of the sun back into space. Therefore, the ice melts and exposes the dark ocean waters that absorb solar energy, potentially causing warming in the Arctic, where temperatures have risen two to three times faster in recent decades than anywhere else on the planet. CERES (Clouds and the Earth's Radiant Energy Systems) is a tool aboard Terra and Aqua, which continues to measure the amount of solar radiation absorbed by the Earth since 2000. In the Arctic, this figure increased by 5% - a number that may not seem so large, except that the absorption rate practically did not change throughout the rest of the globe, and no other region on earth showed such changes.
The animation shows the change in sea ice and the absorption of solar radiation during the summer months in the Arctic between 2000 and 2014. The blue color indicates the places where sea ice has decreased; the red color indicates where the absorption of solar radiation has increased over the past 15 years
We may be surprised by the fact that in many parts of the United States, air quality has improved in recent years. As the appearance of new cars, tightened regulations on emissions on the roads. At the same time, industry and power plants adhere to strict pollution limits. Some of the major pollutants that can cause health problems have decreased significantly over the past 15 years. In recent years, NASA scientists have figured out how to measure the concentration of a single pollutant, nitrogen dioxide, using the OMI tool onboard the Aura satellite. See a visualization showing how air quality in the United States has improved from 2005 to 2011.

Nitrogen dioxide pollution decreased from 2005-2011 throughout the United States
Every year about a third of the Earth’s land surface is touched by fire. We did not know this fact until MODIS, a tool onboard the Terra and Aqua satellites, did not begin to scan the Earth four times a day in order to determine each fiery point on the planet. In the fifteen years since the creation of the global fire map, they have observed over 40 million active fires. The map has played a revolutionary role in the understanding of scientists where fires occur and how they affect ecosystems. It turned out that the gas released into the atmosphere contributes to climate change, deterioration of air quality, and this affects human health. In real time, a fire map is one of the most sought-after firefighting products in the United States and around the world.
African fires during 2006 (shown in red)
The sensors onboard the Terra and Aqua satellites can not only detect the heat emanating from forest fires, but also “calculate” the number of active fires around the world at any given time. They provide snapshots of active fires and measurements of their smoke plumes. Views on fire from space have now become commonplace, but sensors in addition provide scientists with real data on how far the smoke spreads from the source and how high it rises in the atmosphere. The MISR (Multi-angle Imaging Spectroradiometer) tool onboard the Terra satellite was instrumental in gaining additional information about: how a forest fire provokes plumes of smoke; how smoke plumes penetrate the upper atmosphere; how feathers of smoke mingle with clouds.

Column of smoke from a fire in California on August 23, 2013
Aqua was not the first satellite to explore sea ice from space. But with the help of it, high-quality data were obtained for the first time, which allowed scientists to see the Arctic ice cap (the floating sea-ice layer is larger than the entire continental part of the USA) moving and changing from day to day. Sea ice shrinks in summer and expands in winter — and every day, during this cycle, it takes on different forms. With the help of the AMSR-E tool on board Aqua you can see how beautiful this sight is.
Sea ice floats on the ocean surface, increasing and decreasing depending on the season. The following period: September 4, 2009 - January 30, 2011. Satellite observations show: the total mass of sea ice has decreased over the past 15 years due to climate change.
Ground-based sensors show that in the northern hemisphere the carbon dioxide content in the atmosphere increases and decreases depending on the time of year. This cycle is associated with the photosynthetic activity of plants, trees and phytoplankton. But without a global view from the satellite, we would never have seen a picture of how these oscillations would look. The AIRS tool onboard Aqua measures carbon dioxide concentrations several thousand feet above the surface. And the visualization of this data gives an idea of how exactly greenhouse gases are distributed throughout the world, and how their concentration varies with the season.
Average annual carbon dioxide data are shown in yellow (using AIRS); over them, vegetation data is shown in green (using MODIS)
The effect on climate change of clouds and small suspended particles, called aerosols, has not yet been studied. Some clouds reflect the sun's rays, while others absorb them. Some aerosols scatter light and cause a cooling effect, while others absorb light and cause a heating effect. Aerosols can also dissipate clouds, which further complicates the picture. Scientists have used MODIS tools on Terra and Aqua to begin continuous long-term observation of clouds and aerosols, which ultimately will help the scientific community better understand their secrets. In recent years, other NASA satellites (besides Terra and Aqua) have been launched to explore additional types of clouds and aerosols using various types of instruments.

Plumes of dust from Iran, Afghanistan and Pakistan spread to the south through the Arabian Sea, December 28, 2012
Researchers have long advanced and mapped the terrain of uncharted territories, making detailed topographic maps of mountains, rivers, hills and plains. The global digital elevation model ( Global Digital Elevation Model ), produced by an advanced satellite radiometer for thermal radiation and reflection ( ASTER - Advanced Spaceborne Thermal Emission and Reflection Radiometer), a tool on board the Terra, takes it to a whole new level. ASTER collects pairs of images with a slight displacement of the earth's surface. Small image displacements provide depth information and allow scientists to visualize the terrain of the Earth in 3D. The first Global Digital Terrain Model was released in 2009. It consisted of 1.3 million scenes of the earth’s surface stitched together. I have never been able to cover such a large number of fragments. It was the highest resolution topographic map that covered 90 percent of the Earth’s surface. Scientists use relief data to understand how the Earth changes over time, especially from natural disasters such as landslides, earthquakes, floods, and tsunamis.
 NASA and the Ministry of Economy, Trade and Industry of Japan released the Global Digital Elevation Model on June 29, 2009.

Los Angeles in the north is bordered by a chain of mountains of San Gabriel
When tiny plants in the ocean begin to bloom, they spread hundreds of kilometers. Phytoplankton blooms around the world account for about half of all photosynthesis on Earth and are the main link in taking carbon from the atmosphere and transferring it to the ocean. With the phytoplankton bloom, a huge number of fish and marine mammals that feed on this type of food gather in one place, and this fact indirectly supports their population. Daily observations of the color of the ocean using MODIS instruments aboard the Terra and Aqua satellites dramatically changed the understanding of scientists of the complex biological and physical relationships between phytoplankton, marine ecosystems and the global carbon stock.

Phytoplankton bloom off the coast of Iceland, June 24, 2010
Carbon monoxide is a colorless and odorless pollutant from fires, vehicle tailpipes and other anthropogenic sources. Once in the atmosphere, this pollutant contributes to the formation of smog, sometimes thousands of kilometers from the place of the original occurrence. Carbon monoxide is part of the ingredients for ground-level ozone - a harmful pollutant. The Terra has an MOPITT instrument for measuring pollutants in the troposphere. MOPITT was the first device to track carbon monoxide sources around the world. According to data collected from MOPITT, AIRS devices, as well as from data collected from European satellites, scientists found that carbon monoxide emissions are decreasing at a rate of 1% per year since 2000.

Average monthly concentration of carbon monoxide in the troposphere at an altitude of about 12,000 feet, in April 2000 (left) and in April 2014
The 1987 Montreal Protocol bans the use of ozone-depleting substances. This was a momentous moment for the international community, prompting them to come together and solve a serious environmental threat. The ozone layer in the stratosphere acts as a sunscreen for the Earth, protecting all life on the surface from harmful solar radiation. Satellite measurements of stratospheric ozone were important for monitoring the seasonal occurrence of an ozone hole over Antarctica. Continuing the measurements started by NOAA satellites, the OMI tool on the Aura satellite witnessed some signs that signal holes in the ozone layer are on the way to recovery.
The minimum concentration of ozone over Antarctica from 1979 to 2013
NASA, as well as other space agencies, launched satellites to explore the Earth before. But the last 15 years have produced a more comprehensive look at the Earth from space than any other period in history. At a time when our planet is undergoing critical changes, this global view offers not only stunning pictures, but also vital information about how the Earth is changing.
In order to celebrate 15 years of successful operation of the Earth observation system, NASA collected 15 impressive and interesting images collected by three NASA orbiting satellites.
')
1. Blue Marble 2002 (Blue Marble 2002)
Getting a complete photograph of the Earth from space requires a complex sequence of actions. In 1972, the Apollo 17 crew took a camera to the moon in order to get a picture with a full image of the earth's sphere in sight. In 2002, NASA scientists and visualizers stitched together the results of long months of observation of the earth’s surface, oceans, sea ice and clouds into a true-color mosaic without any seams using the MODIS (Moderate-resolution Imaging Spectroradiometer) scanning spectroradiometer, tool on board terra. They added a layer of clouds to create the final composition Blue Marble , which has become one of the most iconic images of the Earth of the new century. In 2007, Apple chose Blue Marble as the default background for the iPhone. The MODIS Blue Marble version is currently used as the base layer for many NASA Earth data visualizations.
Western Hemisphere Blue Marble, created in 2002
2. The destruction of the ice shelf
The ridge runs up the spine of the Antarctic Peninsula, while the ice shelves frame it on both sides. Since the beginning of 2002, for several months, the MODIS instrument on board the Terra has observed one of the moments of the destruction and disappearance of ice shelves, giving scientists and the world the opportunity to observe this dramatic phenomenon from a bird's eye view. In January, the surface of the Larsen ice shelf went rippling , began to form accumulations of water from the melting ice. In mid-February, the front edge of the ice shelf retreated by about six miles, and large icebergs began to split off and float far into the sea. March 7, 2002 the shelf was already completely destroyed.
Destruction of the Larsen Ice Shelf in Antarctica, from January 31 to April 13, 2002
3. Ozone measurements at disc edge
Detection of gas molecules of ozone, determining their location in the atmosphere requires going beyond the edge of the Earth's disk. From orbit, the edge of the Earth’s disk appears to be a fuzzy blue halo that shines above the surface. Tools such as Microwave Limb Sounder (MLS) onboard the Aura satellite allow you to observe the edge of the Earth's disk. As a result, the Earth’s atmosphere is viewed from the side, down to where it is thinned into space. This perspective allows scientists to measure the chemical composition of the Earth’s atmosphere layer by layer. This is important for monitoring gases that contribute to the formation of holes in the ozone layer and, with regard to the assessment of the effects on clouds, on climate change. With the help of Microwave Limb Sounder, all cosmic gases that participate in the ozone layer destruction cycle were measured for the first time, giving scientists the first information that can be used to simulate the entire process of ozone layer destruction.
MLS measurements of the low stratospheric layers: temperatures and concentrations of H2O, O3, ClO, BrO, HCl, OH, HO2, HNO3, HCN and N2O, their effects on the depletion of the ozone layer, the transformation of greenhouse gases and radiative forcing on climate change
4. Global Vegetation Cycle
From the satellite you can get photos of the Earth, showing where trees and plants grow. But data from satellite instruments can tell us even more information, for example, how much carbon dioxide plants absorb from the atmosphere during photosynthesis. MODIS hyperspectral systems onboard Aqua and Terra measure carbon absorption, which allows scientists to compare plant productivity around the world. The animation shows this cycle throughout the year, reflecting the seasonal growth and decline of green vegetation on the planet. Dark shades of green show a higher carbon absorption rate.
One year of the global cycle of vegetation on Earth. Seasonal variations can be seen in different parts of the world.
5. Arctic warming
The main reason for the decline of summer sea ice in the Arctic is the loss of a white reflective surface, which reflects the energy of the sun back into space. Therefore, the ice melts and exposes the dark ocean waters that absorb solar energy, potentially causing warming in the Arctic, where temperatures have risen two to three times faster in recent decades than anywhere else on the planet. CERES (Clouds and the Earth's Radiant Energy Systems) is a tool aboard Terra and Aqua, which continues to measure the amount of solar radiation absorbed by the Earth since 2000. In the Arctic, this figure increased by 5% - a number that may not seem so large, except that the absorption rate practically did not change throughout the rest of the globe, and no other region on earth showed such changes.
The animation shows the change in sea ice and the absorption of solar radiation during the summer months in the Arctic between 2000 and 2014. The blue color indicates the places where sea ice has decreased; the red color indicates where the absorption of solar radiation has increased over the past 15 years
6. Clean Breath in the USA
We may be surprised by the fact that in many parts of the United States, air quality has improved in recent years. As the appearance of new cars, tightened regulations on emissions on the roads. At the same time, industry and power plants adhere to strict pollution limits. Some of the major pollutants that can cause health problems have decreased significantly over the past 15 years. In recent years, NASA scientists have figured out how to measure the concentration of a single pollutant, nitrogen dioxide, using the OMI tool onboard the Aura satellite. See a visualization showing how air quality in the United States has improved from 2005 to 2011.
Nitrogen dioxide pollution decreased from 2005-2011 throughout the United States
7. Burning Planet
Every year about a third of the Earth’s land surface is touched by fire. We did not know this fact until MODIS, a tool onboard the Terra and Aqua satellites, did not begin to scan the Earth four times a day in order to determine each fiery point on the planet. In the fifteen years since the creation of the global fire map, they have observed over 40 million active fires. The map has played a revolutionary role in the understanding of scientists where fires occur and how they affect ecosystems. It turned out that the gas released into the atmosphere contributes to climate change, deterioration of air quality, and this affects human health. In real time, a fire map is one of the most sought-after firefighting products in the United States and around the world.
African fires during 2006 (shown in red)
8. Smoke plumes from space
The sensors onboard the Terra and Aqua satellites can not only detect the heat emanating from forest fires, but also “calculate” the number of active fires around the world at any given time. They provide snapshots of active fires and measurements of their smoke plumes. Views on fire from space have now become commonplace, but sensors in addition provide scientists with real data on how far the smoke spreads from the source and how high it rises in the atmosphere. The MISR (Multi-angle Imaging Spectroradiometer) tool onboard the Terra satellite was instrumental in gaining additional information about: how a forest fire provokes plumes of smoke; how smoke plumes penetrate the upper atmosphere; how feathers of smoke mingle with clouds.
Column of smoke from a fire in California on August 23, 2013
9. Sea ice movement
Aqua was not the first satellite to explore sea ice from space. But with the help of it, high-quality data were obtained for the first time, which allowed scientists to see the Arctic ice cap (the floating sea-ice layer is larger than the entire continental part of the USA) moving and changing from day to day. Sea ice shrinks in summer and expands in winter — and every day, during this cycle, it takes on different forms. With the help of the AMSR-E tool on board Aqua you can see how beautiful this sight is.
Sea ice floats on the ocean surface, increasing and decreasing depending on the season. The following period: September 4, 2009 - January 30, 2011. Satellite observations show: the total mass of sea ice has decreased over the past 15 years due to climate change.
10. Fluctuations in carbon dioxide
Ground-based sensors show that in the northern hemisphere the carbon dioxide content in the atmosphere increases and decreases depending on the time of year. This cycle is associated with the photosynthetic activity of plants, trees and phytoplankton. But without a global view from the satellite, we would never have seen a picture of how these oscillations would look. The AIRS tool onboard Aqua measures carbon dioxide concentrations several thousand feet above the surface. And the visualization of this data gives an idea of how exactly greenhouse gases are distributed throughout the world, and how their concentration varies with the season.
Average annual carbon dioxide data are shown in yellow (using AIRS); over them, vegetation data is shown in green (using MODIS)
11. Secrets of clouds and aerosols
The effect on climate change of clouds and small suspended particles, called aerosols, has not yet been studied. Some clouds reflect the sun's rays, while others absorb them. Some aerosols scatter light and cause a cooling effect, while others absorb light and cause a heating effect. Aerosols can also dissipate clouds, which further complicates the picture. Scientists have used MODIS tools on Terra and Aqua to begin continuous long-term observation of clouds and aerosols, which ultimately will help the scientific community better understand their secrets. In recent years, other NASA satellites (besides Terra and Aqua) have been launched to explore additional types of clouds and aerosols using various types of instruments.
Plumes of dust from Iran, Afghanistan and Pakistan spread to the south through the Arabian Sea, December 28, 2012
12. Topographic maps
Researchers have long advanced and mapped the terrain of uncharted territories, making detailed topographic maps of mountains, rivers, hills and plains. The global digital elevation model ( Global Digital Elevation Model ), produced by an advanced satellite radiometer for thermal radiation and reflection ( ASTER - Advanced Spaceborne Thermal Emission and Reflection Radiometer), a tool on board the Terra, takes it to a whole new level. ASTER collects pairs of images with a slight displacement of the earth's surface. Small image displacements provide depth information and allow scientists to visualize the terrain of the Earth in 3D. The first Global Digital Terrain Model was released in 2009. It consisted of 1.3 million scenes of the earth’s surface stitched together. I have never been able to cover such a large number of fragments. It was the highest resolution topographic map that covered 90 percent of the Earth’s surface. Scientists use relief data to understand how the Earth changes over time, especially from natural disasters such as landslides, earthquakes, floods, and tsunamis.
NASA and the Ministry of Economy, Trade and Industry of Japan released the Global Digital Elevation Model on June 29, 2009.Los Angeles in the north is bordered by a chain of mountains of San Gabriel
13. Plankton dance
When tiny plants in the ocean begin to bloom, they spread hundreds of kilometers. Phytoplankton blooms around the world account for about half of all photosynthesis on Earth and are the main link in taking carbon from the atmosphere and transferring it to the ocean. With the phytoplankton bloom, a huge number of fish and marine mammals that feed on this type of food gather in one place, and this fact indirectly supports their population. Daily observations of the color of the ocean using MODIS instruments aboard the Terra and Aqua satellites dramatically changed the understanding of scientists of the complex biological and physical relationships between phytoplankton, marine ecosystems and the global carbon stock.
Phytoplankton bloom off the coast of Iceland, June 24, 2010
14. Carbon Monoxide (Carbon Monoxide) Imaging
Carbon monoxide is a colorless and odorless pollutant from fires, vehicle tailpipes and other anthropogenic sources. Once in the atmosphere, this pollutant contributes to the formation of smog, sometimes thousands of kilometers from the place of the original occurrence. Carbon monoxide is part of the ingredients for ground-level ozone - a harmful pollutant. The Terra has an MOPITT instrument for measuring pollutants in the troposphere. MOPITT was the first device to track carbon monoxide sources around the world. According to data collected from MOPITT, AIRS devices, as well as from data collected from European satellites, scientists found that carbon monoxide emissions are decreasing at a rate of 1% per year since 2000.
Average monthly concentration of carbon monoxide in the troposphere at an altitude of about 12,000 feet, in April 2000 (left) and in April 2014
15. Recovery of the ozone layer
The 1987 Montreal Protocol bans the use of ozone-depleting substances. This was a momentous moment for the international community, prompting them to come together and solve a serious environmental threat. The ozone layer in the stratosphere acts as a sunscreen for the Earth, protecting all life on the surface from harmful solar radiation. Satellite measurements of stratospheric ozone were important for monitoring the seasonal occurrence of an ozone hole over Antarctica. Continuing the measurements started by NOAA satellites, the OMI tool on the Aura satellite witnessed some signs that signal holes in the ozone layer are on the way to recovery.
The minimum concentration of ozone over Antarctica from 1979 to 2013
Source: https://habr.com/ru/post/364823/
All Articles