Oil tube
The ruble is falling, oil is getting cheaper. It has already become a habit to look in and admire graphs on Yandex: RUR / USD and USD / BAR . Naturally, at some point it became interesting in what proportion it happens - what is getting cheaper faster? Simple multiplication, and voila - the cost of BAR / RUB. In general, it turns out that it seems like a barrel in rubles is in place.
And then, of course, I wanted to see long-term statistics. Yandex explicitly on api does not provide this data, but it gives simple xml to its graphs. Therefore - Sinatra, Bootstrap, Chart.js and Heroku.
')
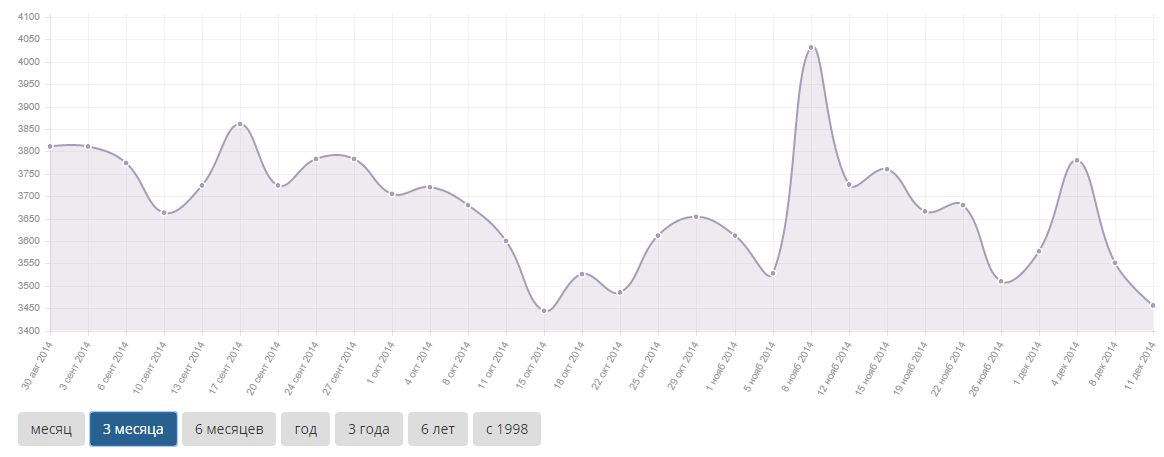
The most significant - fluctuations of about 3,600 rubles for the last insane 3 months. Sharp surges - the lag of the ruble exchange rate from changes in the cost of oil. Just here frolics speculators)

At a larger interval it can be seen that the current price of oil in rubles has been kept since 2011.
It is also interesting that during the crisis of 2008 the ruble was not so rigidly tied to the cost of oil, as it is now. On the other hand, the principle was the same - the oil price changes first, and then, with a delay, the ruble is catching up.
Such is the simple analyst.
The application itself: http://rubbar.herokuapp.com/ .
PS So, congratulations, comrades, this button accordion is relevant today as never before:

I just catch myself recounting how many barrels of oil I left in the supermarket, and presenting coins with cans and bills in one, half and a quarter of a barrel - since we are so attached to them.
UPD:
And then, of course, I wanted to see long-term statistics. Yandex explicitly on api does not provide this data, but it gives simple xml to its graphs. Therefore - Sinatra, Bootstrap, Chart.js and Heroku.
')
The most significant - fluctuations of about 3,600 rubles for the last insane 3 months. Sharp surges - the lag of the ruble exchange rate from changes in the cost of oil. Just here frolics speculators)
At a larger interval it can be seen that the current price of oil in rubles has been kept since 2011.
It is also interesting that during the crisis of 2008 the ruble was not so rigidly tied to the cost of oil, as it is now. On the other hand, the principle was the same - the oil price changes first, and then, with a delay, the ruble is catching up.
Such is the simple analyst.
The application itself: http://rubbar.herokuapp.com/ .
PS So, congratulations, comrades, this button accordion is relevant today as never before:
I just catch myself recounting how many barrels of oil I left in the supermarket, and presenting coins with cans and bills in one, half and a quarter of a barrel - since we are so attached to them.
UPD:
A little bit about how the application was written and how it works inside.
Everything is quite simple, but since there is interest, I supplement the article.
At first it was necessary to catch how data comes from Yandex. It turned out two XML-ki: graph_1.xml and graph_1006.xml . This is all the data that will be used.
Since I myself am engaged in development on Ruby, I took the lightweight framework Sinatra as a basis, connected the Slim templating system for a single view. Two actions - one renders a template (tied to the site root), and the second returns json with the data for the chart . To generate json, I took the oj gem, and for parsing xml, I took ox .
The original data, of course, turned out to be different time stamps (the ruble / dollar and dollar / barrel rates are not updated synchronously), so the nearest update of the ruble exchange rate to the barrel update in question is taken.
It turned out that the json-ki request takes a noticeable amount of time - primarily due to two requests to Yandex. Therefore, the result wanted to cache. Moreover, the data from Yandex will be updated twice a day. Having studied the possibilities of Heroku on a free account, I was delighted with a bunch of cloud options Redis and Memcache from 5 to 25 MB, which is much more than the required amount. But it turned out that they are provided only after entering data on a credit card, which is somewhat alarming - there is a suspicion that the money will be written off if you exceed the free volume. And I wanted to pour in - and not think. Therefore, a class has been filed, with the proud name StupidCache . The point is that the application on Sinatra is resident in memory, and therefore the static class attributes are stored between requests. All controller code turned out like this:
At first there were thoughts to request data for certain time intervals, but considering the size of the resulting json <100KB, I decided that you can always give everything entirely - besides, you can change ranges without reloading the page.
Left the interface itself. For the assembly, I took bower , pulled out bootstrap, jquery, fontawesome and chartjs (then switched, though jquery and fontawesome to CDN, and fontawesome itself was useful only for the github icon in the basement).
Special magic had to deal only with chartjs. Chartjs is quite handy:
What is in the application is almost a configuration out of the box, except for one trouble: if you run the above code again (and this is necessary to switch between periods), then the graphs overlap each other. The problem was successfully crutched with this line before redrawing:
Another trifle: the data for the month fits well on the screen, i.e. 30 points. A few thousand people slow down and look bad. Therefore, we skip the counts so that the points are from 30 to 59:
And the last - on Heroku, about which there is a decent amount of articles on Habré.
For production, it is better to get rid of the standard WEBrick and use the smart multi-threaded Puma. Although Heroku and recommends Unicorn, but on a free account, so even with requests for third-party services Puma should feel much more comfortable. To do this, simply add the gem 'puma' to the gemfile. A Procfile has been added for the order, although without it Heroku runs everything.
For the deployment itself, we register the account, set up their console utility, log in through it, commit the project to git, git push heroku.
A curtain.
GitHab Code
At first it was necessary to catch how data comes from Yandex. It turned out two XML-ki: graph_1.xml and graph_1006.xml . This is all the data that will be used.
Since I myself am engaged in development on Ruby, I took the lightweight framework Sinatra as a basis, connected the Slim templating system for a single view. Two actions - one renders a template (tied to the site root), and the second returns json with the data for the chart . To generate json, I took the oj gem, and for parsing xml, I took ox .
The original data, of course, turned out to be different time stamps (the ruble / dollar and dollar / barrel rates are not updated synchronously), so the nearest update of the ruble exchange rate to the barrel update in question is taken.
It turned out that the json-ki request takes a noticeable amount of time - primarily due to two requests to Yandex. Therefore, the result wanted to cache. Moreover, the data from Yandex will be updated twice a day. Having studied the possibilities of Heroku on a free account, I was delighted with a bunch of cloud options Redis and Memcache from 5 to 25 MB, which is much more than the required amount. But it turned out that they are provided only after entering data on a credit card, which is somewhat alarming - there is a suspicion that the money will be written off if you exceed the free volume. And I wanted to pour in - and not think. Therefore, a class has been filed, with the proud name StupidCache . The point is that the application on Sinatra is resident in memory, and therefore the static class attributes are stored between requests. All controller code turned out like this:
get '/chart/rub_bar.json' do result_json = StupidCache.fetch :rub_bar do # , Oj.dump ChartModel.get_rub_bar, mode: :compat end content_type 'application/json' result_json end At first there were thoughts to request data for certain time intervals, but considering the size of the resulting json <100KB, I decided that you can always give everything entirely - besides, you can change ranges without reloading the page.
Left the interface itself. For the assembly, I took bower , pulled out bootstrap, jquery, fontawesome and chartjs (then switched, though jquery and fontawesome to CDN, and fontawesome itself was useful only for the github icon in the basement).
Special magic had to deal only with chartjs. Chartjs is quite handy:
var data = { labels: labels, //, ajax datasets: [ { /* */ data: values //, ajax } ] }; var ctx = $("#oil_chart").get(0).getContext("2d"); // #oil_chart - canvas new Chart(ctx).Line(data, { /* */ }); What is in the application is almost a configuration out of the box, except for one trouble: if you run the above code again (and this is necessary to switch between periods), then the graphs overlap each other. The problem was successfully crutched with this line before redrawing:
$("#oil_chart").replaceWith('<canvas id="oil_chart" height="400"></canvas>'); Another trifle: the data for the month fits well on the screen, i.e. 30 points. A few thousand people slow down and look bad. Therefore, we skip the counts so that the points are from 30 to 59:
var skip = Math.floor(values_all.length/30); skip = skip < 1 ? 1 : skip; var values = []; for (var i = 0; i < values_all.length; i = i + skip) { values.push(values_all[i]); } And the last - on Heroku, about which there is a decent amount of articles on Habré.
For production, it is better to get rid of the standard WEBrick and use the smart multi-threaded Puma. Although Heroku and recommends Unicorn, but on a free account, so even with requests for third-party services Puma should feel much more comfortable. To do this, simply add the gem 'puma' to the gemfile. A Procfile has been added for the order, although without it Heroku runs everything.
For the deployment itself, we register the account, set up their console utility, log in through it, commit the project to git, git push heroku.
A curtain.
GitHab Code
Source: https://habr.com/ru/post/364365/
All Articles