Intelligent Decision Support Systems - Brief Overview

Disclaimer
The purpose of writing this article was to make a brief overview of the principles of building Intellectual Decision Support Systems ( IPPC ), the role of machine learning, game theory, classical modeling and examples of their use in DSS. The purpose of the article is not to drill deep into the heavy theory of automata, self-learning machines, as well as BI tools.
Introduction
There are several ISPPR definitions that, in general, revolve around the same functionality. In general, ISPR is a system that assists decision makers (decision makers) in making these same decisions, using the tooling date of mining, modeling and visualization, has a friendly (G) UI, is stable in quality, is interactive and is flexible in settings .
')
Why do we need DSS :
- Difficulty in making decisions
- The need for an accurate assessment of various alternatives
- The need for predictive functionality
- The need for multi-stream input (for making a decision, we need conclusions based on data, expert assessments, known limitations, etc.)
The first DSS (then without I) grew from SPT (Transaction Processing Systems), in the mid 60s - early 70s. Then these systems did not have any interactivity, representing, in fact, a superstructure above the RDBMS, with some (not at all) functional numerical simulation. One of the first systems is DYNAMO, which was developed in the depths of MIT and was a system for simulating any processes based on historical transactions. After the IBM 360 mainframe entered the market, conditional commercial systems used in the defense industry, special services and scientific research institutes began to appear.
From the beginning of the 80s, it is already possible to talk about the formation of subclasses of DSS , such as MIS (Management Information System), EIS (Executive Information System), GDSS (Group Decision Support Systems), ODSS (Organization Decision Support Systems), etc. In fact, these systems were frameworks capable of working with data at different levels of the hierarchy (from individual to corporate), and inward any logic could be implemented. An example is the GADS (Gate Assignment Display System) developed by Texas Instruments for United Airlines, which made decisions in Field Operations - the appointment of gates, the determination of the optimal parking time, etc.
At the end of the 80s, PPPR (Advanced - Advanced) appeared, which allowed for a "what-if" analysis and used more advanced modeling tools.
Finally, from the mid-90s, ISPRS began to emerge , based on the tools of statistics and machine learning, game theory, and other complex modeling.
Diversity DSS
At the moment there are several ways to classify DSS, we describe 3 popular ones:
By scope
- Business and management (pricing, labor, products, strategy, etc.)
- Engineering (product design, quality control ...)
- Finance (loans and borrowings)
- Medicine (drugs, treatments, diagnosis)
- Environment
In terms of data / model (Stephen Altera technique)
- FDS (File Drawer Systems - systems for providing access to the necessary data)
- DAS (Data Analysis Systems - systems for quick data manipulation)
- AIS (Analysis Information Systems - data access systems according to the type of solution required)
- AFM (s) (Accounting & Financial models (systems) - financial impact calculation systems)
- RM (s) (Representation models (systems) - simulation systems, AnyLogic as an example)
- OM (s) (Optimization models (systems) - systems that solve optimization problems)
- SM (s) (Suggestion models (systems) - rule-based inference systems)
By type of toolkit used
- Model Driven - based on classic models (linear models, models of inventory management, transportation, financial, etc.)
- Data Driven - based on historical data
- Communication Driven - systems based on group decision-making by experts (systems for facilitating the exchange of opinions and the calculation of average expert values)
- Document Driven - essentially indexed (often multidimensional) document repository
- Knowledge Driven - suddenly, based on knowledge. What does the knowledge of both expert and machine-derived
I demand a mournful book! normal DSS
Despite such a variety of options for classifications, the requirements and attributes of the DSS fit well into 4 segments:
- Quality
- Organization
- Restrictions
- Model
In the diagram below we will show exactly which requirements and which segments to go to:

Separately, we note such important attributes as scalability (in the present agile approach nowhere without it), the ability to handle bad data, usability and user-friendly interface, and undemanding of resources.
Architecture and Design
There are several approaches to how to architecturally present DSS. Perhaps the best description of the difference in approaches is “who is in that much.” Despite the diversity of approaches, attempts are being made to create some kind of unified architecture, at least at the top level.
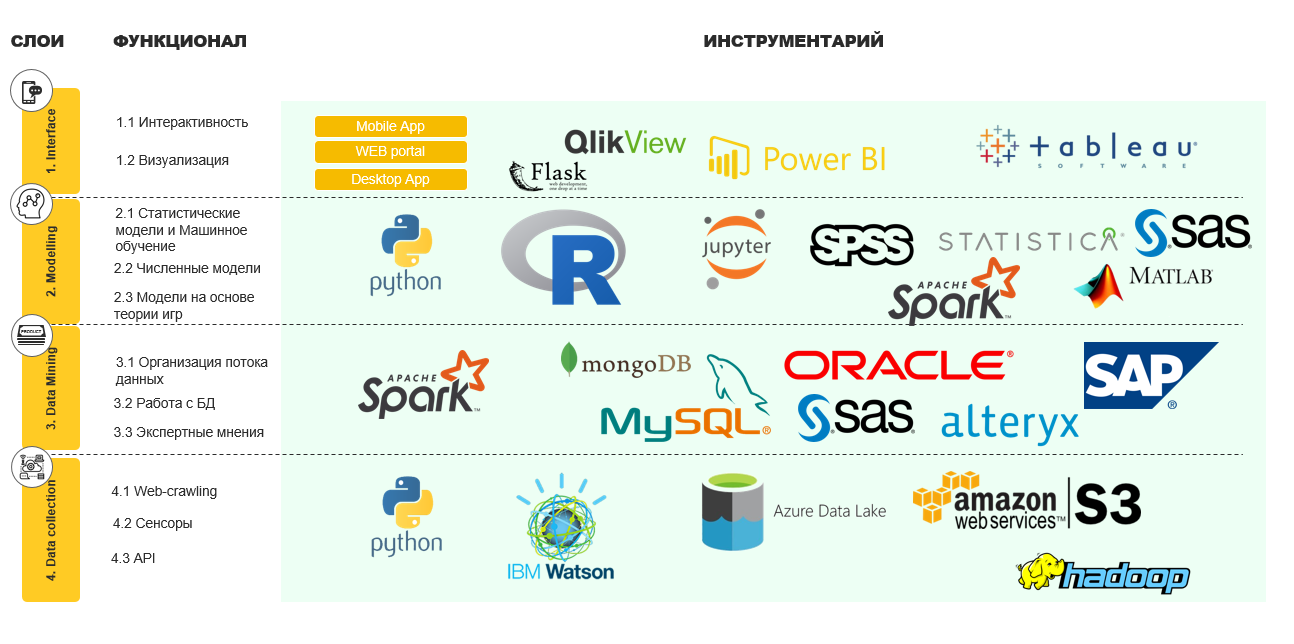
Indeed, the DSS can be quite divided into 4 large layers:
- Interface
- Modeling
- Data mining
- Data collection
And so you can cram any kind of tools into these layers.
On the diagram below, I present my vision of the architecture, with a description of the functional and examples of tools:
With the architecture more or less clear, we turn to the design and the actual construction of the DSS.
In principle, there is no rocket science. The following steps should be followed when constructing an IPPR:
- Domain analysis (in fact, where we will use our ISPR)
- Data collection
- Data analysis
- Model selection
- Expert analysis / interpretation of models
- Model implementation
- Evaluation of IPPC
- ISPP implementation
- Collect feedback ( at any stage , in fact)
On the diagram, it looks like this:

There are two ways to evaluate ISPR. First, the attribute matrix, which is presented above. Secondly, according to the criteria checklist, which can be any and depend on your specific task. As an example of such a checklist, I would cite the following:

I emphasize that this is only IMHO, and you can make a convenient check list for yourself.
And where is machine learning and game theory?
Yes, almost everywhere! At least in the layer associated with the simulation.
On the one hand, there are classic domains, let's call them “heavy”, such as supply chain management, production, inventories, and so on. In heavy domains, our favorite algorithms with you can add additional insights for proven classic models. Example: Predictive analytics on equipment outages (machine learning) will work perfectly with some FMEA analysis (classic).
On the other hand, in “easy” domains, such as client analytics, churn prediction, loan repayments, machine learning algorithms will be in the first place. And in scoring, for example, you can combine the classics with NLP, when we decide whether to issue a loan based on a package of documents (just the same document driven DSS).
Classic machine learning algorithms
Suppose we have a problem: the sales manager for steel products must, at the stage of receiving an application from the client, understand what quality finished products will go to the warehouse and apply some kind of control if the quality is lower than required.
We act very simply:
Step 0. Determine the target variable (well, for example, the content of titanium oxide in the finished product)
Step 1. Determine the data (download from SAP, Access, and generally from wherever we reach)
Step 2. Putting features / generators new
Step 3. We draw process data flow and we start it in production
Step 4. Choose and train the model, run it to spin on the server
Step 5. Define feature importances
Step 6. Determine the input of new data. Let our manager introduce them, for example, with his hands.
Step 7. We write on the knee a simple web-based interface, where the manager enters the values of important features with handles, it turns on a server with a model, and on the same interface spits out the predicted product quality
Woo-la, ISPR kindergarten level is ready, you can use.
Similar “simple” algorithms are also used by IBM in its Tivoli DSS, which allows you to determine the status of your supercomputers (Watson in the first place): based on the logs, information about the Watson performance is displayed, the availability of resources, the balance of cost vs profit, the need for maintenance, etc. are predicted. .P.
ABB offers its customers DSS800 for analyzing the operation of electric motors of the same ABB on the paper making line.
The Finnish Vaisala , the manufacturer of sensors for the Finnish Ministry of Transport, uses ISPPR to predict the periods during which it is necessary to use an anti-icer on the roads to avoid accidents.
Again, Finnish Foredata offers an ISPR for HR, which helps to make decisions on the candidate’s suitability for a position even at the resume selection stage.
At the Dubai airport in the cargo terminal there is a DSS, which determines the suspiciousness of the cargo. Under the hood, algorithms based on supporting documents and data entered by customs officers emit suspicious goods: the features of this are the country of origin, information on the packaging, specific information in the declaration fields, etc.
Conventional Neural Networks
In addition to simple ML, Deep Learning is also great in the DSS.
Some examples can be found in the military industrial complex, for example, in the American TACDSS (Tactical Air Combat Decision Support System). There neurons and evolutionary algorithms revolve inside, which help in defining one’s friend or foe, in estimating the likelihood of hitting a volley at that particular moment, and other tasks.
In a slightly more real world one can consider the following example: in the B2B segment, it is necessary to determine whether to issue a credit to an organization based on a package of documents. In B2C, the operator will torture you with questions on the phone, write down the values of the features in your system and announce the solution of the algorithm, in B2B it is more complicated.
An IPPC can be built there like this: a potential borrower brings a pre-agreed package of documents to the office (or sends scans by email, with signatures and seals, as expected), documents are fed to the OCR, then transferred to the NLP algorithm, which further divides the words into features and feeds them in NN. A client is asked to drink coffee (at best), or
Similar algorithms are also used in the Ministry of Foreign Affairs: a visa application form + other certificates are analyzed directly at the embassy / consulate, after which one of the 3 emoticons is displayed on the screen: green (issue a visa), yellow (there are questions), red (applicant in the stop list ). If you have ever received a visa in the United States, then the decision that the consulate officer voices to you is the result of the algorithm’s work in conjunction with the rules, and not his personal subjective opinion about you :)
In heavy domains, neuron-based DSS is also known, which determine the accumulation of buffer on production lines (see, for example , Tsadiras AK, Papadopoulos CT, O'Kelly MEJ (2013)) reliable production lines. Comput Ind Eng 66 (4): 1150–1162 ), Shared Min-Max Fuzzy Neural Networks (GFMMNN) for clustering water users ( Arsene CTC, Gabrys B, Al-Dabass D (2012) Decision support system theory of leakage detection, Expert Syst Appl 39 (18): 13214–13224 ) and others.
In general, it is worth noting that NN is the best suited for decision making under uncertainty, i.e. conditions in which the real business lives. Clustering algorithms also fit well.
Bayesian Networks
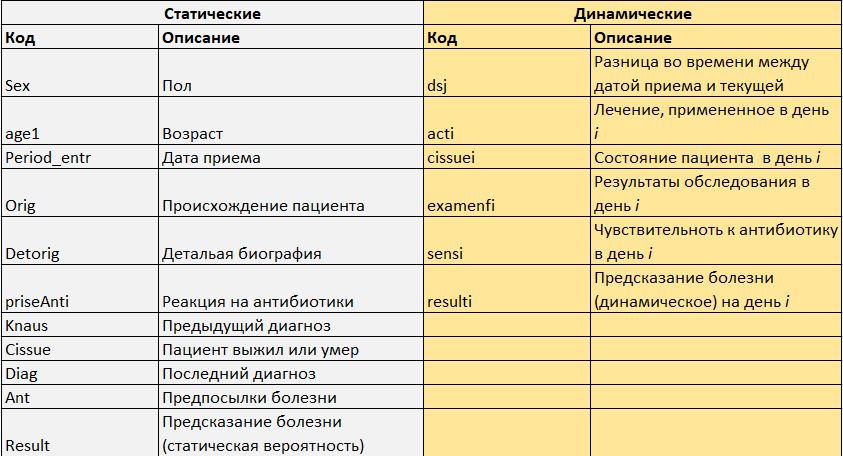
It sometimes happens that the data we have is heterogeneous by type of occurrence. We give an example from medicine. He came to us sick. We know something about him from the questionnaire (gender, age, weight, height, etc.) and anamnesis (endured heart attacks, for example). Let's call this data static. And we will learn something about it in the process of periodic examination and treatment (we measure temperature, blood composition, etc.) several times a day. We call this data dynamic. It is clear that a good DSS should be able to take into account all this data and make recommendations based on the entirety of the information.
Dynamic data is updated in time, respectively, the pattern of the model will be as follows: learning-decision-learning , which in general is similar to the work of a doctor: approximately determine the diagnosis, take a medicine, look at the reaction. Thus, we are constantly in a state of uncertainty whether the treatment will work or not. And the patient's condition changes dynamically. Those. we need to build a dynamic DSS, moreover, knowledge driven.
In such cases, Dynamic Bayesian Networks (DBS) will help us very well - a generalization of models based on Kalman filters and the Hidden Markov Model.
We divide patient data into static and dynamic.
If we were to build a static Bayesian grid, then our task would be to calculate the following probability:
,
Where - the node of our grid (the top of the graph, in fact), i.e. the value of each variable (gender, age ...), and C is the predicted class (illness).
The static grid looks like this:
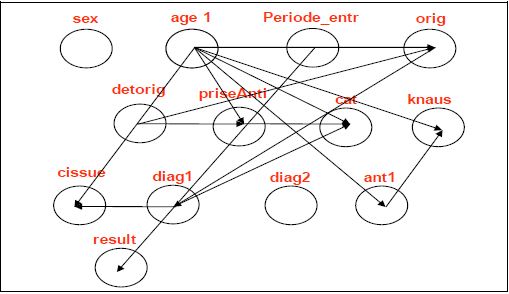
But this is not ice. The patient's condition changes, time goes on, it is necessary to decide how to treat it.
Here for this and apply DBS.
First, on the day of the patient's intake, we build a static grid (as in the picture above). Then, every day i build a grid based on dynamically changing data:
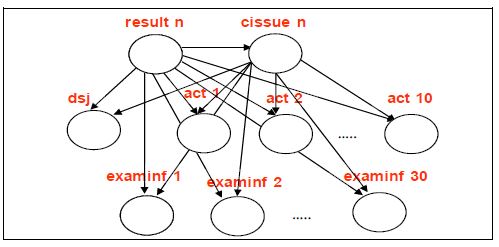
Accordingly, the cumulative model will take the following form:
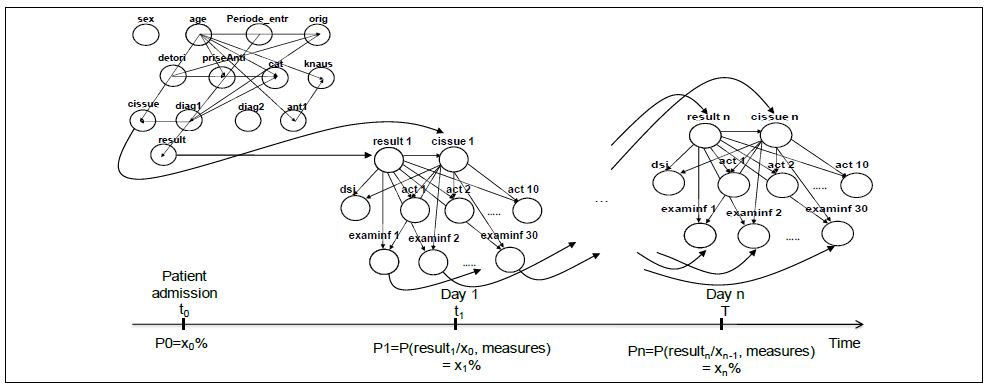
Thus, we calculate the result according to the following formula:
where T is the cumulative hospitalization time, N is the number of variables at each of the DBS steps.
It is necessary to introduce this model in the DSS a little differently - rather, it’s necessary to go from the opposite, first fix this model, and then build the interface around . Ie, in fact, we made a hard model, inside which there are dynamic elements.
Game theory
The theory of games, in turn, is much better suited for ISPRIs created for making strategic decisions. Let's give an example.
Suppose there is an oligopoly on the market (a small number of rivals), there is a certain leader and this is (alas) not our company. We need to help management decide on the volume of our products: if we produce products in the amount of , and our rival - Will we go to minus or not? To simplify, we take a special case of oligopoly - a duopoly (2 players). As long as you think RandomForest is here or CatBoost, I’ll suggest that you use the classics - the Stakelberg equilibrium. In this model, the behavior of firms is described by a dynamic game with complete perfect information, while the game’s feature is the presence of a leading company that first determines the volume of goods produced, and the rest of firms are guided in their calculations by it.
To solve our problem, we just need to count this in which the following optimization problem is solved:
To solve it (surprise-surprise!) It is only necessary to equate the first derivative with respect to to zero.
At the same time for such a model we need to know only the offer on the market and the cost for the goods from our competitor, after which we will build a model and compare the resulting q with the one that our management wants to throw out to the market. Agree, a little easier and faster than nag NN.
For such models and DSS based on them, and Excel. Of course, if you need to calculate the entered data, you need something more complicated, but not much. The same Power BI cope.
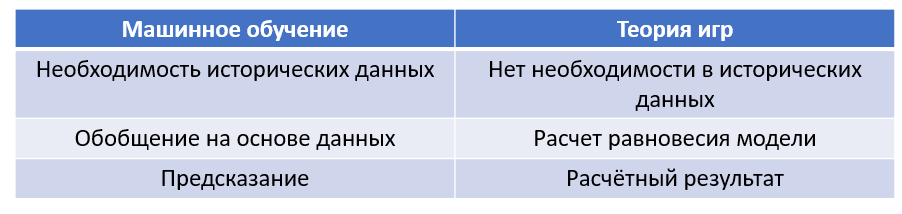
Looking for a winner in the battle ML vs ToG is meaningless. Too different approaches to solving the problem, with its pros and cons.
What's next?
With the current state of the ISPP, it would seem to have figured out where to go next?
In a recent interview with Judah Pearl, the creator of the most Bayesian networks, expressed a curious opinion. To paraphrase slightly,
“All that the experts in machine learning are doing now is fitting the curve to the data. The fit is nontrivial, complex and dreary, but it’s still fit. ”(read)
Most likely, in Vanguay, after 10 years we will stop rigidly hardcoding the models, and start instead to teach computers everywhere in the created simulated environments. Probably, the implementation of the ISPR will follow this path - along the path of the AI and other skynets and WAPRs.
If we look at a closer perspective, then the future of the ISPP is behind the flexibility of decisions. None of the proposed methods (classical models, machine learning, DL, game theory) is not universal in terms of efficiency for all tasks. A good DSS should combine all these tools + RPA, while different modules should be used for different tasks and have different output interfaces for different users. A sort of cocktail, mixed, but in any case not shaken up.
Literature
- Merkert, Mueller, Hubl , University of Hoffenhaim 2015
- Tariq, Rafi , Intelligent Decision Support Systems- A Framework, India, 2011
- Sanzhez i Marre, Gibert , Evolution of Decision Support Systems, University of Catalunya, 2012
- Ltifi, Trabelsi, Ayed, Alimi , Dynamic Decision Support System, University of Sfax, National School of Engineers (ENIS), 2012
Source: https://habr.com/ru/post/359188/
All Articles