Setting Data Science tasks and interaction with business

Hi, Habr. This time again about Data Science. I think many people are familiar with the CRISP-DM methodology, which is spoken about in most courses, but the first item (business understanding) is not enough information, so it’s not for nothing, because it’s very important.
Therefore, in this article we will talk about the interaction with the business and what problems and difficulties usually arise in this matter. Let's look at everything with an example.
')
So, imagine that a business representative came to you and described the following situation:
"Hello. We need your help. We have a system by which we automatically debit money from our debtor cards (something like Uber, which after the trip itself debits the required amount from the card). We here discovered that her success rate was about 10%, which does not suit us at all, since we pay for each attempt. We need to make a successful write-off of about 30% minimum. Will you do? ”

Wow, how much all in a few sentences, and not immediately understand.
Here we are faced with the first task - to understand what is generally needed.
After a long discussion, it became clear that the success rate is counted as the number of successful / number of unsuccessful debits per day, which, in fact, should be increased. Further, it turns out that the system itself works very hard: it does a lot of deductions for a client per day, for different amounts, strongly depends on the day (on payroll days it tries to remove almost all hours from all overdue clients) and is generally difficult to simulate.
Okay, at least now we know this, but the question arises from the point of view of Data Science - what should be the target variable?
You can predict the presence of at least some amount on the account, you can predict the presence of the amount of debt or some percentage of the amount of debt (because the amount is different for each, you also need to take this into account), you can consider the success of each transaction as binary 1 or 0.
It is important to clarify the target variable with the customer.
Well, let's say we realized that we want to predict the success of each cheating. What problems can we face in this case?
Well, for example, we can significantly reduce the amount of daily charges and, as a result, the amount of money we collect each day. What else? Having such a target variable, we will increase the success rate, but not increase the number of write-offs, and it is quite possible that the total amount of write-offs is very important for all stakeholders to know. All these questions need to be asked before the start of the simulation, as well as to know the expected results.
Do not forget to specify the expected results and possible risks.

Having understood, finally, all possible risks and selecting the target variable, you can proceed to data collection, their processing and modeling. You can write many more articles on these issues, so we will immediately move on to the simulation results and their business interpretation.
Suppose you have built a model and want to tell the business about its results, showing an excellent ROC or PR curve and saying how much this will improve the success rate and, in general, the entire business as a whole. But the problem is that the business does not know what the ROC curve is, and also does not know what the PR curve is. Usually in this case confusion matrix helps a lot. In Python, it is very easy to do with the scikitplot library.
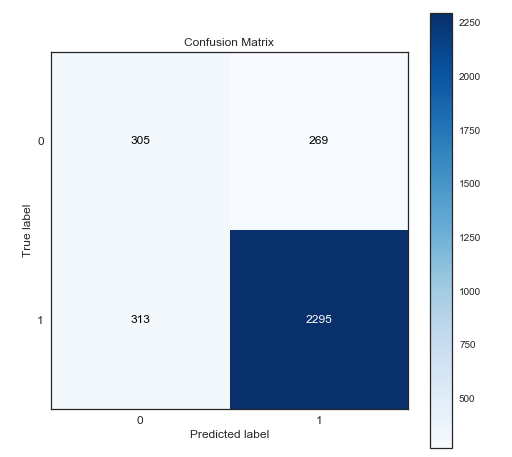
Then you can, for example, make predictions for the new month, and then explain how many errors of the first and second kind will be in the matrix (showing directly in the number of customers) or even explain what these notorious Precision and Recall mean. Very clear and understandable.
Choosing a cut-off and calculating the effectiveness of the model
The next item usually raises the question: "And how much money will we get from the implementation of this model?" . And now is the time to start choosing the optimal cut-off threshold.
The threshold in this case is the probability (predict_proba to help you), above which we say that our target variable is 1, and below it is 0. This threshold is usually 0.5, but this does not always correspond to the maximum profit and depends strongly on the price of errors of the first and the second kind. In our case, we know that if:
- The client has money, and we do not charge them, then we lose the amount that he could have written off. We can take the average value of this amount for all customers as the error value of the first kind.
- The client has no money, but we are trying to write off something. In this case, the attempt to write off a failure and we pay the service a fixed amount that does not depend on the debt. In our case, the error of the second kind is $ 5, while the average value of the error of the first kind is $ 50.

To find the optimal cut-off, we take a test month and try to find a threshold that will bring us the most money. This can be done by simply running different cut-off values in python or even Excel solver. But in this case, we forgot to take into account another important thing - if we do not write off, the client is likely (in our case about 30%) that he will give the money himself, which also needs to be taken into account.
The graph shows the total amount of collection depending on the threshold (note that due to the last statement, the values are not even zero when the threshold is close to 1!). As you can see, the optimal value is 0.41, and we take it. With this value, we would receive about $ 170,000, while we know that in reality we received $ 145,000. The total value of the model is about 25 thousand per month or 300 thousand per year. This value is too high, because the model is unlikely to work for a whole year with the same quality, but we have seen the baseline estimate.

As you can see, even in a simple model and a seemingly ordinary task, we had a lot of points, forgetting that we would get completely different results.
All the steps above are described for this particular case and can vary greatly depending on the task, but still try to highlight the main steps that need to be followed when interacting with the business:
- Understand what the customer needs
- Refine target variable
- Discuss expected results and risks.
- Select cut-off and calculate the effectiveness of the model.
I hope that with this example I showed the importance of the business component of the work of the date of scientism and it was useful to someone. See you!
PS All values in the article are unreal and taken just for example.
Source: https://habr.com/ru/post/359154/
All Articles