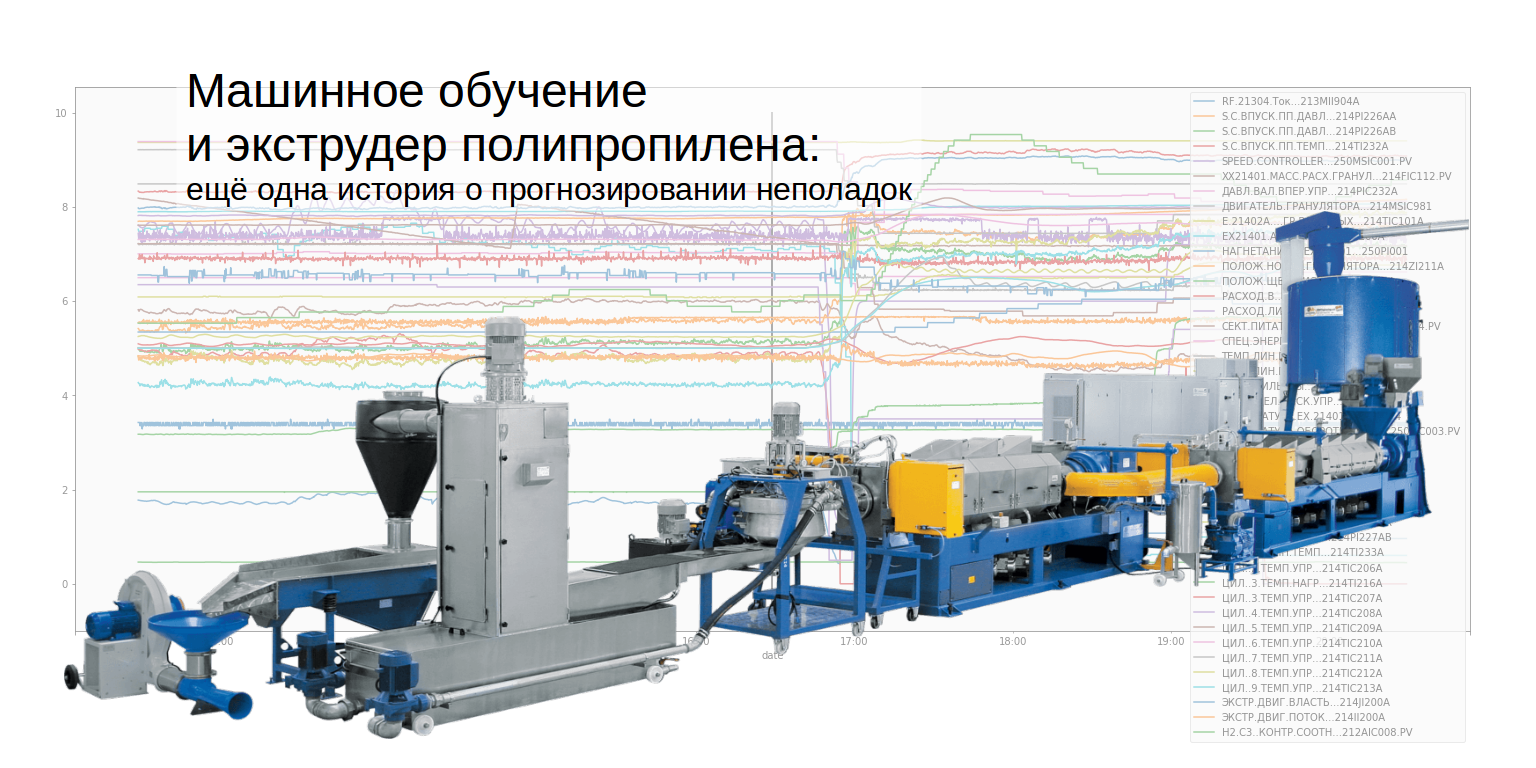
Machine learning and a polypropylene extruder: history 3 places on the hakatone Sibur
Hackathon " Digital Plant ", organized by Sibur and the AI Community, took place last weekend. One of the two tasks of the hackathon was on the topic of predictive maintenance - it was necessary to predict problems in the extruder. Her we decided. The story focuses mainly on the data science part of the solution, and how we managed to learn how to predict quite rare rare events.
Let's start with the problem statement. An extruder is such a large industrial meat grinder that heats and softens polypropylene, mixes it with various additives, presses it, pushes it through a spinneret (grid), and cuts it into small granules. Then these granules are poured into big bags and sold to the consumer of polypropylene, which makes something useful from it - for example, the same big bags. But that is if everything goes well. And it happens that on the die there is a crust of polypropylene agglomerates - its large pieces, which prevent normal cutting of granules. As a result, in the best case, a poor-quality product is produced, and at worst, the extruder has to be stopped, disassembled and cleaned - it turns out to be expensive and simple.

')
However, if such a blockage is detected in time, it can be prevented by certain actions. Constantly in this mode, you can not work - a bad effect on the equipment and the product. Hence the problem of forecasting: the operator who monitors the extruder needs to report potential problems in order to prevent those downtime. Moreover, to prevent it was possible to effectively, you need to report strongly in advance. The problem is that there is no unambiguous and simple sign by which the approaching degradation of the process can be determined. That is why machine learning can potentially help here: you can try to form a reliable signal about upcoming problems based on statistics and brute force.
The statistical approach, however, makes it difficult to small data size. We were given the performance of 43 sensors in a year and a half with a frequency of 10 seconds - 4 million observations, occupying two gigabytes.This is almost big data . But at the same time, the events of extruder stop due to the appearance of agglomerates during this time, only 66 were recorded. And this means that it is very easy to retrain on such data. Since it is not known in advance what indicators are related to the formation of aggregates, and what the formula predicting problems might look like. Even if one just goes through combinations of 2 out of 43 sensors - there will be almost 1000 of them, an order of magnitude more than events, and among them there are most likely such combinations that well explain these 66 stops. But in fact, more than two indicators can participate in the form, and they can be aggregated at different horizons (from 10 seconds to 10 hours, conditionally), and the aggregates can be different (averages, quantiles, any spectrum) - in general , a huge number of options. Therefore, it is very easy to adjust the model, which reacts to all 60 stops, on such data simply by going through all sorts of signs. But it is difficult to achieve a good generalizing ability of the model - to ensure that these signs will work in the future. In statistics, this problem is called overfitting.
You can deal with the problem of retraining in different ways: go get more marked data (no one), embed expert knowledge of the process (we didn’t have it) into the model, strongly restrict the model’s flexibility (tried, not an option). And one more way to avoid retraining is procrastination. Instead of predicting the rare stops of an extruder, you can go to solve some completely different problem, simpler and more pleasant. And hope that the original problem will be solved somehow by itself. Surprisingly, it works.
Procrastination, in fact, is also art. More details can be searched for the keywords “transfer learning” or “learning ideas”. The key idea is that in the process of solving an extraneous problem, the machine learning algorithm can discover for itself signs and patterns that are useful for the main task.
In our case, the main task is to predict the likelihood of problems in the near future, but the problems are poorly marked. You can solve an auxiliary task: learn how to predict the values of each sensor - for example, after 3, 10, 30, 60 and 120 minutes. This, firstly, can be useful in itself. Secondly, it is convenient to compare the predictions of the sensor operation with the fact, and thereby convince the customer that the model is generally predictive. And third, and most importantly, if we can find a relatively small number of signs (say, 256), which allow us to predict the value of any sensor on different horizons, then they, too, will probably be able to predict the clogging of the spinnerets.
To predict the values of all sensors, we decided to use a fully connected neuron, to the input of which one and a half thousand already slightly aggregated and normalized features were fed, and at the output each of the 43 sensors should be predicted on 5 different horizons. After a small number of experiments, this five-layer construction was obtained:
We set up a full model model at midnight to study on all one and a half years of data. In the morning, we checked the quality on a test sample: it turned out that even on a two-hour horizon, the average for all sensors more than 98%. Well, we are able to predict sensors. Now the model can be thrown into the trash. Because to solve the main problem, we need only an encoder , a submodel that turns the input information from the sensors into 256 strong attributes. On these signs, one can train a highly regularized xgboost, which will already predict target events. It turned out that predicts pretty well: ROC AUC of the order of 96% for cross-validation. Without neurons, it was noticeably worse.
Within the framework of the hackathon, we presented exactly this solution, with pre-trained neuron signs. But on a real project, we would try a more complex structure that uses physical patterns more explicitly.
The advantage of physical formulas is that they are usually very simple, and therefore stable and interpretable. The disadvantage is that you need to know them. Neuron tried to predict the effect of each sensor on each - for this, if you do not use hidden factors, you need to train at least matrix 43 * 43. In the real world, dependencies are much more rarefied — most of the sensors do not directly affect each other. This tells us just common sense. But in order to know which particular dependencies nevertheless exist and are justified by physics, one needs knowledge of the subject area. Or careful and rather tricky data analysis. We confined ourselves to its simple form - for each pair of sensors we measured how strongly and with what time lag their indicators correlate with each other. If you display the dots with sensors, and the arrows show the strongest correlations between them, you get something like this:

We see several groups of interconnected sensors. Knowing the extruder device and the exact physical meaning of each indicator, the groups can be adjusted to a more logical picture - for example, to realize that the 7th cylinder does not affect the 9th directly, but only through the 8th. Well, then for each group of highly interconnected sensors, you can enter some kind of interpretable indicator of its state. Such indicators may turn out to be even stronger signs than what the neuron learned. And most importantly, they can be useful for the operator of an extruder - with their help, you can not only foresee problems, but also quickly understand where these problems are located.
If we didn’t participate in the hackathon, but wrote a scientific article, then we could stop here: we have proved that the problem of predicting problems has a solution. But in fact, the real work here is just beginning: now it is necessary to make the model created by us benefit. For this, it must be of at least three quality metrics:
In the simplest case, these metrics are configured by selecting a threshold, after which the model “works” and throws scared notifications. A more difficult and correct solution is to make predictions of the risk of stopping at different time horizons, smooth each of them using any method of smoothing the time series, and raise an alarm if one or more of them are predicted too much. But in order to make this adjustment, you should finally communicate with potential users of this system - find out what expectations they have of it, how the prevention of stops is carried out now, and what actions they are ready for in the future.
In fact, about many things. And about how we spent several hours stupidly gouging at the graphics and trying to understand the nature of the problems, until we found out that the dates of the stops were read in the wrong format by our algorithm, and we were trained on the wrong events. And as we tried to contact with specialists from Tobolsk, so that they told us that yes how it was arranged in an extruder. If it were not for the weekend, perhaps we would even be answered ... And about how we, in the last hours, took up the demonstration interface of our system, and dug into it a “time machine” to view the history of forecasts, I also will not - after all An article about data science. Not very rich interface - probably one of the reasons why we took only the third place. However, it works, and this is a reason to rejoice.

You can look at the raw version of the interface here - it “loses” in an accelerated mode the work of the predictive model in one of the real evenings of this year. The link opens at 20.45, and at 21.05 the extruder actually stopped, this is a historical fact. However, thanks to those like us, in the foreseeable future, this extruder will have to be stopped much less frequently.
Why did you need to predict the stop extruder
Let's start with the problem statement. An extruder is such a large industrial meat grinder that heats and softens polypropylene, mixes it with various additives, presses it, pushes it through a spinneret (grid), and cuts it into small granules. Then these granules are poured into big bags and sold to the consumer of polypropylene, which makes something useful from it - for example, the same big bags. But that is if everything goes well. And it happens that on the die there is a crust of polypropylene agglomerates - its large pieces, which prevent normal cutting of granules. As a result, in the best case, a poor-quality product is produced, and at worst, the extruder has to be stopped, disassembled and cleaned - it turns out to be expensive and simple.
')
However, if such a blockage is detected in time, it can be prevented by certain actions. Constantly in this mode, you can not work - a bad effect on the equipment and the product. Hence the problem of forecasting: the operator who monitors the extruder needs to report potential problems in order to prevent those downtime. Moreover, to prevent it was possible to effectively, you need to report strongly in advance. The problem is that there is no unambiguous and simple sign by which the approaching degradation of the process can be determined. That is why machine learning can potentially help here: you can try to form a reliable signal about upcoming problems based on statistics and brute force.
About retraining and procrastination
The statistical approach, however, makes it difficult to small data size. We were given the performance of 43 sensors in a year and a half with a frequency of 10 seconds - 4 million observations, occupying two gigabytes.
You can deal with the problem of retraining in different ways: go get more marked data (no one), embed expert knowledge of the process (we didn’t have it) into the model, strongly restrict the model’s flexibility (tried, not an option). And one more way to avoid retraining is procrastination. Instead of predicting the rare stops of an extruder, you can go to solve some completely different problem, simpler and more pleasant. And hope that the original problem will be solved somehow by itself. Surprisingly, it works.
Neurons enter the battlefield
Procrastination, in fact, is also art. More details can be searched for the keywords “transfer learning” or “learning ideas”. The key idea is that in the process of solving an extraneous problem, the machine learning algorithm can discover for itself signs and patterns that are useful for the main task.
In our case, the main task is to predict the likelihood of problems in the near future, but the problems are poorly marked. You can solve an auxiliary task: learn how to predict the values of each sensor - for example, after 3, 10, 30, 60 and 120 minutes. This, firstly, can be useful in itself. Secondly, it is convenient to compare the predictions of the sensor operation with the fact, and thereby convince the customer that the model is generally predictive. And third, and most importantly, if we can find a relatively small number of signs (say, 256), which allow us to predict the value of any sensor on different horizons, then they, too, will probably be able to predict the clogging of the spinnerets.
To predict the values of all sensors, we decided to use a fully connected neuron, to the input of which one and a half thousand already slightly aggregated and normalized features were fed, and at the output each of the 43 sensors should be predicted on 5 different horizons. After a small number of experiments, this five-layer construction was obtained:
import keras from keras.models import Model from keras.layers import Input, Dense l2_regul = keras.regularizers.l2(1e-6) input_layer = Input(shape=(input_shape,)) enc1 = Dense(512, kernel_regularizer=l2_regul, activation='relu')(input_layer) enc2 = Dense(256, kernel_regularizer=l2_regul, activation='relu')(enc1) repr_layer = Dense(256, kernel_regularizer=l2_regul, activation='relu')(enc2) dec1 = Dense(256, kernel_regularizer=l2_regul, activation='relu')(repr_layer) dec2 = Dense(256, kernel_regularizer=l2_regul, activation='relu')(dec1) last_layer = Dense(prediction_shape)(dec2) model = Model(inputs=input_layer, outputs=last_layer) encoder = Model(inputs=input_layer, outputs=repr_layer) We set up a full model model at midnight to study on all one and a half years of data. In the morning, we checked the quality on a test sample: it turned out that even on a two-hour horizon, the average for all sensors more than 98%. Well, we are able to predict sensors. Now the model can be thrown into the trash. Because to solve the main problem, we need only an encoder , a submodel that turns the input information from the sensors into 256 strong attributes. On these signs, one can train a highly regularized xgboost, which will already predict target events. It turned out that predicts pretty well: ROC AUC of the order of 96% for cross-validation. Without neurons, it was noticeably worse.
How can you screw physics here
Within the framework of the hackathon, we presented exactly this solution, with pre-trained neuron signs. But on a real project, we would try a more complex structure that uses physical patterns more explicitly.
The advantage of physical formulas is that they are usually very simple, and therefore stable and interpretable. The disadvantage is that you need to know them. Neuron tried to predict the effect of each sensor on each - for this, if you do not use hidden factors, you need to train at least matrix 43 * 43. In the real world, dependencies are much more rarefied — most of the sensors do not directly affect each other. This tells us just common sense. But in order to know which particular dependencies nevertheless exist and are justified by physics, one needs knowledge of the subject area. Or careful and rather tricky data analysis. We confined ourselves to its simple form - for each pair of sensors we measured how strongly and with what time lag their indicators correlate with each other. If you display the dots with sensors, and the arrows show the strongest correlations between them, you get something like this:
We see several groups of interconnected sensors. Knowing the extruder device and the exact physical meaning of each indicator, the groups can be adjusted to a more logical picture - for example, to realize that the 7th cylinder does not affect the 9th directly, but only through the 8th. Well, then for each group of highly interconnected sensors, you can enter some kind of interpretable indicator of its state. Such indicators may turn out to be even stronger signs than what the neuron learned. And most importantly, they can be useful for the operator of an extruder - with their help, you can not only foresee problems, but also quickly understand where these problems are located.
User experience and quality measurements
If we didn’t participate in the hackathon, but wrote a scientific article, then we could stop here: we have proved that the problem of predicting problems has a solution. But in fact, the real work here is just beginning: now it is necessary to make the model created by us benefit. For this, it must be of at least three quality metrics:
- The share of predicted problems (probably, about 80% is not bad already?)
- The frequency of false positives (more often than on average once a shift is already chaos)
- Problem prediction horizon (on stopping prevention, it seems like from 5 to 30 minutes)
In the simplest case, these metrics are configured by selecting a threshold, after which the model “works” and throws scared notifications. A more difficult and correct solution is to make predictions of the risk of stopping at different time horizons, smooth each of them using any method of smoothing the time series, and raise an alarm if one or more of them are predicted too much. But in order to make this adjustment, you should finally communicate with potential users of this system - find out what expectations they have of it, how the prevention of stops is carried out now, and what actions they are ready for in the future.
What I did not tell
In fact, about many things. And about how we spent several hours stupidly gouging at the graphics and trying to understand the nature of the problems, until we found out that the dates of the stops were read in the wrong format by our algorithm, and we were trained on the wrong events. And as we tried to contact with specialists from Tobolsk, so that they told us that yes how it was arranged in an extruder. If it were not for the weekend, perhaps we would even be answered ... And about how we, in the last hours, took up the demonstration interface of our system, and dug into it a “time machine” to view the history of forecasts, I also will not - after all An article about data science. Not very rich interface - probably one of the reasons why we took only the third place. However, it works, and this is a reason to rejoice.
You can look at the raw version of the interface here - it “loses” in an accelerated mode the work of the predictive model in one of the real evenings of this year. The link opens at 20.45, and at 21.05 the extruder actually stopped, this is a historical fact. However, thanks to those like us, in the foreseeable future, this extruder will have to be stopped much less frequently.
Source: https://habr.com/ru/post/359136/
All Articles