Java labor market - what we know about him, what he knows about us
Past articles with numbers have found a positive response among readers, so - this time something completely different - another statistical compilation: the job market in Java, numbers from vacancies, resumes and salaries. Our hh.ru itself is mostly written on it - for ~ 15 years we have been following the entire Java ecosystem and the dynamics of javista on the market.
Under the cut - a comparison of Java with the aggregate market, real / proposed / expected salaries, competition and general trends. 21 schedule, reading time - about 7 minutes.

We counted only those vacancies in the title of which Java was found in conjunction with developer / developer / tech and so on. The number of vacancies is considered by the date of publication, ie vacancies, published in January and living until n of February, are included in the statistics only in January.
')
In addition to the number, in the statistics on vacancies there is another global entity - wages. Not every job they have. Existing data on wages is more than enough to build statistics, but the lack of them in much of the vacancies still affects the objectivity of the data, just as the fact of the existence of relations in the labor market outside hh.ru. Next in order.
Below is the dynamics of vacancies for javists for the last 4 full years, the basis is 2013. The jump in 2016, in particular in Moscow, may be associated with post-crisis growth. The sanction year introduced some confusion in software deliveries from abroad, partly stimulated import substitution, further stimulated exports and forced us to look towards digitalization in order to save some of the companies that were previously far from it. This applies not only to Java, but to the whole IT industry as a whole, which significantly outpaced the aggregate market in the spring of 2016 in terms of growth in the number of vacancies.
Only millionaire cities. We took all the vacancies in the country over the past year and counted the share of each city - almost half of all vacancies fell on Moscow. The current situation in terms of vacancy rates for the city, key skills from resumes and so on. in open access in the advanced search , if necessary.
Again millionaires, the whole of 2017. It works like this: in Novosibirsk, in one year, 1000 vacancies were placed (for sellers / hairdressers / postmen, etc.), out of this thousand - 16 vacancies for javists. In all of Russia, Java developers account for 5 out of 1,000 vacancies. For comparison: a waiter — 17 vacancies for every 1000 of all vacancies in the country.
Taking into account the specifics of hh.ru, the distribution does not claim to be objective regarding the situation in Russia: in the service database, 84% of all vacancies for javista are full time. However, an interesting fact is that the average salary in vacancies of various types: a full day - 114,424 , a flexible schedule - 110,081 , distant work - 115,485 . In rubles. All Russia.
The required experience throughout Russia - almost half of employers want to see javistes with relevant experience from 6 years. Most likely, in practice, questions of experience are solved case-by-case not in years, and job creators use default gaps to filter junior / middle / senior. There are already data for 2018.

Those are the numbers that are not in all the vacancies. Take the ranges of experience for the usual junior / middle - it turns out well and clearly. Below in the article there will be salaries at levels that are calculated differently and reflect the situation a little better specifically for large companies. What is quartile - shortly .

There was a time, the average salary of javists in Petersburg was higher than in Moscow. From the same 2016 (see the dynamics of vacancies ), along with the number of vacancies, wages began to grow, almost steadily up to the present.
Here is a comparison of average salaries for all vacancies in the region in general with wages in javista vacancies. Indicative: in 2017 in Russia the average proposed salary is 45k on average in the market, in Java - 2.5 times more.
Hh.ru has a project (not PR for the sake of, but for use - it’s worth clicking only if you want to look at the demo or consider it for a company), its essence - companies provide actual wages of their employees, in the total sample salaries are depersonalized. The companies themselves are tied to the industry, region and number of employees, type of capital, etc. Salaries are tied to the professions and position level. At the exit, the project participant sees which companies in the industry have already provided data, selects a region, a specialization, and a professional area - as a result, a report is generated with the total value of salaries in the sample.
Below are screenshots of the bank by a Java developer in Moscow, 4 pcs. by levels.
The median salary for a Java tmlid in Moscow is 183k. The delta of the range of actual wages is curious, with expectations from resumes and job offers. The ranges themselves are interquartile range . I will clarify that salary expectations are the numbers that applicants indicate, salary offers are numbers from vacancies, and actual salaries are bank data.
The "seniors" median values of actual wages are still lower than offers and expectations.
If you are middleware in Moscow on Java - this is about a hundred. More is better.
Fix for June in Moscow - 34k rubles, or the average salary in Volgograd.
According to the summary of data quite a bit, however. The filtering method is the same as for vacancies - names and key skills mentioning Java / Java dev and so on.
Half of all javistes are between 26 and 35 years old. As in the case of salary in vacancies, age can be not advertised, but in this case the effect of missing data on age on objectivity is a moot point.
Not the most revealing statistics. The whole experience is taken into account, regardless of whether Java or non-Java, development or non-development.

Still, without basic knowledge, it is quite difficult, English - after all, it is to mandatory key skills, regardless of the stack, to googler - advanced.
hh. index shows competition - the ratio of the number of active resumes and vacancies. The higher, the more unpleasant for applicants. On average, in Russia, in the aggregate market, hh.index is 7. That is, in the country, there are 7 job applicants in the general labor market, and a little more than one Java developer per vacancy in a Java developer.
Below is everything that is not related to the categorization above or specifically to Java, but it does occur.
All resumes are taken into account here, where last_change_time is from 2010, any of the programming languages are in the title, or in key_skills.
The ratio of the number of requests in the job search last year to the year before last. Blockchain at the hearing, of course.
Here we took the number of all requests to search from authorized applicants, in the summary of which there are development / developer / developer keys, etc., and we calculated the ratio to the number of requests by keys below.

It shows how much the skill share in the age group differs from the same share in the remaining sample. Well, practically. Read more about the interpretation of the odds ratio .
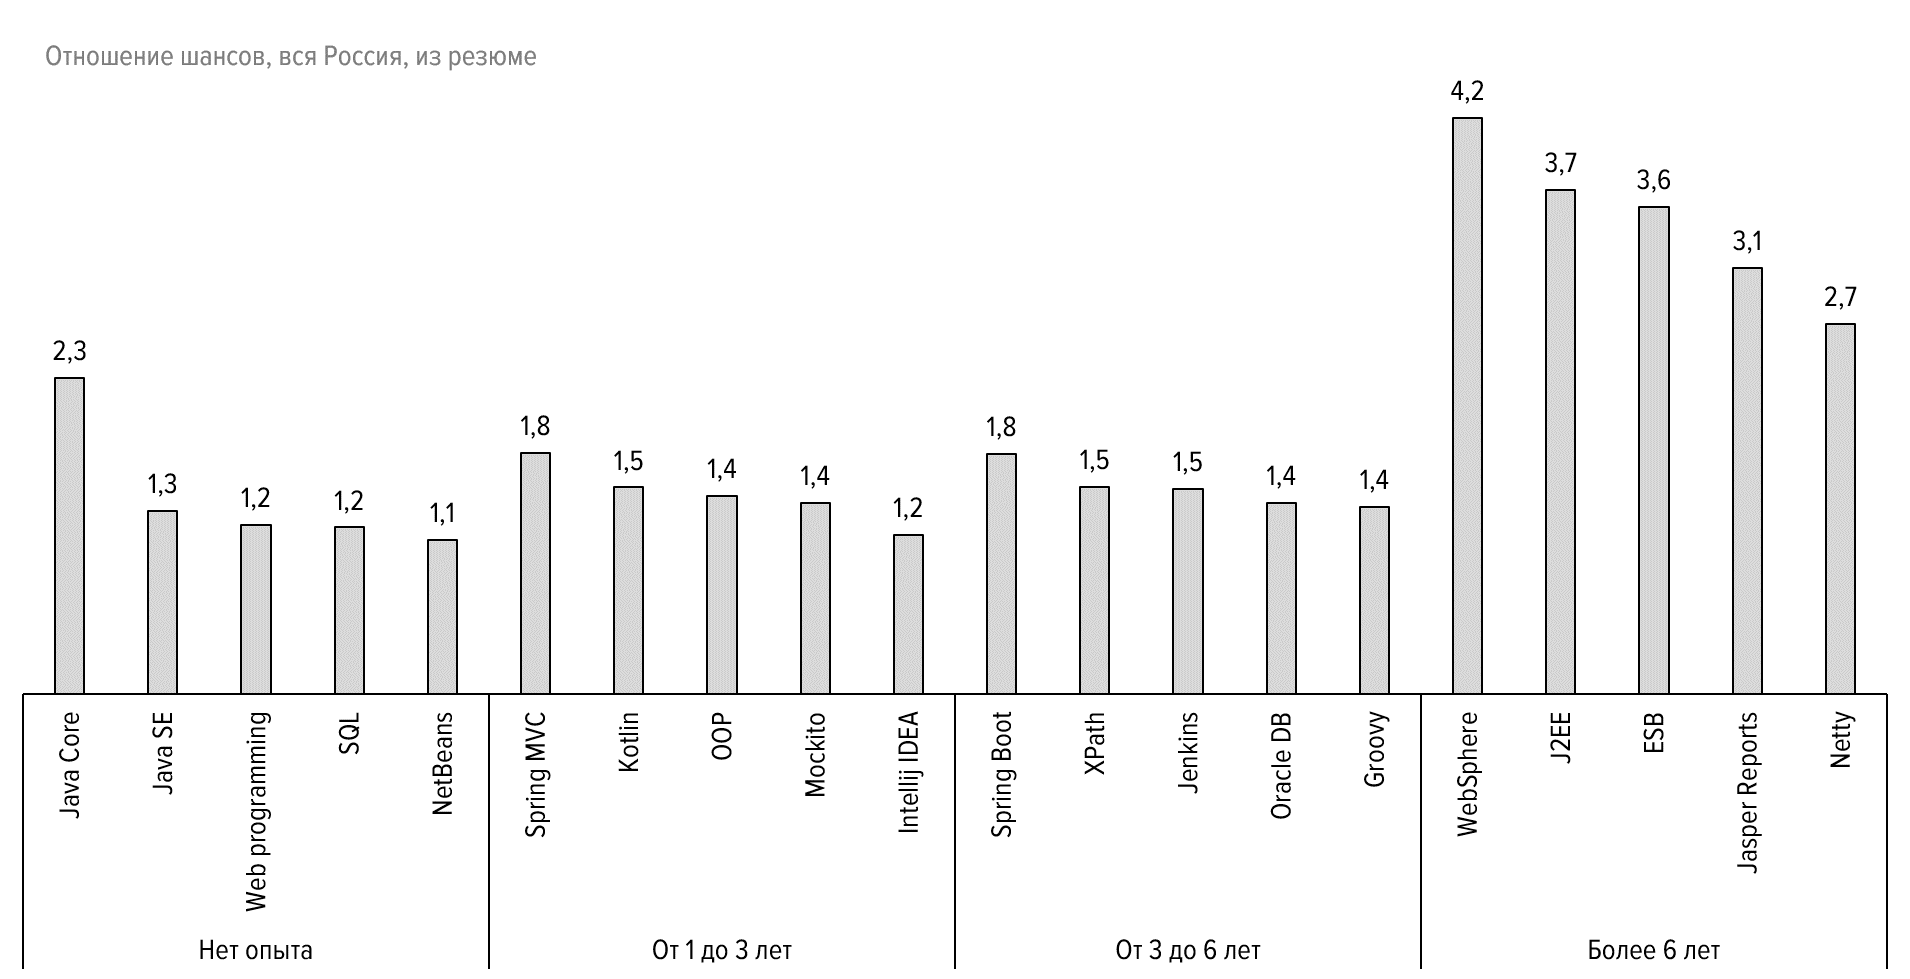
The same as above, only in grouping by experience.
That's all. The data given in the article, we sovushkasolnce collected by Jpoint 2018. A month later, we woke up and made a post.
Comments are welcome. Thank!
Under the cut - a comparison of Java with the aggregate market, real / proposed / expected salaries, competition and general trends. 21 schedule, reading time - about 7 minutes.
Jobs
We counted only those vacancies in the title of which Java was found in conjunction with developer / developer / tech and so on. The number of vacancies is considered by the date of publication, ie vacancies, published in January and living until n of February, are included in the statistics only in January.
')
In addition to the number, in the statistics on vacancies there is another global entity - wages. Not every job they have. Existing data on wages is more than enough to build statistics, but the lack of them in much of the vacancies still affects the objectivity of the data, just as the fact of the existence of relations in the labor market outside hh.ru. Next in order.
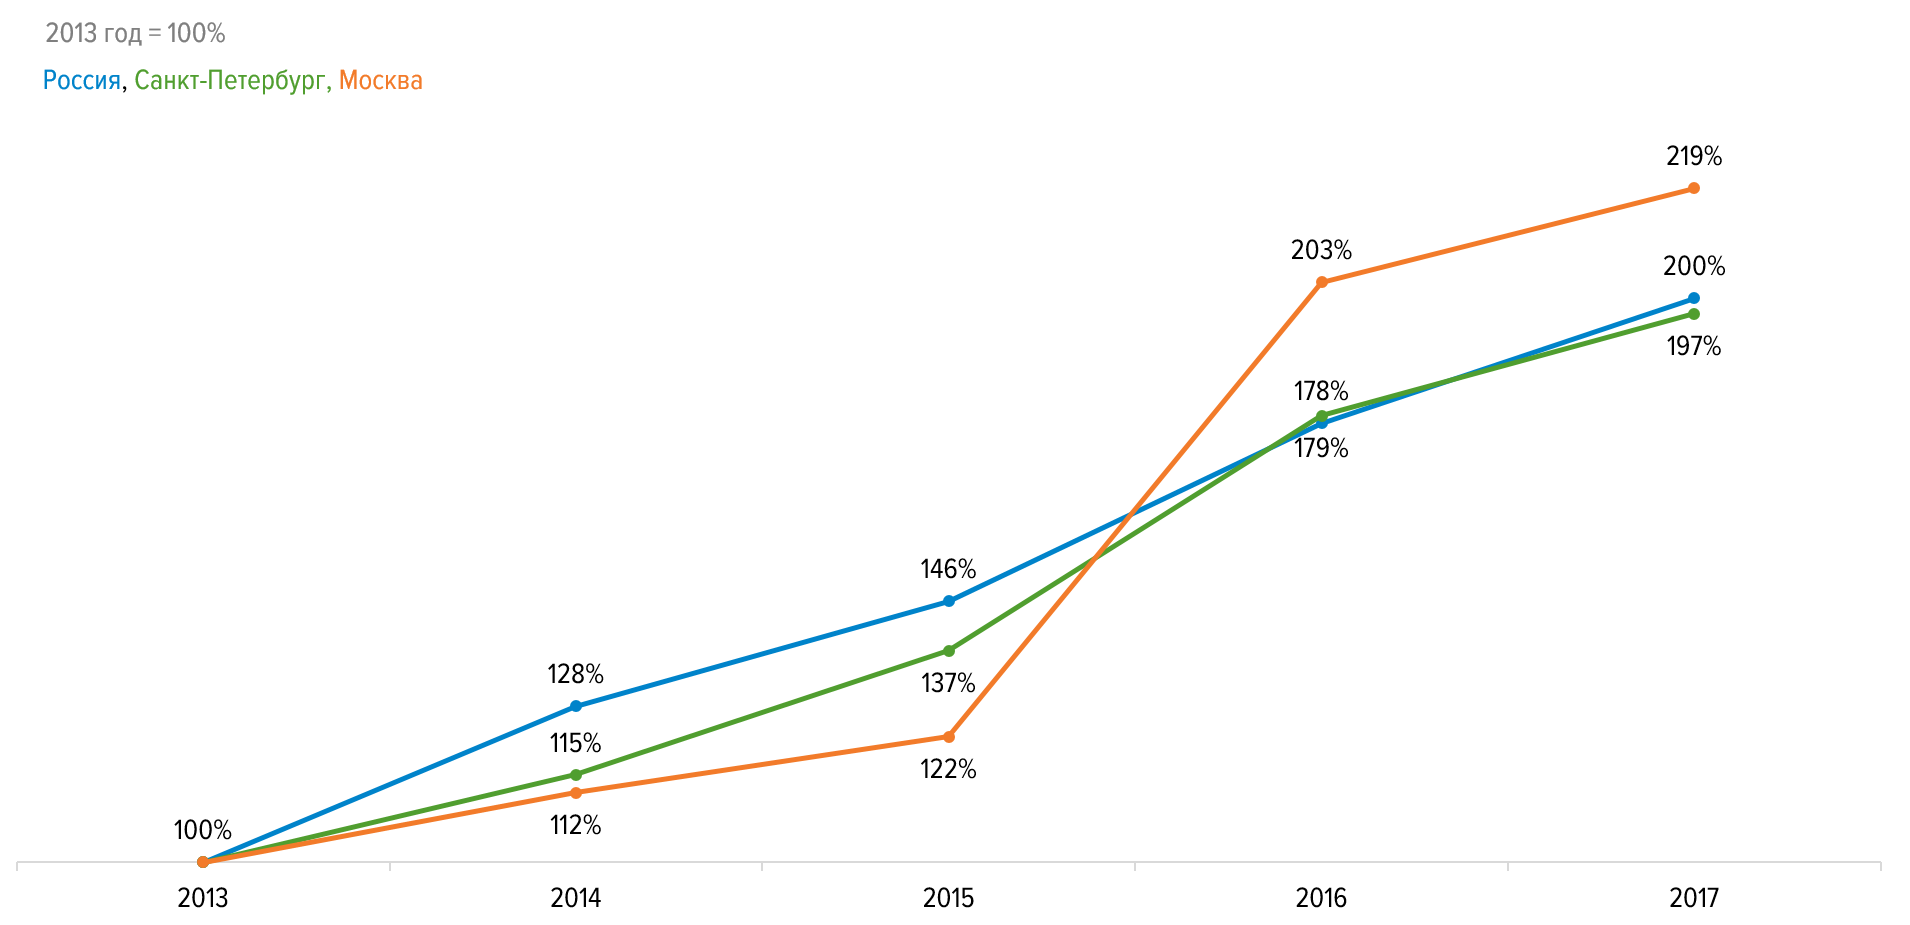
How has the number of vacancies for Java-developers since 2013
Below is the dynamics of vacancies for javists for the last 4 full years, the basis is 2013. The jump in 2016, in particular in Moscow, may be associated with post-crisis growth. The sanction year introduced some confusion in software deliveries from abroad, partly stimulated import substitution, further stimulated exports and forced us to look towards digitalization in order to save some of the companies that were previously far from it. This applies not only to Java, but to the whole IT industry as a whole, which significantly outpaced the aggregate market in the spring of 2016 in terms of growth in the number of vacancies.
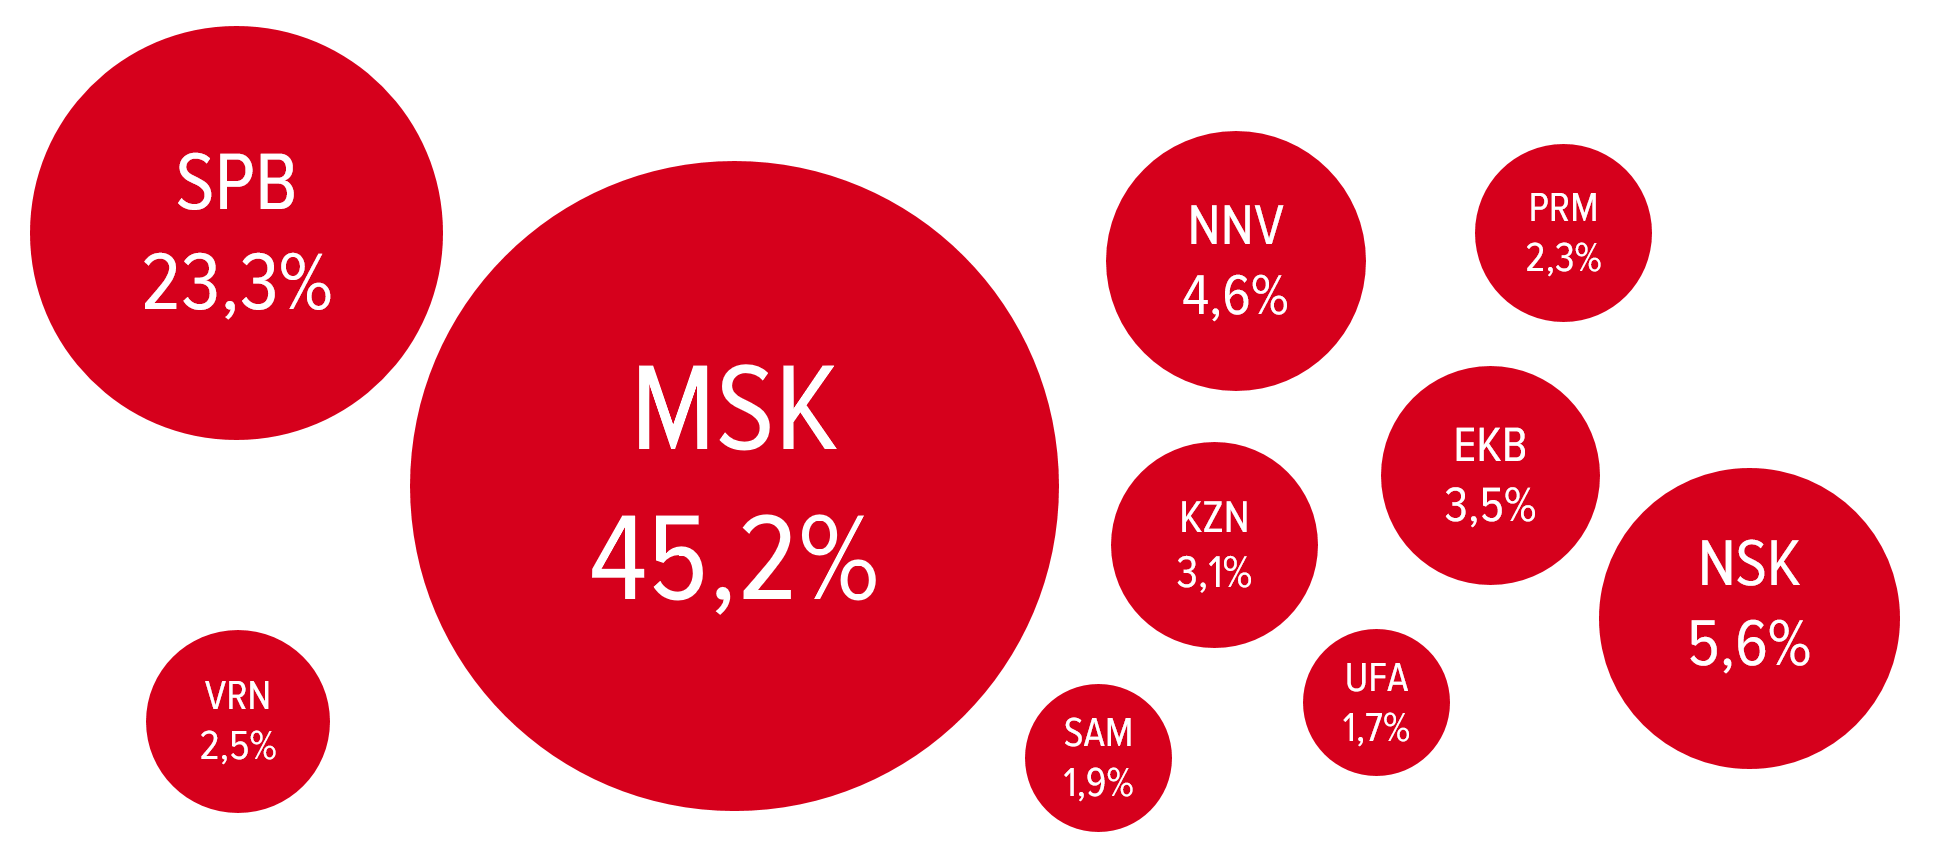
In which cities were Java developers looking for more often in 2017?
Only millionaire cities. We took all the vacancies in the country over the past year and counted the share of each city - almost half of all vacancies fell on Moscow. The current situation in terms of vacancy rates for the city, key skills from resumes and so on. in open access in the advanced search , if necessary.
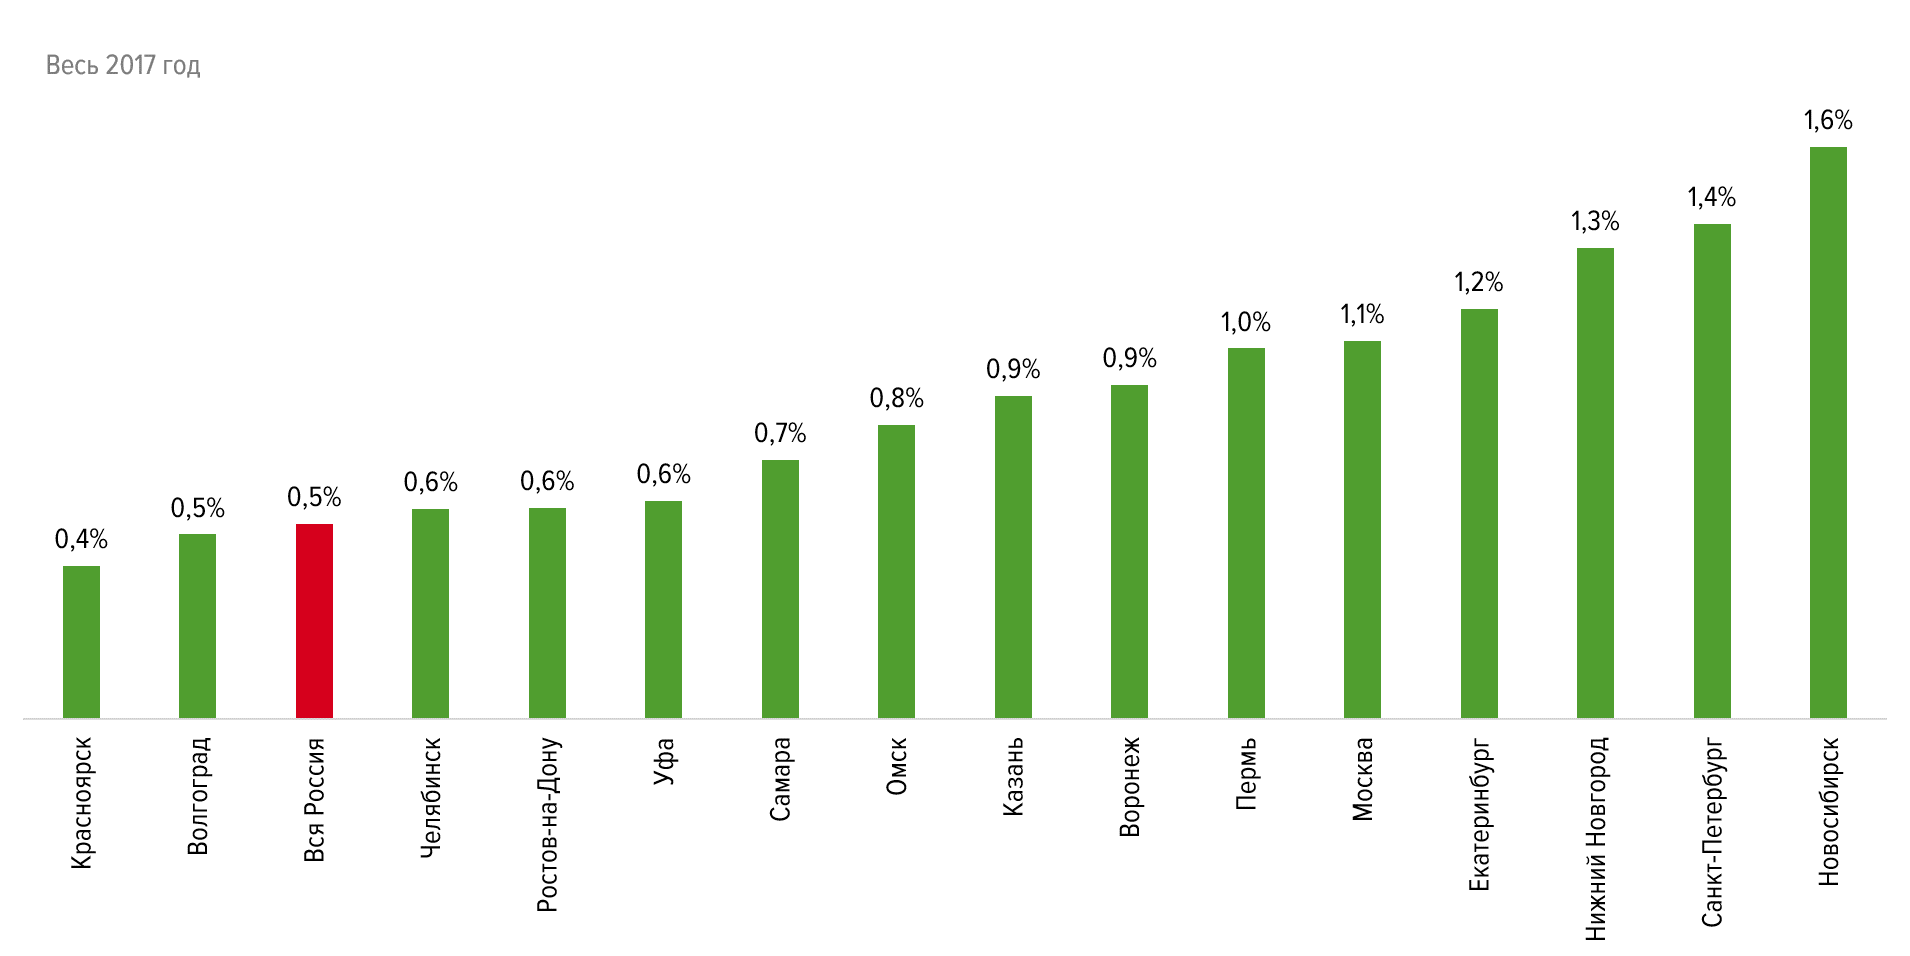
The share of vacancies for Java-developers of the total number of vacancies by region
Again millionaires, the whole of 2017. It works like this: in Novosibirsk, in one year, 1000 vacancies were placed (for sellers / hairdressers / postmen, etc.), out of this thousand - 16 vacancies for javists. In all of Russia, Java developers account for 5 out of 1,000 vacancies. For comparison: a waiter — 17 vacancies for every 1000 of all vacancies in the country.
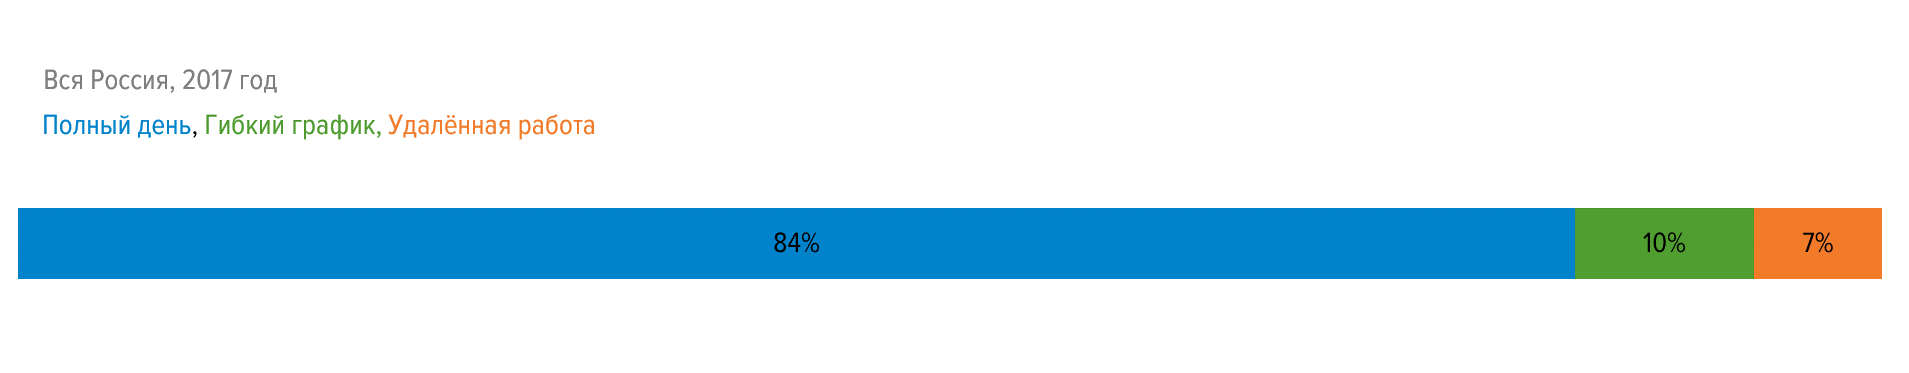
Employment rate by type of employment
Taking into account the specifics of hh.ru, the distribution does not claim to be objective regarding the situation in Russia: in the service database, 84% of all vacancies for javista are full time. However, an interesting fact is that the average salary in vacancies of various types: a full day - 114,424 , a flexible schedule - 110,081 , distant work - 115,485 . In rubles. All Russia.
Distribution of vacancies by required work experience
The required experience throughout Russia - almost half of employers want to see javistes with relevant experience from 6 years. Most likely, in practice, questions of experience are solved case-by-case not in years, and job creators use default gaps to filter junior / middle / senior. There are already data for 2018.
Salaries depending on work experience
Those are the numbers that are not in all the vacancies. Take the ranges of experience for the usual junior / middle - it turns out well and clearly. Below in the article there will be salaries at levels that are calculated differently and reflect the situation a little better specifically for large companies. What is quartile - shortly .
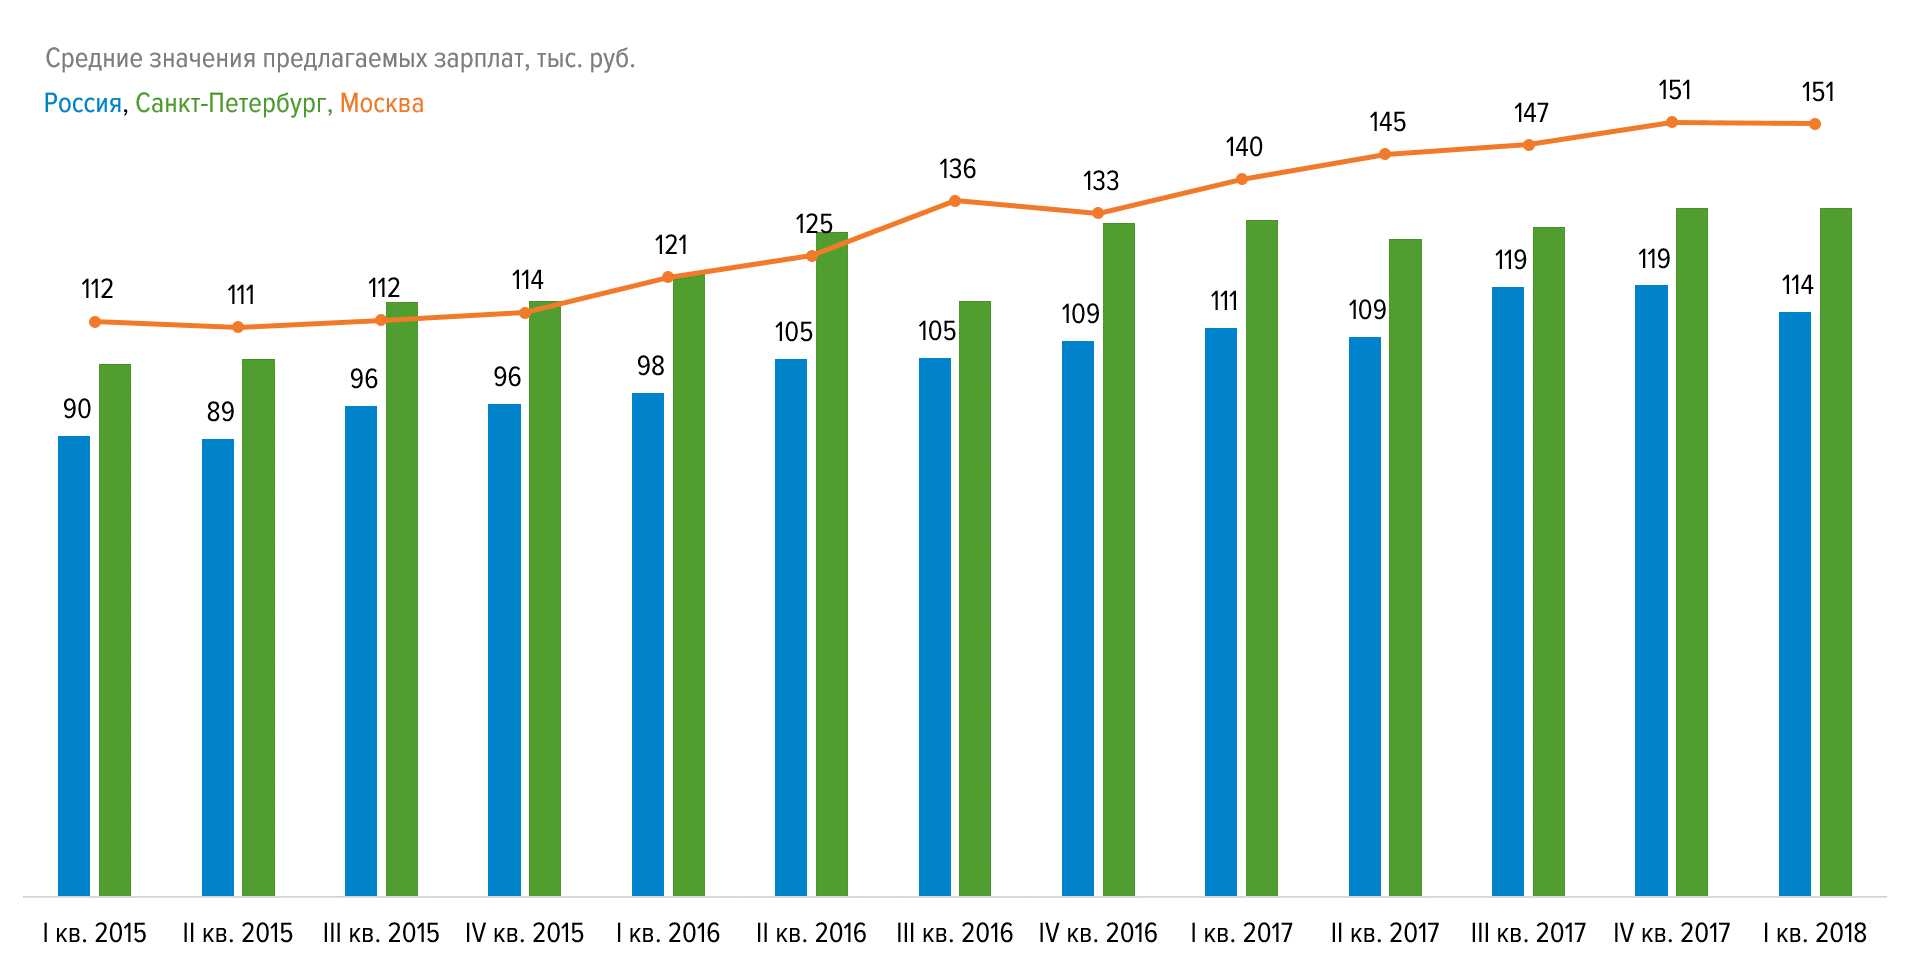
Salary dynamics in Java developer jobs
There was a time, the average salary of javists in Petersburg was higher than in Moscow. From the same 2016 (see the dynamics of vacancies ), along with the number of vacancies, wages began to grow, almost steadily up to the present.
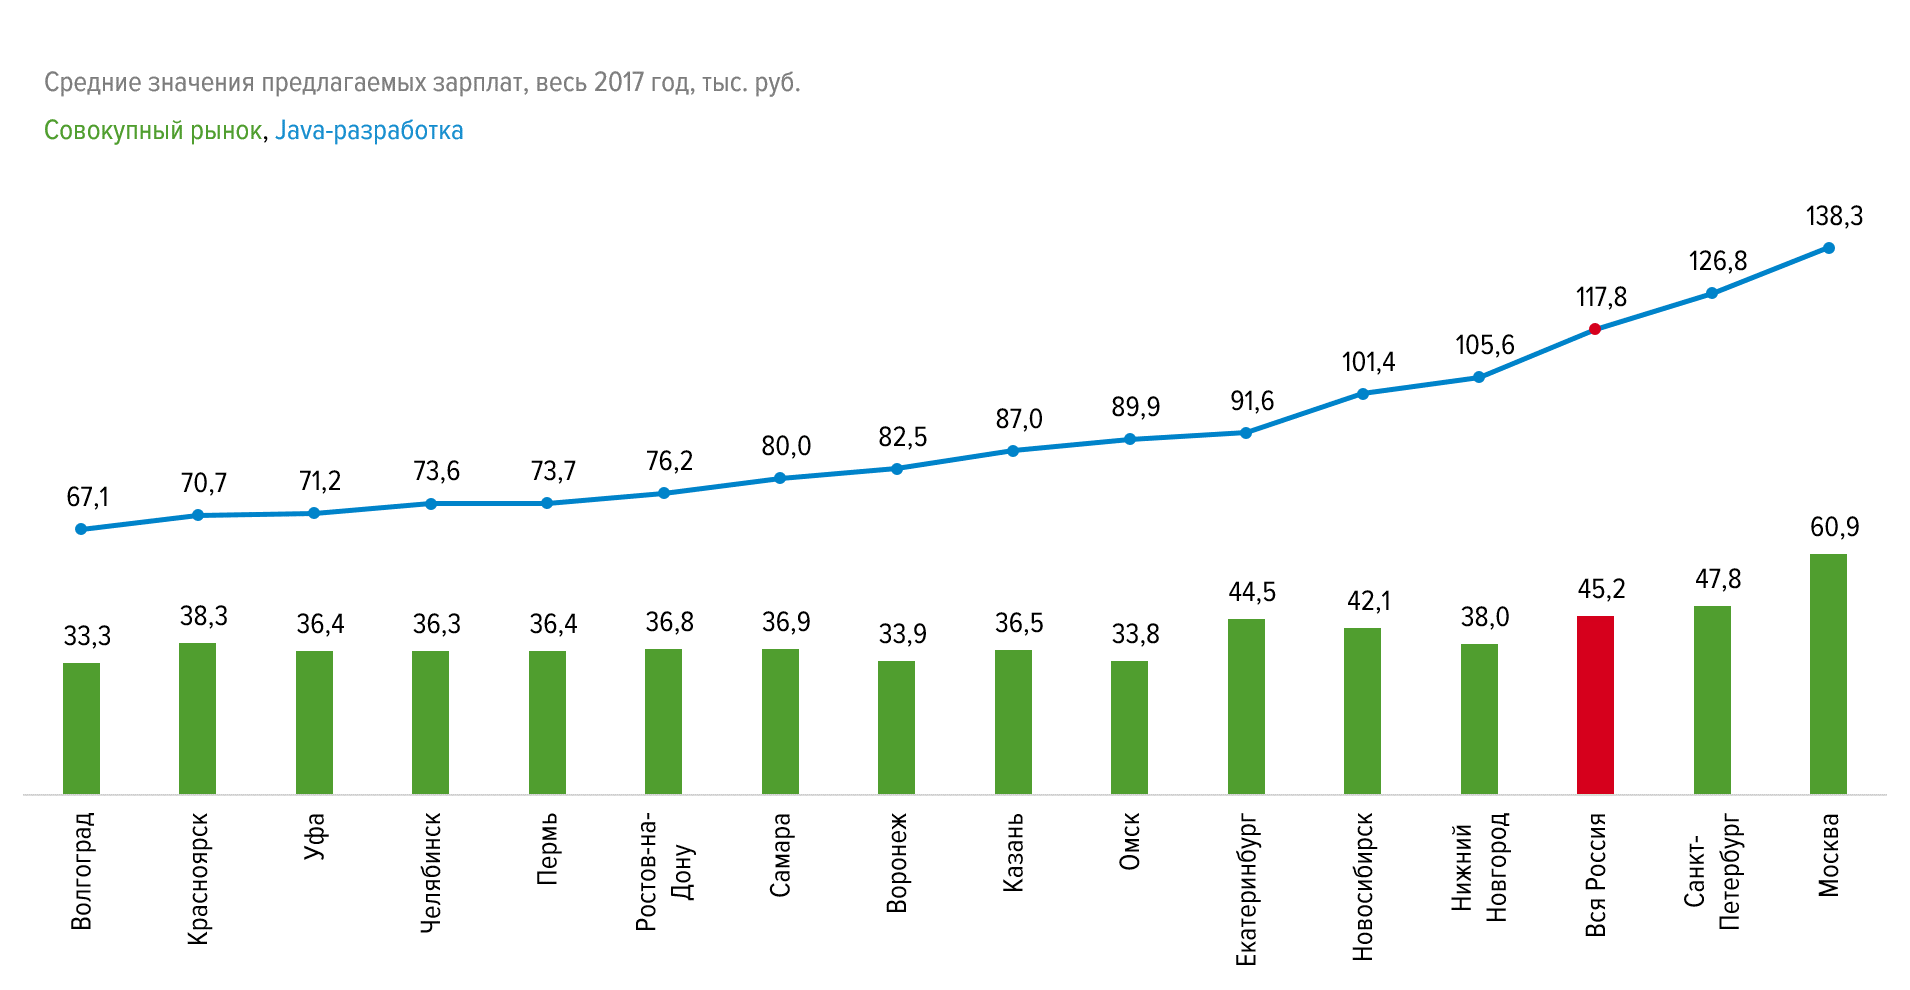
Proposed salaries in million-plus cities
Here is a comparison of average salaries for all vacancies in the region in general with wages in javista vacancies. Indicative: in 2017 in Russia the average proposed salary is 45k on average in the market, in Java - 2.5 times more.
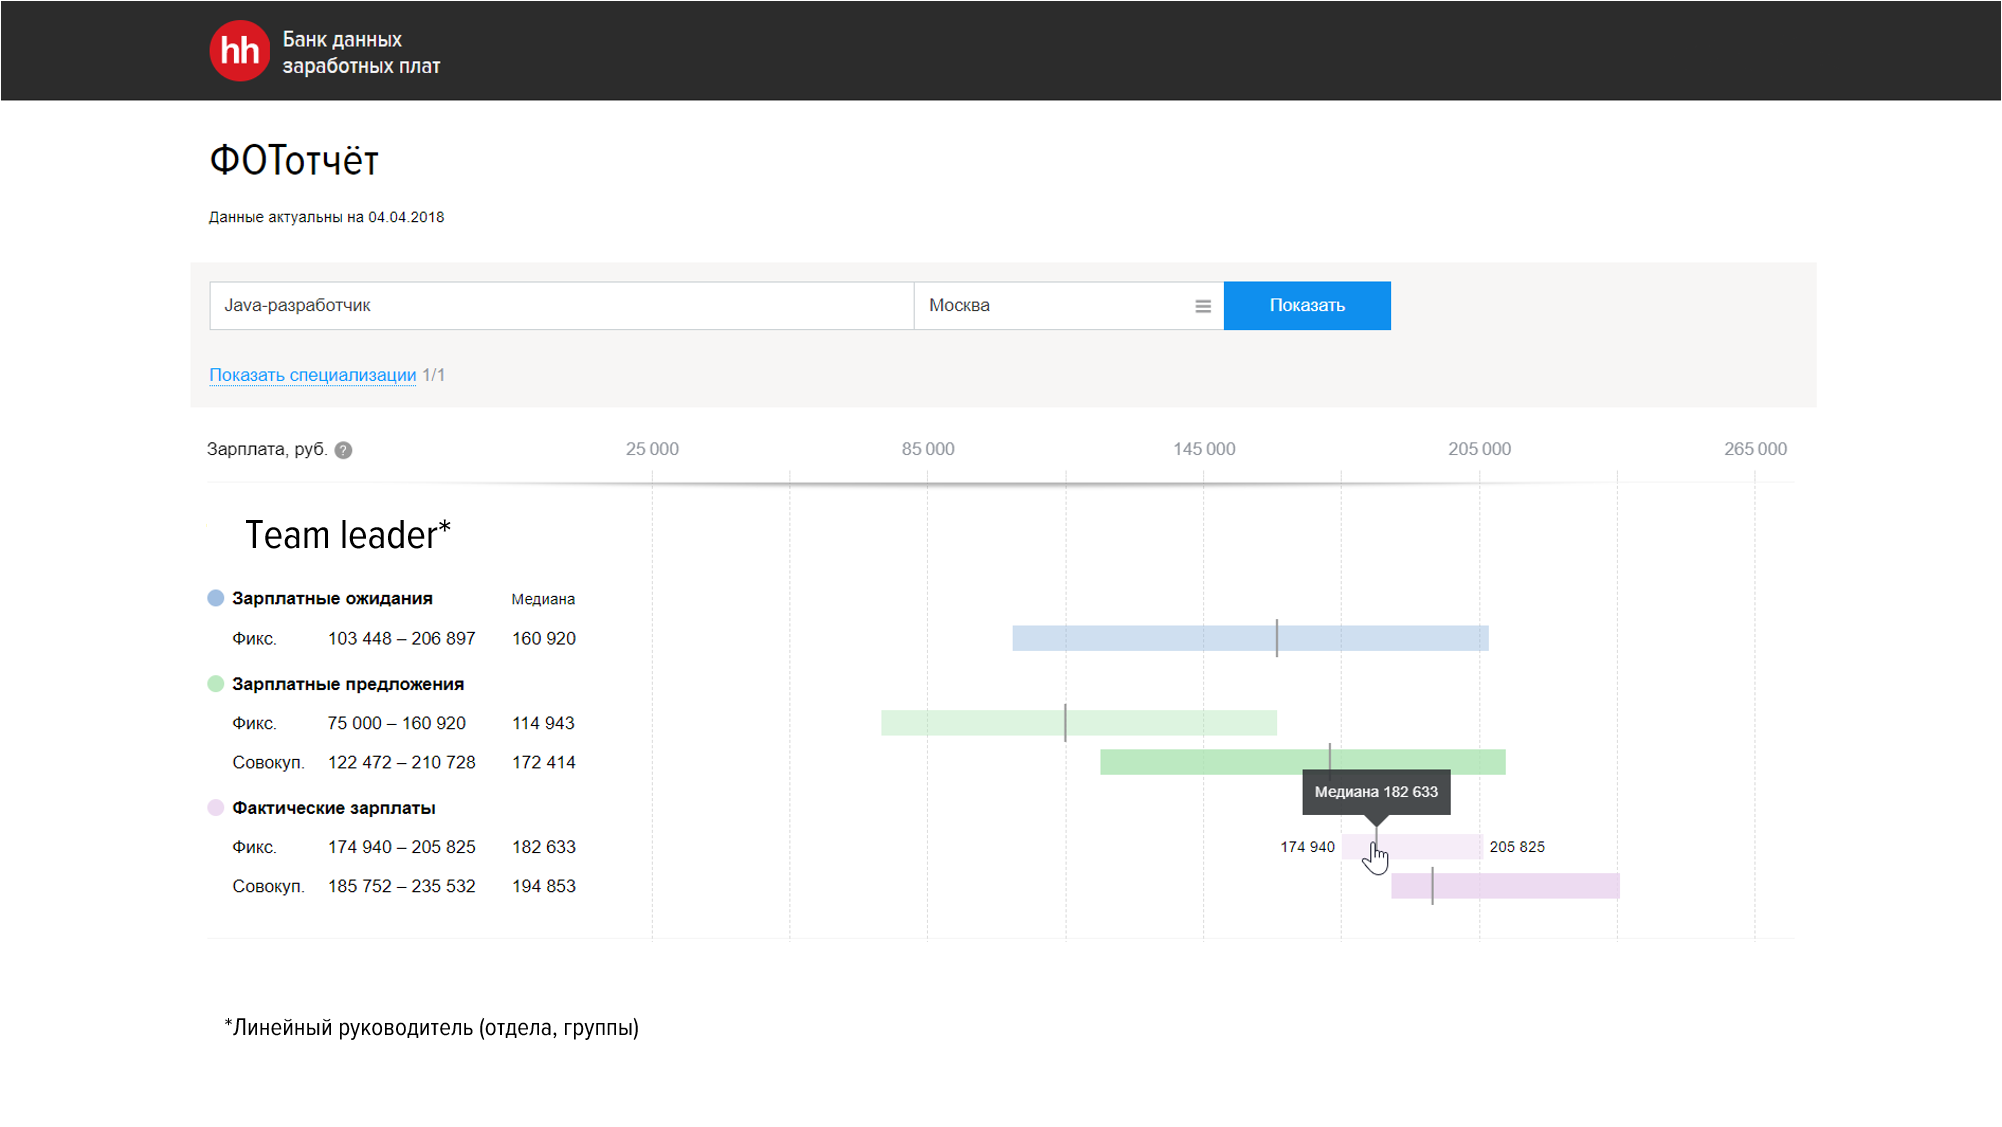
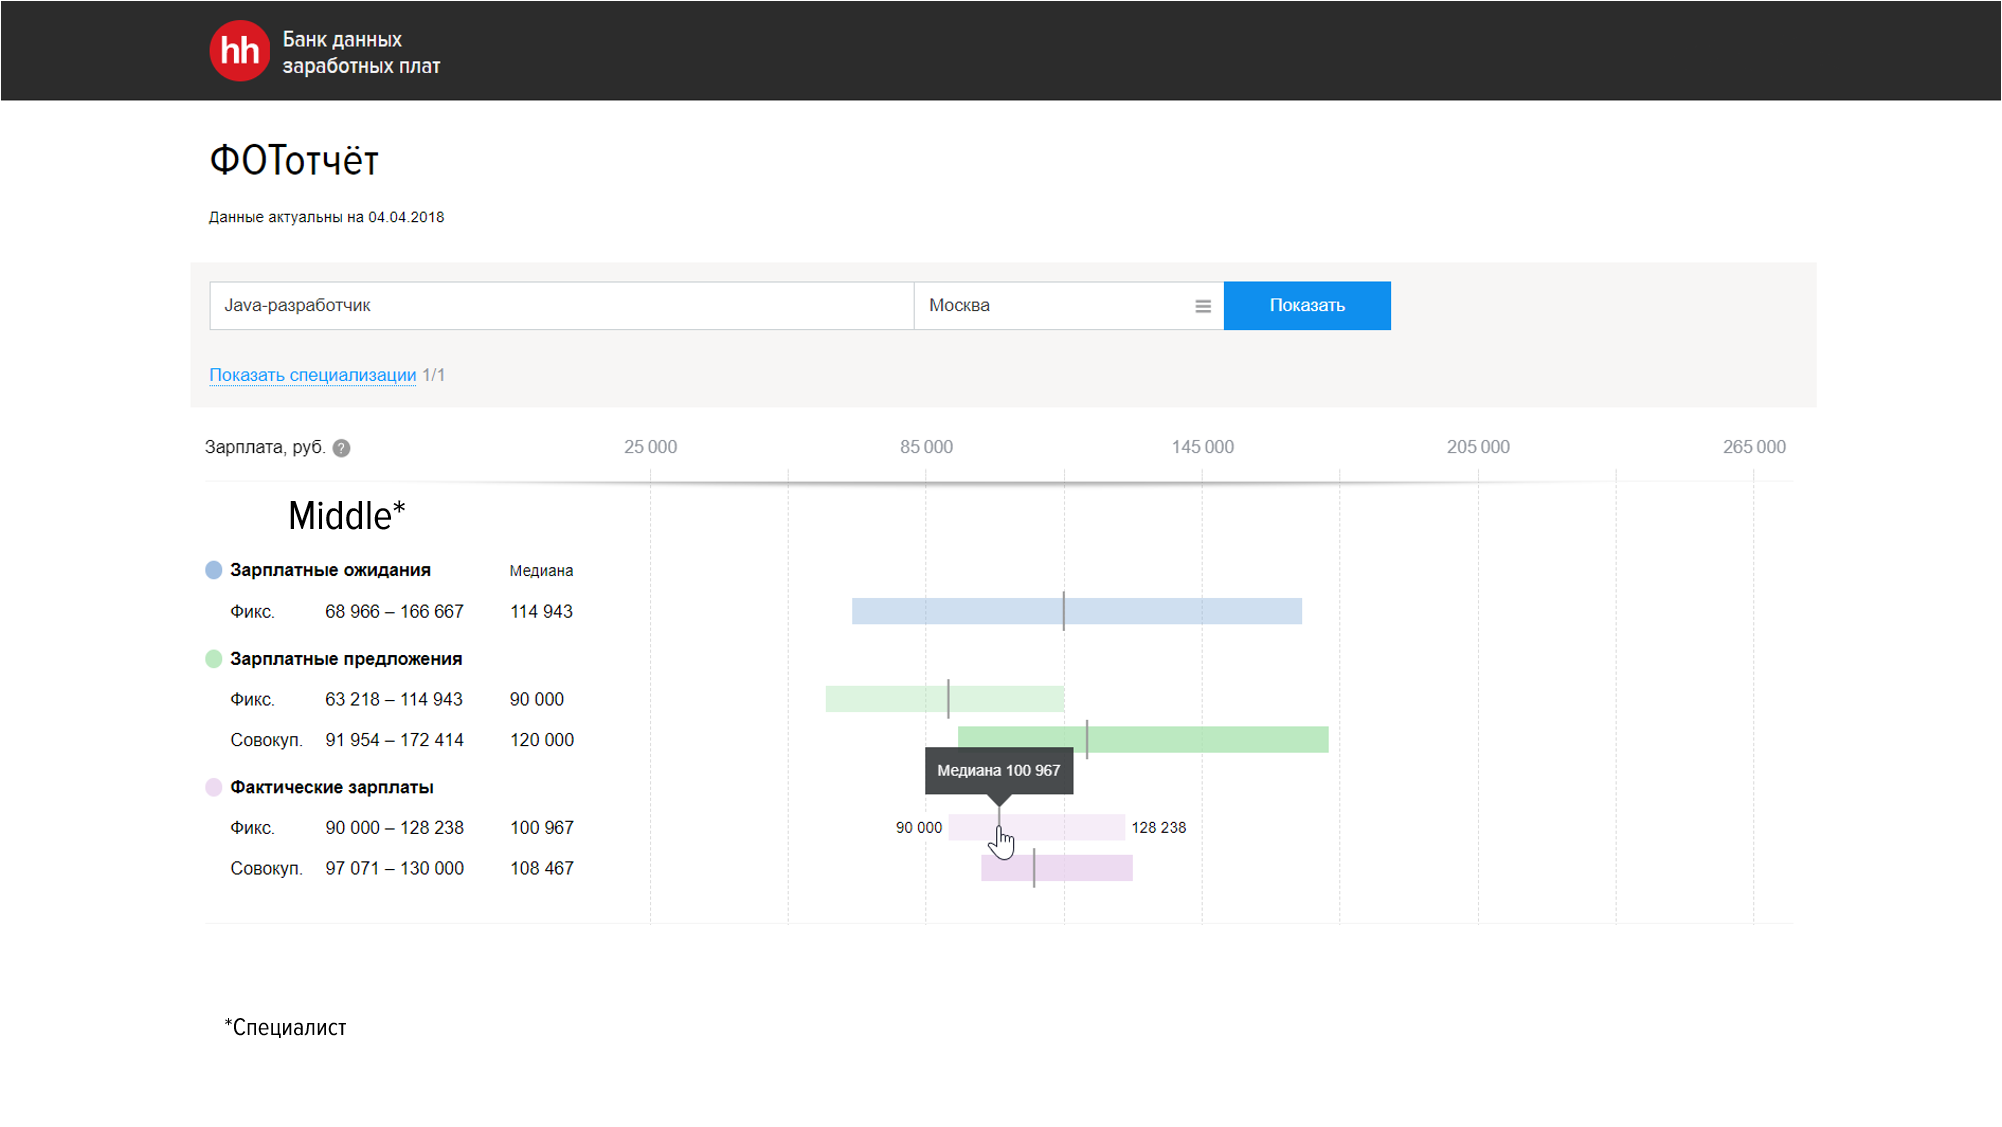
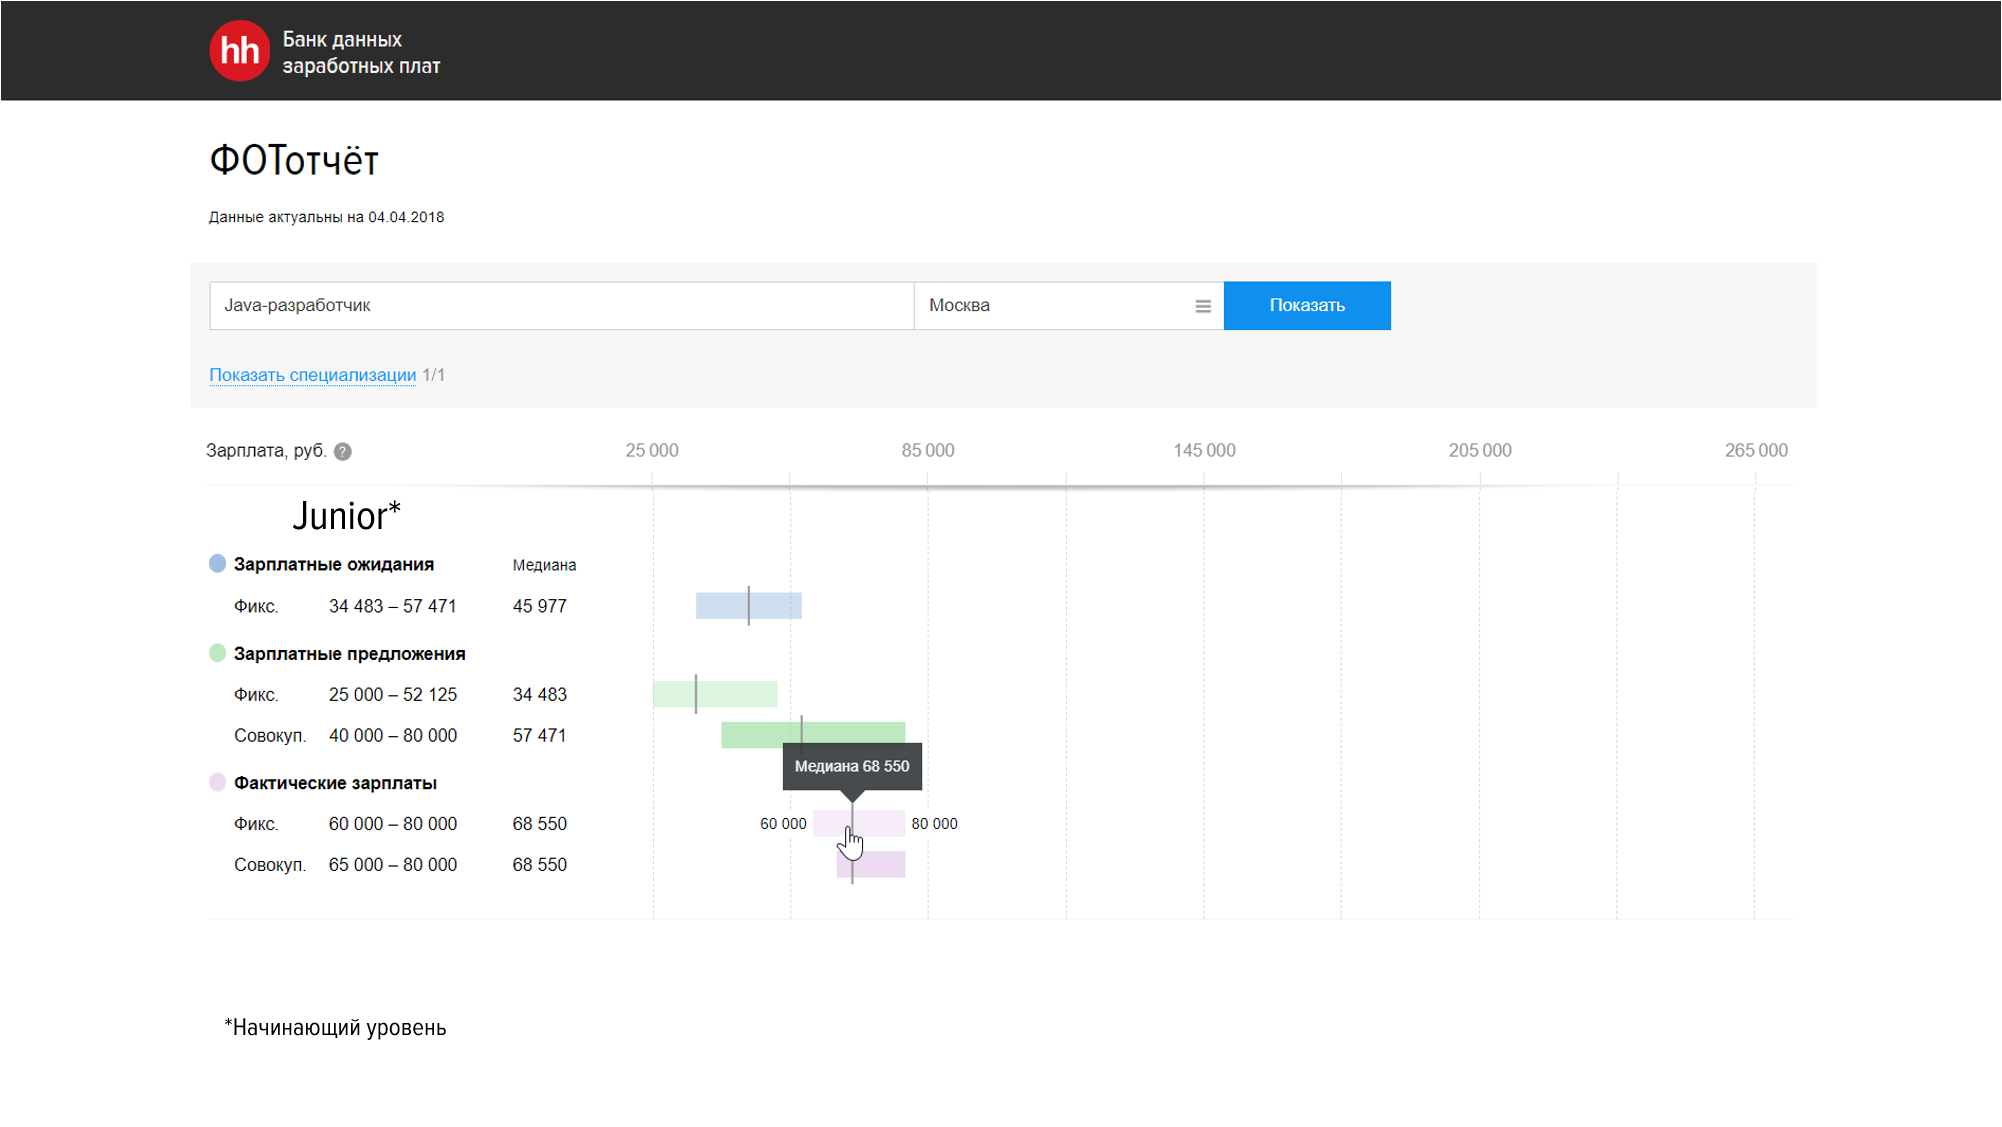
Salary Data Bank
Hh.ru has a project (not PR for the sake of, but for use - it’s worth clicking only if you want to look at the demo or consider it for a company), its essence - companies provide actual wages of their employees, in the total sample salaries are depersonalized. The companies themselves are tied to the industry, region and number of employees, type of capital, etc. Salaries are tied to the professions and position level. At the exit, the project participant sees which companies in the industry have already provided data, selects a region, a specialization, and a professional area - as a result, a report is generated with the total value of salaries in the sample.
Below are screenshots of the bank by a Java developer in Moscow, 4 pcs. by levels.
Team leader
The median salary for a Java tmlid in Moscow is 183k. The delta of the range of actual wages is curious, with expectations from resumes and job offers. The ranges themselves are interquartile range . I will clarify that salary expectations are the numbers that applicants indicate, salary offers are numbers from vacancies, and actual salaries are bank data.
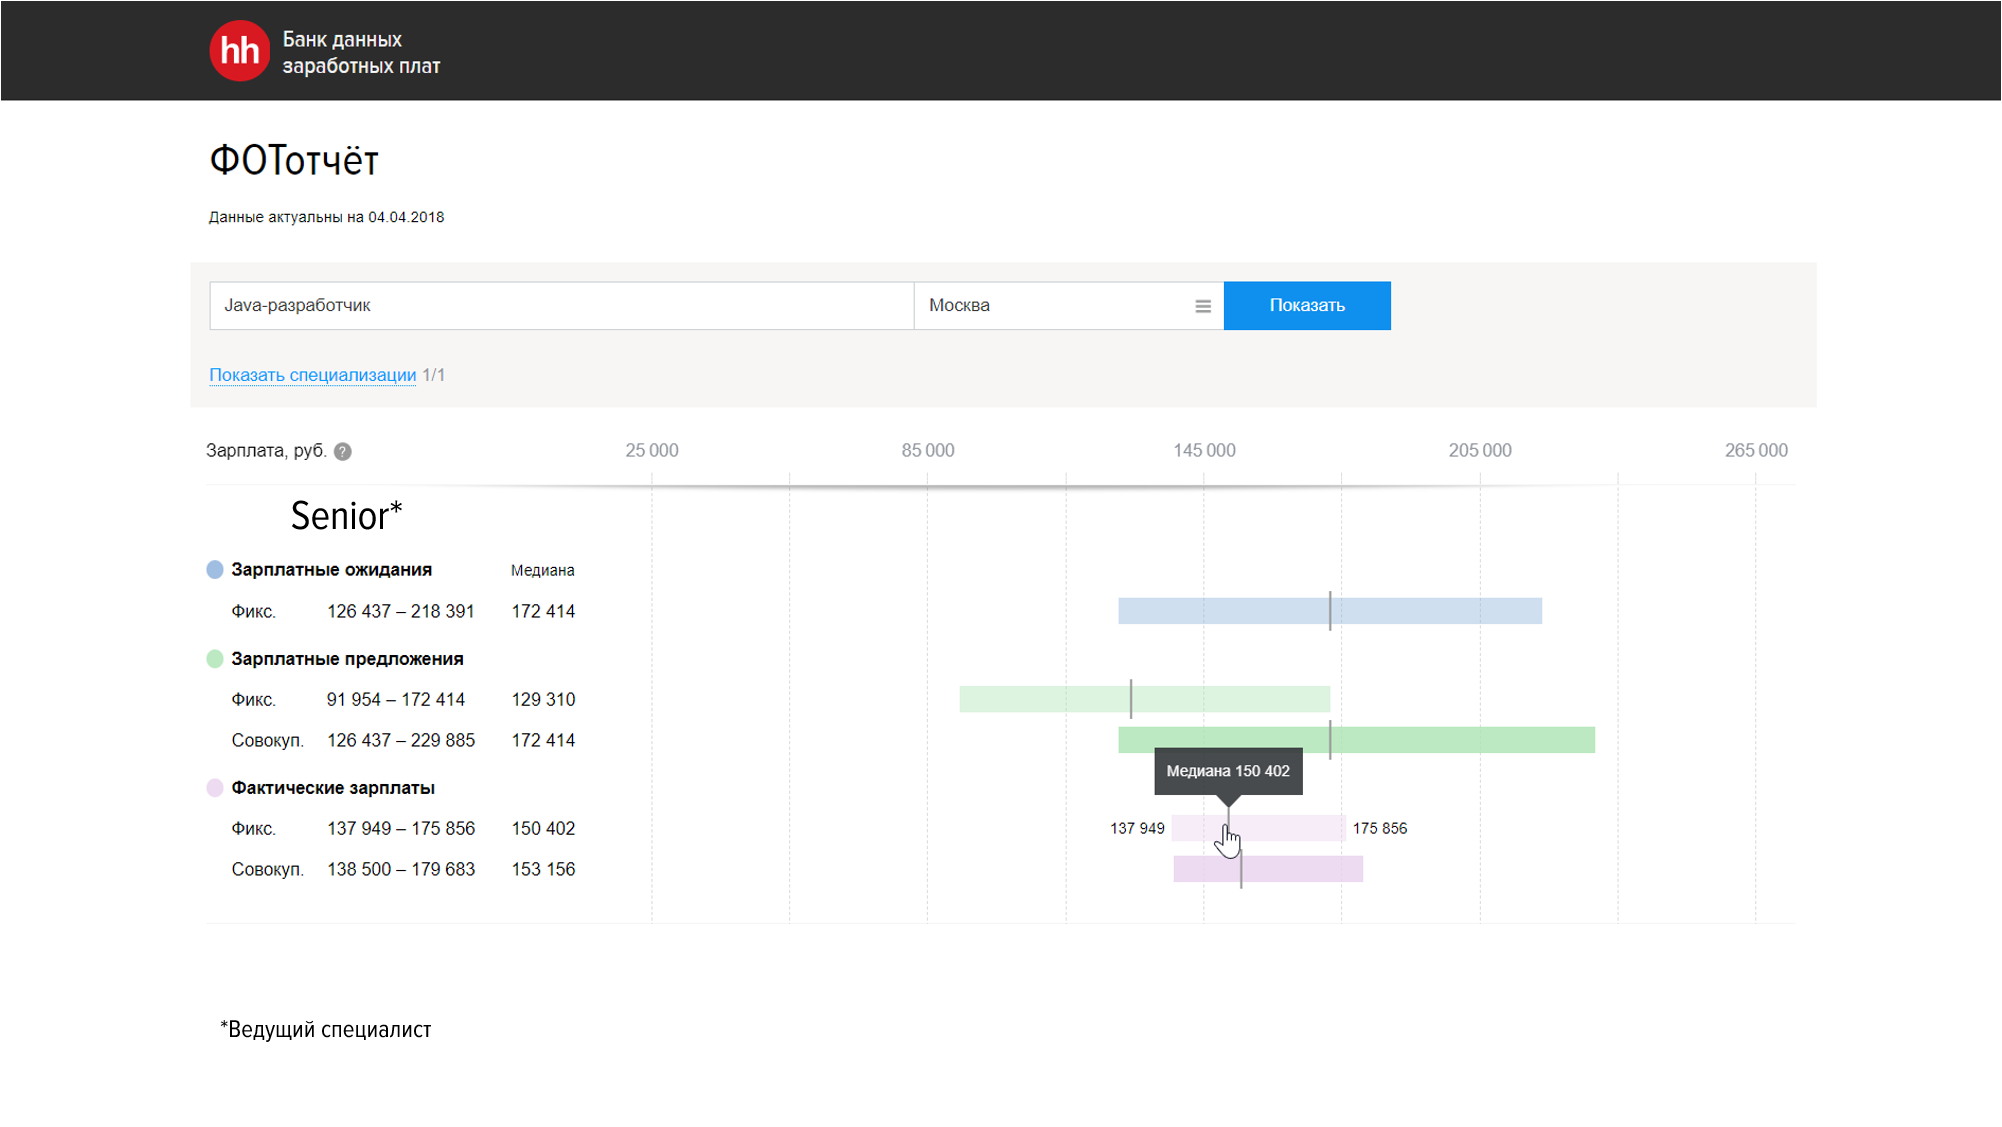
Senior
The "seniors" median values of actual wages are still lower than offers and expectations.
Middle
If you are middleware in Moscow on Java - this is about a hundred. More is better.
Junior
Fix for June in Moscow - 34k rubles, or the average salary in Volgograd.
Summary
According to the summary of data quite a bit, however. The filtering method is the same as for vacancies - names and key skills mentioning Java / Java dev and so on.
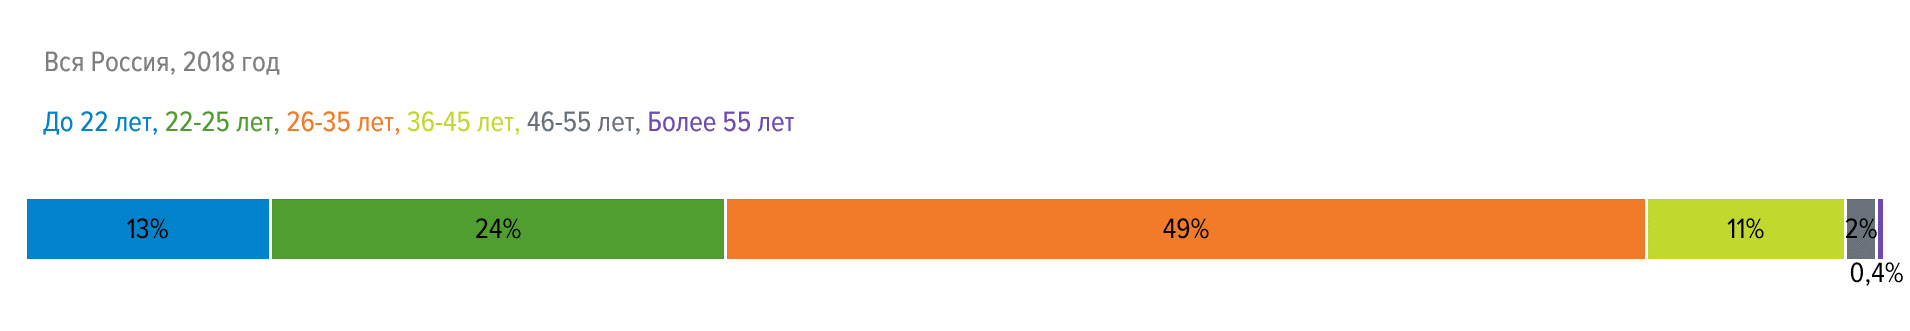
Distribution of resumes by age
Half of all javistes are between 26 and 35 years old. As in the case of salary in vacancies, age can be not advertised, but in this case the effect of missing data on age on objectivity is a moot point.
Distribution of resume by work experience
Not the most revealing statistics. The whole experience is taken into account, regardless of whether Java or non-Java, development or non-development.
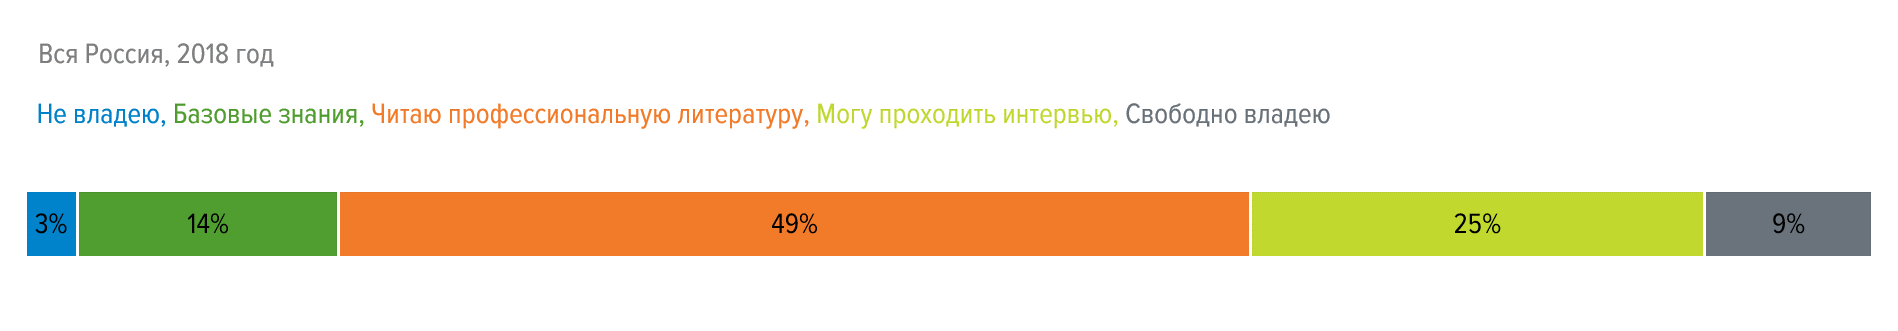
Distribution by level of proficiency in English
Still, without basic knowledge, it is quite difficult, English - after all, it is to mandatory key skills, regardless of the stack, to googler - advanced.
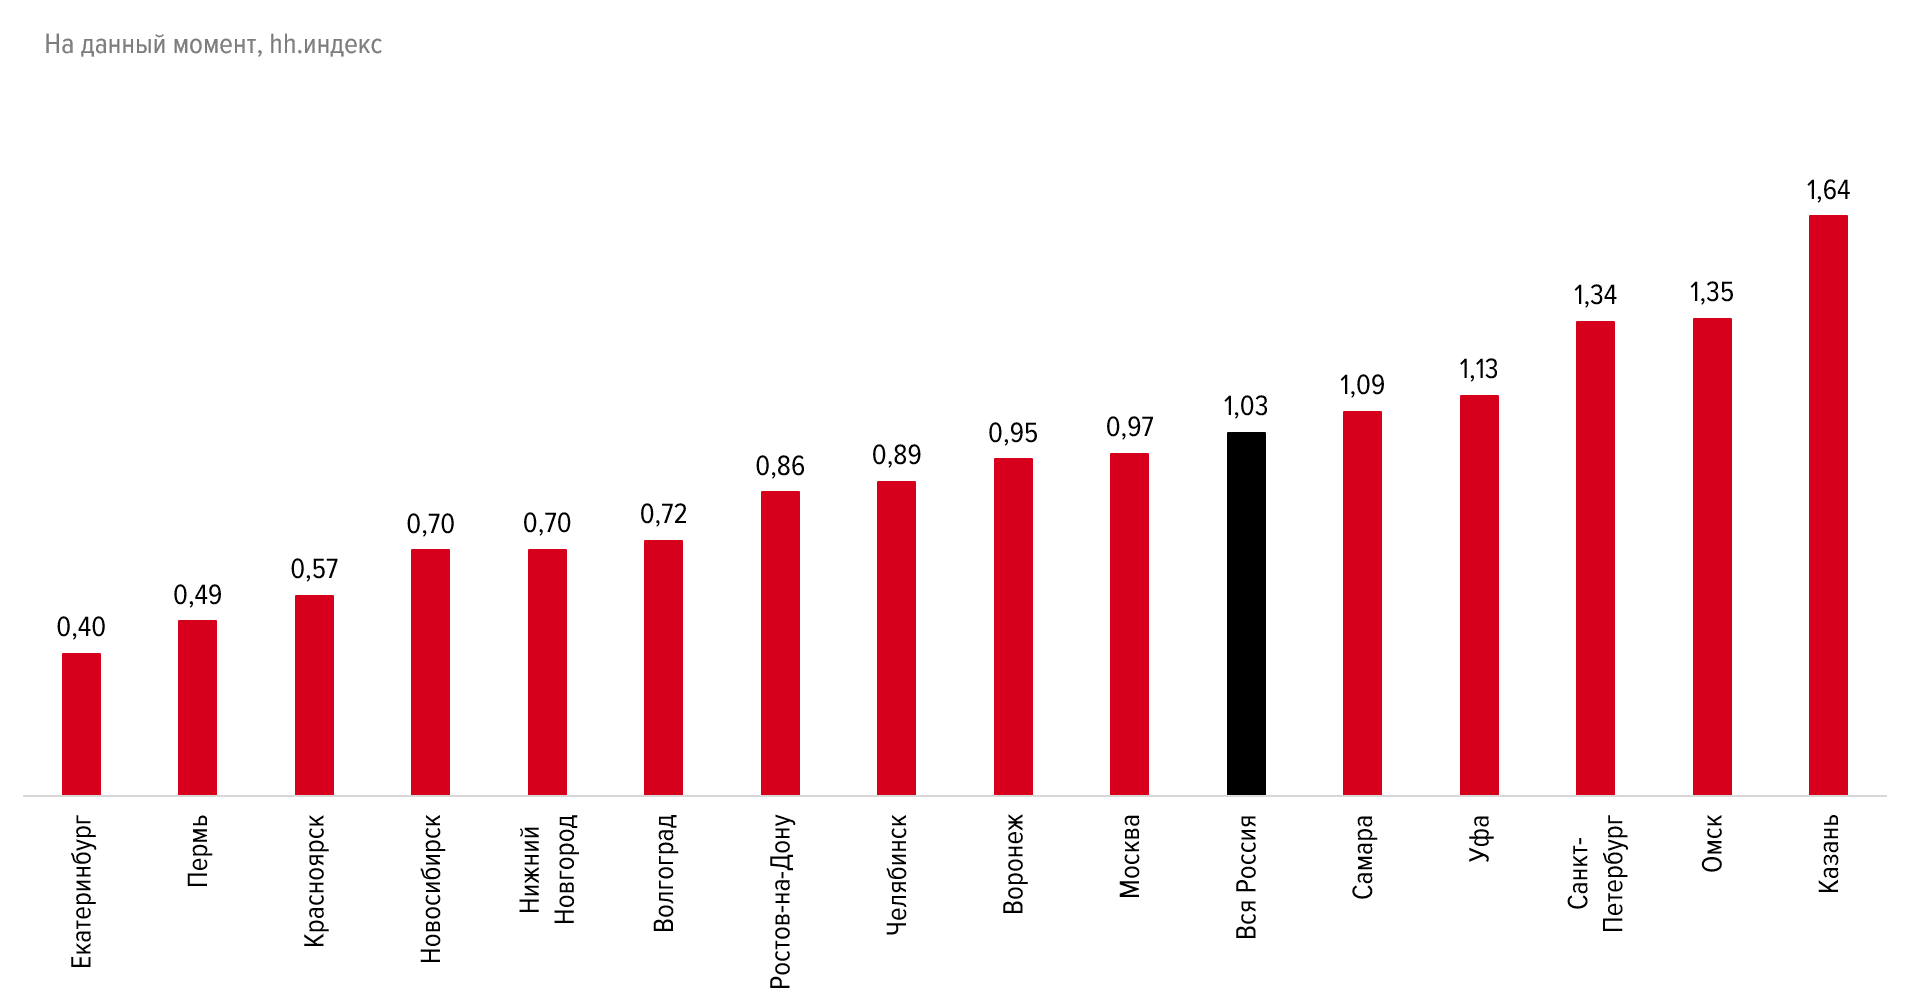
Number of resumes per vacancy in million-plus cities
hh. index shows competition - the ratio of the number of active resumes and vacancies. The higher, the more unpleasant for applicants. On average, in Russia, in the aggregate market, hh.index is 7. That is, in the country, there are 7 job applicants in the general labor market, and a little more than one Java developer per vacancy in a Java developer.
Final
Below is everything that is not related to the categorization above or specifically to Java, but it does occur.
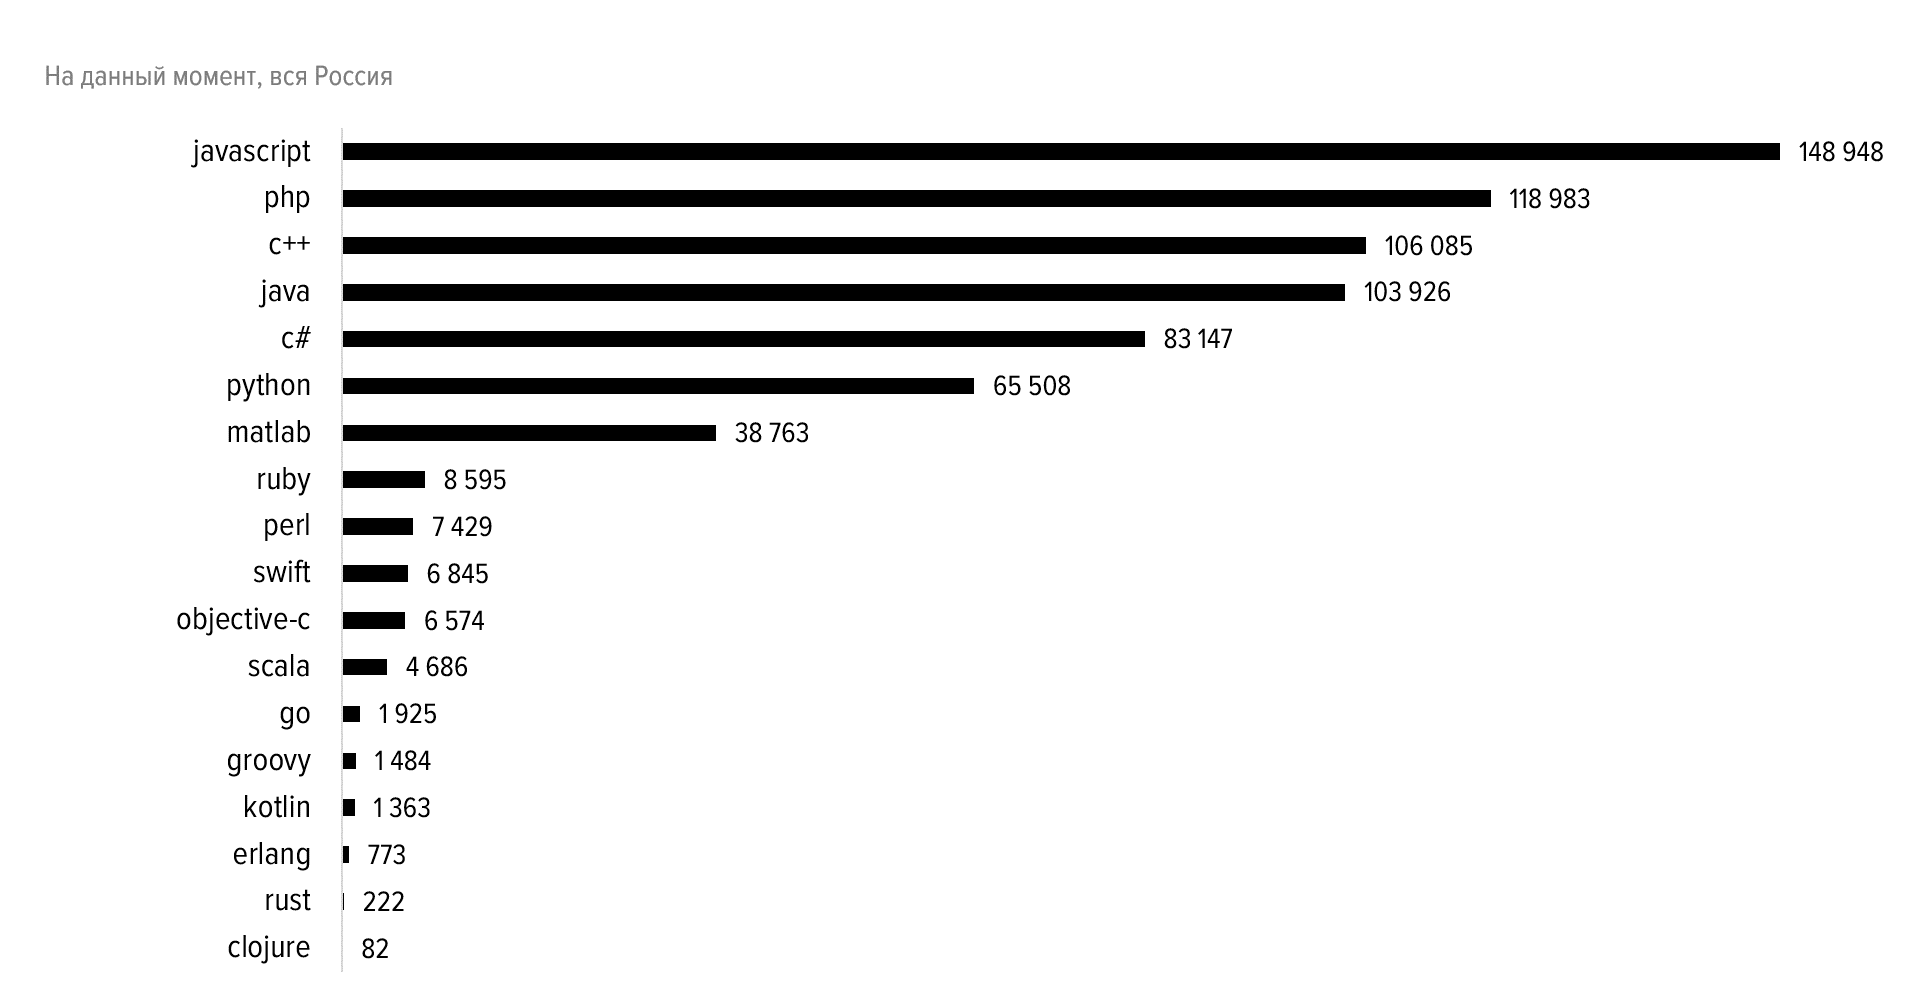
Number of summaries by programming languages
All resumes are taken into account here, where last_change_time is from 2010, any of the programming languages are in the title, or in key_skills.
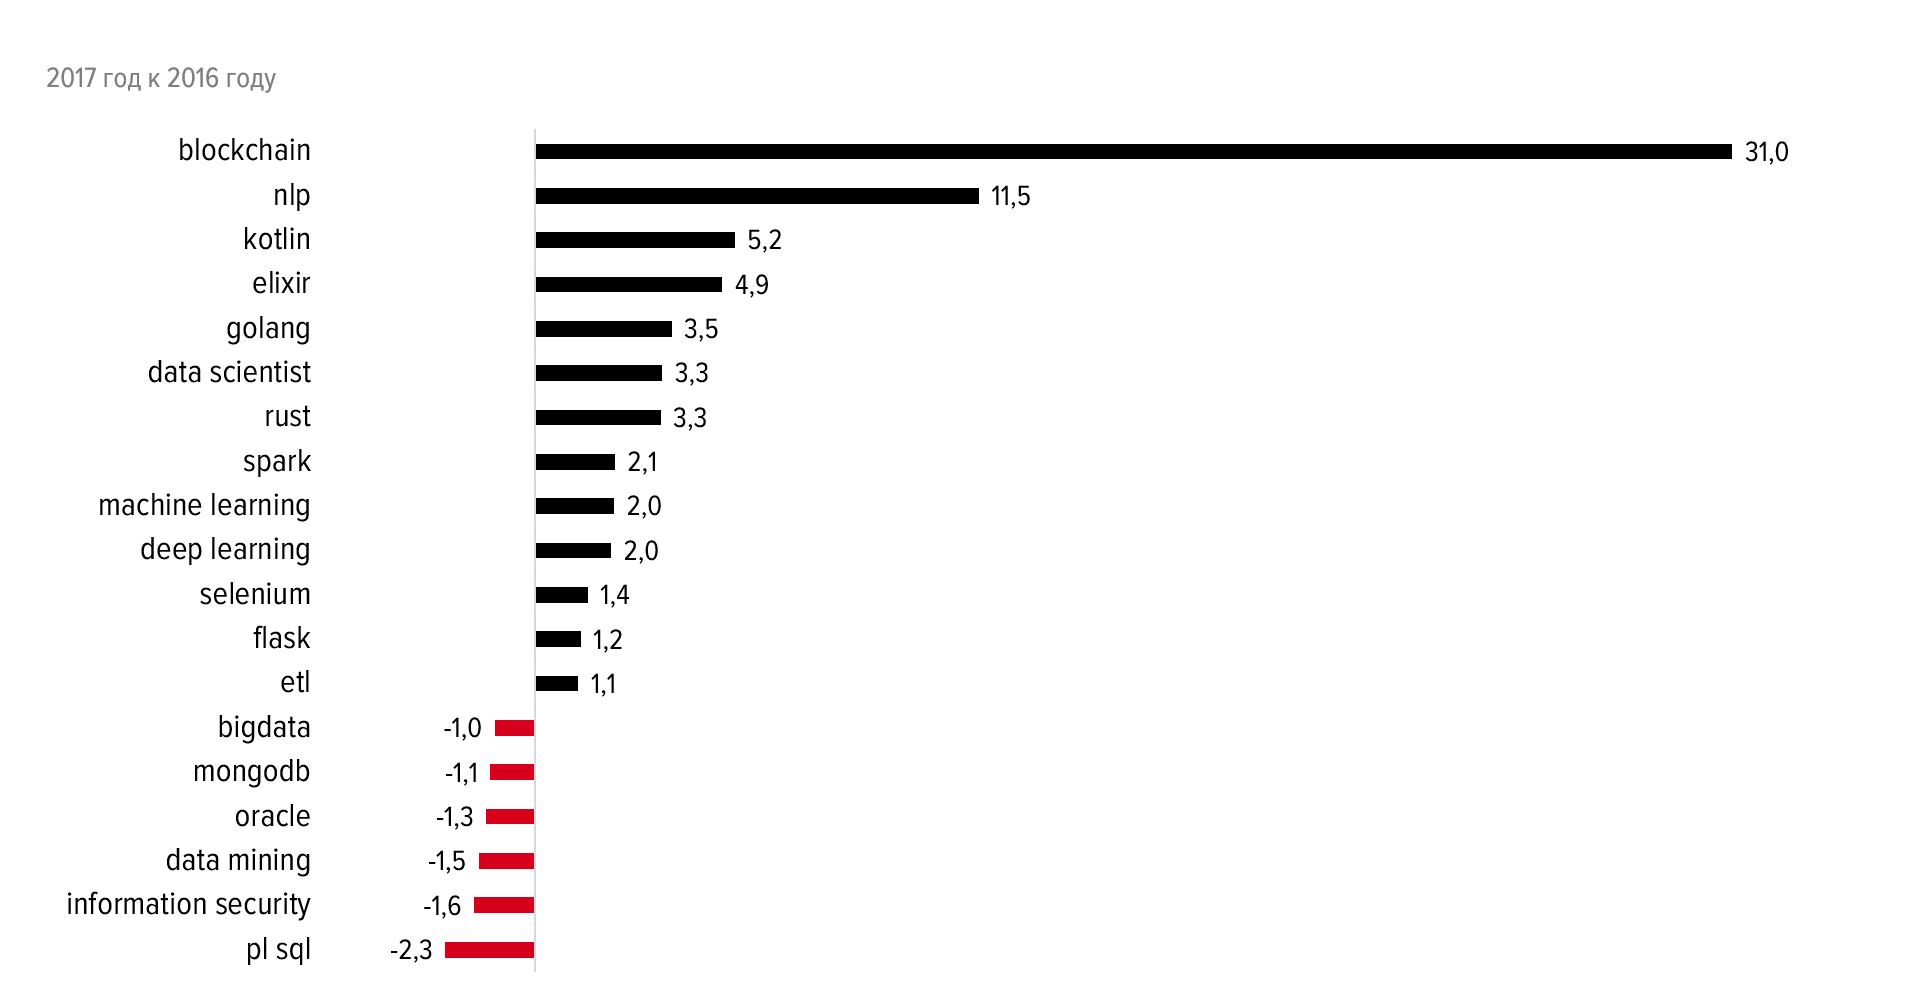
Change the number of requests in the search for a search
The ratio of the number of requests in the job search last year to the year before last. Blockchain at the hearing, of course.
Percentage of key requests from the total number of appeals of job seekers-developers to search
Here we took the number of all requests to search from authorized applicants, in the summary of which there are development / developer / developer keys, etc., and we calculated the ratio to the number of requests by keys below.
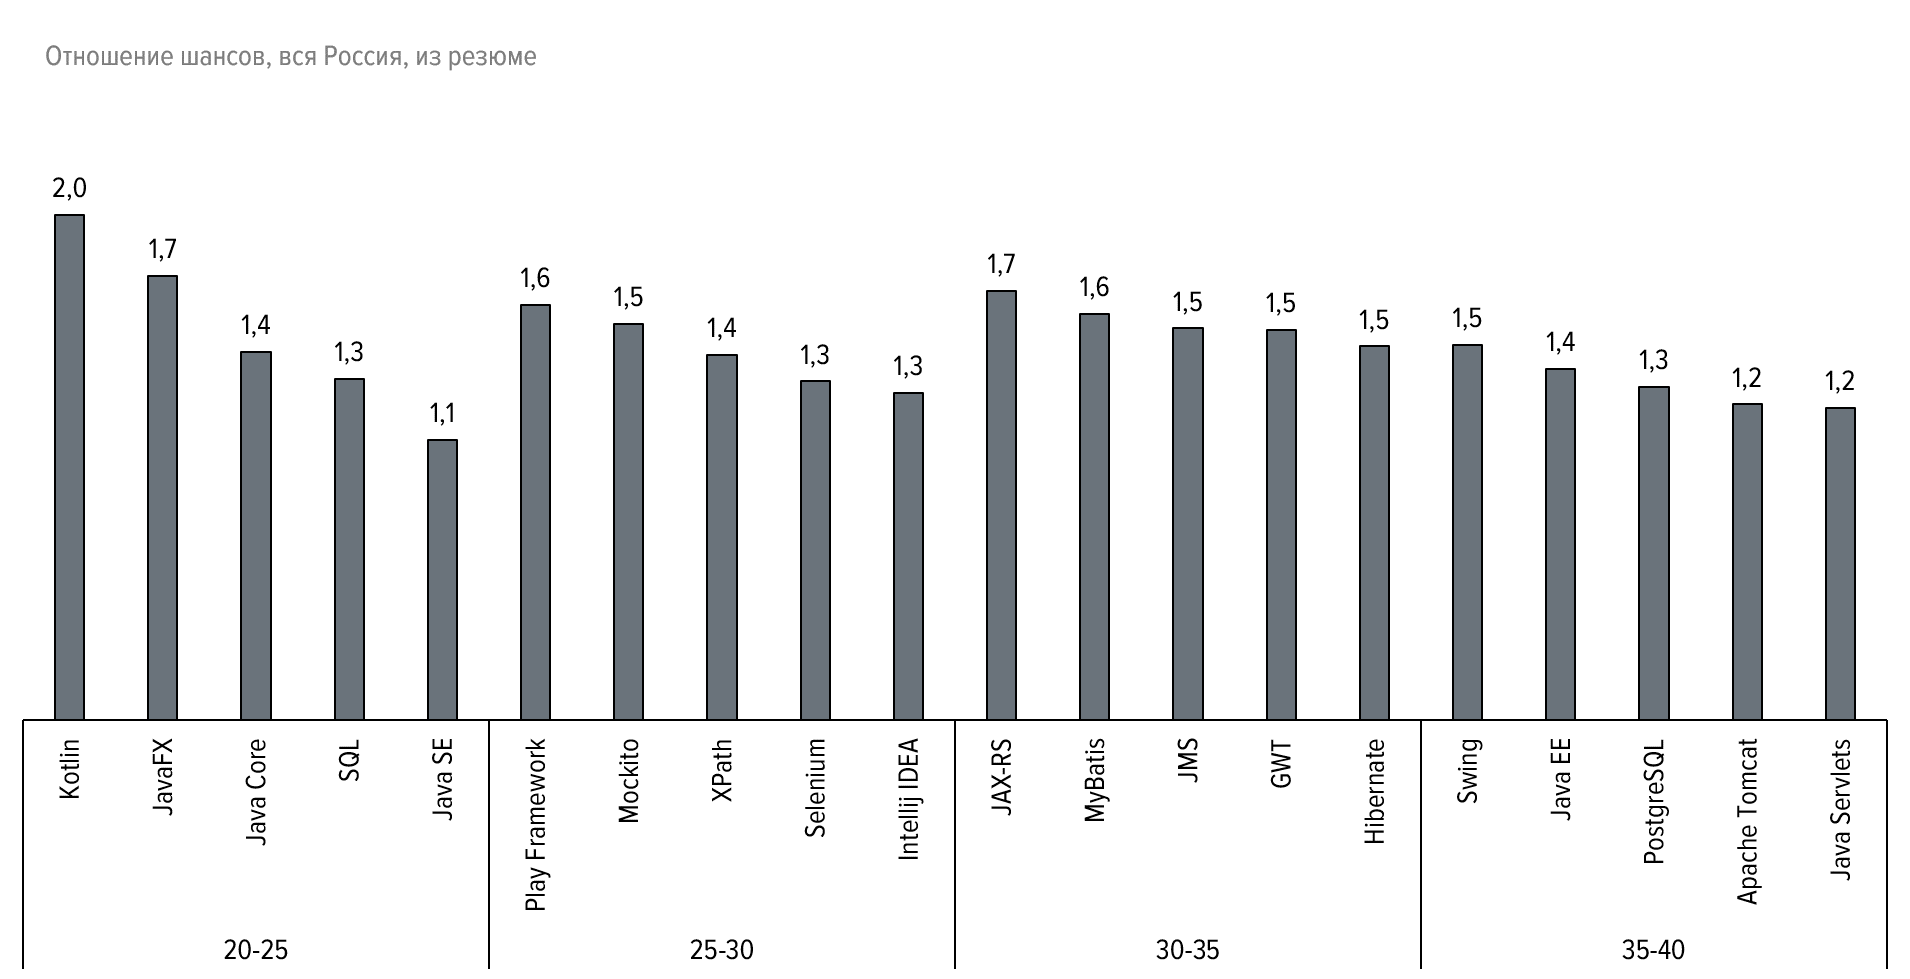
The most popular key skills among specialists in age groups
It shows how much the skill share in the age group differs from the same share in the remaining sample. Well, practically. Read more about the interpretation of the odds ratio .
Most popular key skills among work experience professionals
The same as above, only in grouping by experience.
That's all. The data given in the article, we sovushkasolnce collected by Jpoint 2018. A month later, we woke up and made a post.
Comments are welcome. Thank!
Source: https://habr.com/ru/post/359036/
All Articles