Cross-platform SNMP traffic monitoring utility without dependencies and GUI availability
Hello, Habr!
In the course of its work (administration of active equipment), I was faced with the need to quickly receive online data (preferably with a schedule) of incoming / outgoing traffic on the network interface via SNMP.
At the same time, such equipment is always found that is either not entered into the monitoring system, or requires viewing the statistics more than once a minute (like rrdtool).
And in the arsenal, often, only the server console on Windows or Debian.
And then there was the idea to make a small utility with the following features:
- cross-platform;
- no dependencies (static linking of libraries);
- plotting graphs online;
- plotting in the console (pseudo-graphics - thanks, curses);
- templates for special OIDs (while one for ifInOctets and ifOutOctets);
- the ability to draw several custom graphs.
While the alpha version of binaries. Placed here on Sourceforge .
Tested on Windows 7/8/10 32-bit and 64-bit. Debian and Ubuntu.
Eats data SNMP - COUNTER, INTEGER, GAUGE.
Examples of running the utility.
List of interfaces with OID.
wtraf 10.1.16.2 -l
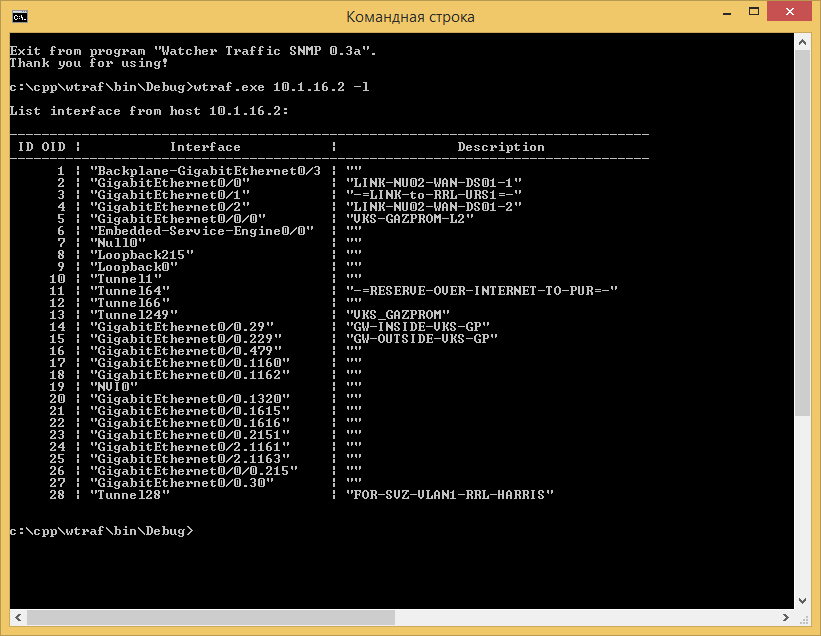
Now we know the interface OID (our number 3) and run.
wtraf 10.1.16.2 -i 3
Result on Windows 8 in a small console window:

Result on Ubuntu 18.04 LTS in full screen:

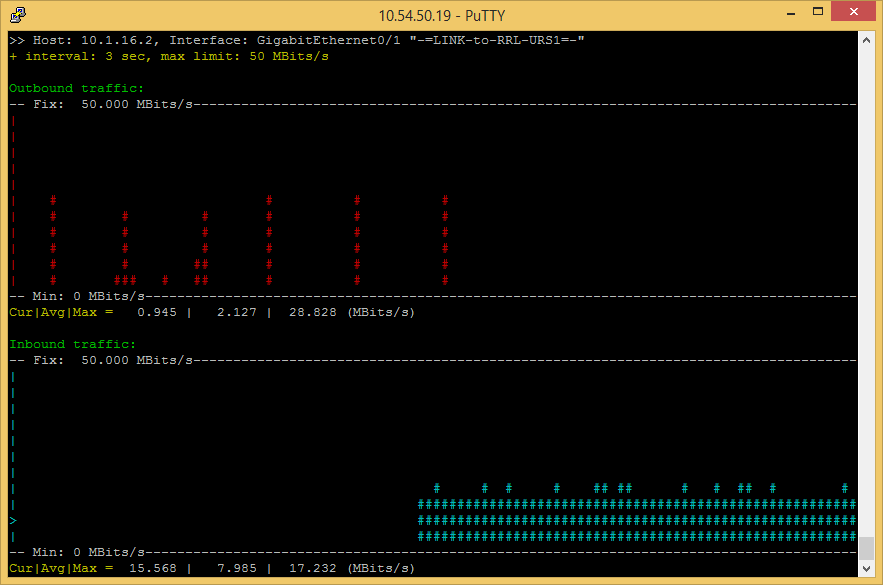
We start with the data collection interval (every 5 sec.) And limit the bandwidth to 50 Mbps.
wtraf 10.1.16.2 -i 3 -n 5 -m 50
The result is in PuTTY (note - for convenience of perception, the schedule of outgoing traffic flows on the left, incoming - on the right):
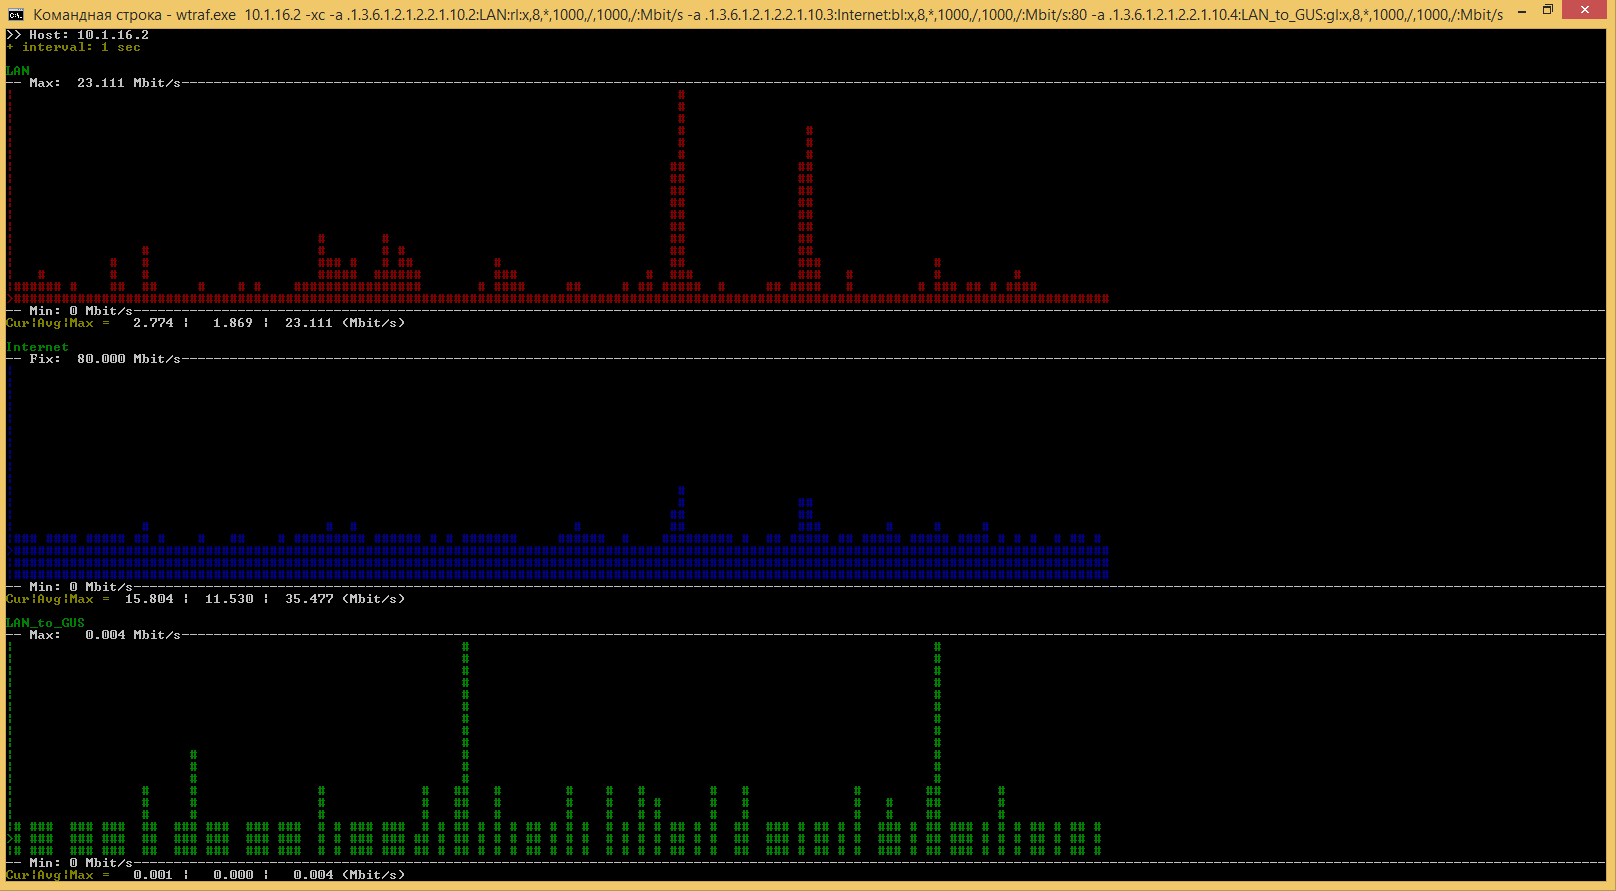
And now the most juicy. An example of custom charts.
wtraf.exe 10.1.16.2 -xc -a .1.3.6.1.2.1.2.2.1.10.2: LAN: rl: x, 8, *, 1000, /, 1000, /: Mbit / s -a .1.3.6.1 .2.1.2.2.1.10.3: Internet: bl: x, 8, *, 1000, /, 1000, /: Mbit / s: 80 -a .1.3.6.1.2.1.2.2.1.10.4: LAN_to_GUS: gl : x, 8, *, 1000, /, 1000, /: Mbit / s
In turn, I want to bring to mind the utility, it can please admins.
I would be grateful for any errors found. At the moment there are a lot of them, not everything has been paid.
')
Source: https://habr.com/ru/post/358970/
All Articles