Automatic visualization of the python code. Part three: new features of the graphical representation of the code
Links to previous parts:
An example of an environment that supports such a graphical representation is shown in the picture below.
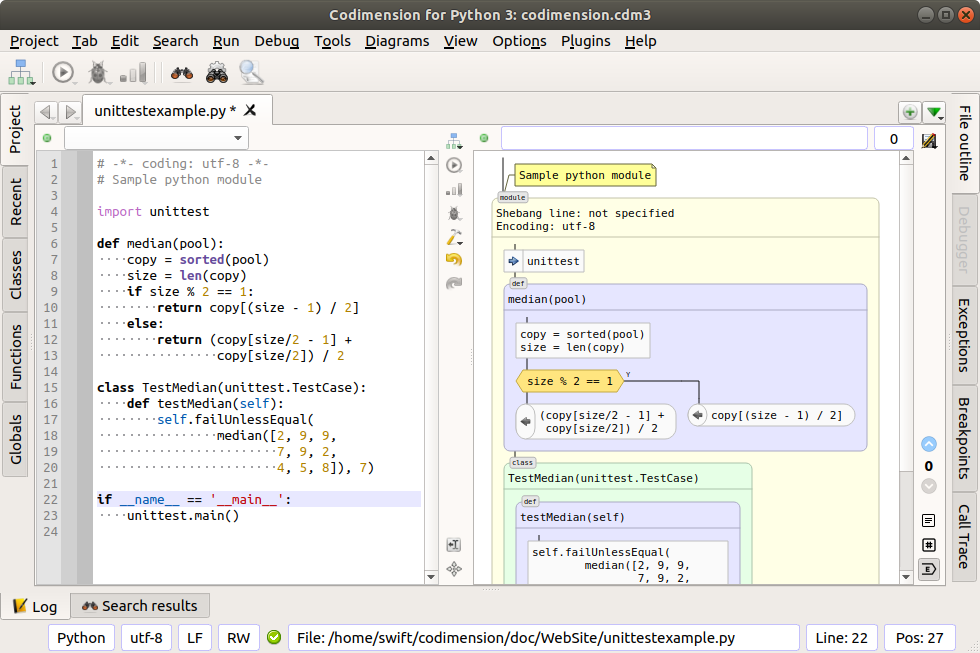
Environment that supports graphical code presentation
')
In the third part of the article we will discuss new features of the graphical representation of the code.
Since the writing of the second part, an interface has been added for changing colors used to display graphic primitives and an interface for changing text displayed by a graphic primitive. In both cases, the interface is minimalist and uses the context menu.
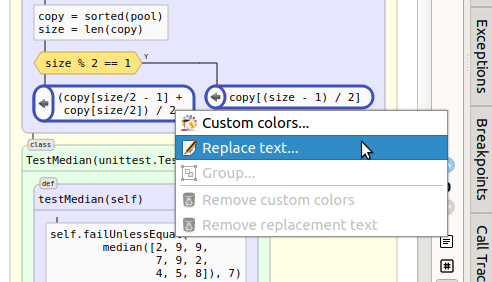
Context menu of selected graphic elements
The user selects one or more primitives and presses the right mouse button. In the context menu that appears, you can select the desired item (the availability of menu items is determined dynamically).
In the case of selecting one of the first two menu items, an additional dialog is displayed for selecting color or entering text accordingly. After the input is completed, the necessary cml comments are added / modified and the entire diagram is immediately redrawn with changes.
In the process of working with the environment, it was noticed that sometimes there is a desire to temporarily hide certain graphic elements in order to reduce the amount of information presented on the screen. This can help with certain program analysis scenarios. Of course, this functionality is fairly easy to implement for a graphical representation.
The following candidates were identified: documentation lines, comments and except blocks. To control the suppression of primitives, three buttons have been added to the graphic toolbar, each of which can be in one of two positions: pressed / pressed.
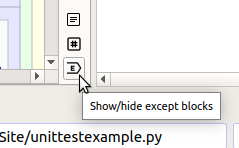
Controlling the suppression of primitives in a diagram
The buttons are independent of each other, so you can select any desired combination of suppression. By changing the state of the buttons, the diagram is immediately redrawn, that is, with just one click of the mouse, you can quickly change the number of parts displayed at the moment.
Python supports documentation strings for modules, classes, and functions. To display all of these cases, Codimension uses a “scope” primitive, in which the documentation string is located after the header. For example:
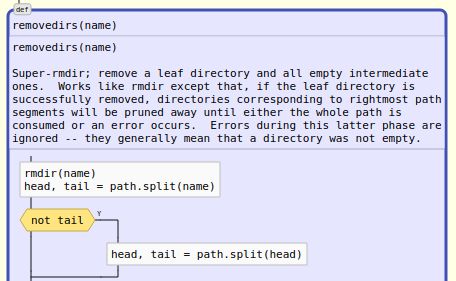
Function with string documentation
However, documentation lines are optional, and if the developer did not take care of the documentation, Codimension does not draw the appropriate section at all. For example:

Function without documentation line
When the documentation lines are suppressed, it would be possible not to draw the section, but then it would have been impossible to understand from the glance at the diagram: there is no documentation at all or it is suppressed. Therefore, such a decision was made - instead of the suppressed lines of documentation, draw a section in which, instead of the entire text, only the badge is placed. A badge takes up less space than a single line; it gives you the opportunity to immediately understand what documentation is. And allows you to easily add a tooltip for the section with the full text of the documentation. For example:
Function with suppressed documentation string
In cases where the documentation is extensive, and the initial introduction to the module has already been completed, the docstring suppression functionality is quite convenient.
Comments can also take up substantial space in the diagram. Sometimes there is a desire to suppress them. Not to draw comments at all seems unreasonable for the same reasons as for lines of documentation, so it was decided to replace them with a small primitive supporting a pop-up hint with the full text of the comment.
Comments are shown
Comments are down
Usually, code located in except blocks does not lie on the main path of program execution, but serves to handle rare exceptions. Therefore, when analyzing the main purpose of the program, it seems convenient to be able to suppress except blocks and present them with a small primitive, which makes it clear that they exist at all.
Two shown blocks except
Suppressed Units
The tooltip to the primitive shows as many lines as there were except blocks with an indication of what is intercepted in each.
Codimension in its current implementation supports two types of scaling diagrams. Normal, or just scaling, which is based on the size of the selected font. With this scaling, the font size increases or decreases, and then all sizes are recalculated. Smart scaling involves several fixed levels, each of which changes the contents of the chart. Each next level hides more and more elements in the diagram.
It was not possible to come up with reasonable short names for each of the levels, so they are indicated by numbers. To control level switching, a current level indicator and up and down buttons are added to the toolbar.
Smart scaling control
For the level indicator, a tooltip has been added with a description of what changes have been made in the diagram.
Smart scaling works in conjunction with the settings for suppressing elements. That is, if the level assumes display, for example, except blocks, then they can be independently suppressed by pressing the corresponding button. In the examples below, it is assumed that neither comments, nor lines of documentation, nor blocks except are suppressed.
This is the level of maximum detail. All graphic elements are shown.
At this level, comments and documentation lines disappear from the diagram. The remaining graphic primitives remain on the diagram, but the text in them is suppressed, with the exception of class headers and functions.
Smart scaling: level 1
This view allows you to quickly get an idea of the amount of code and its complexity: the higher the concentration of “boxes” in the diagram, the more complex the code. For each graphic element at this level, a tooltip has been added that shows suppressed text.
At this level, primitives remain on the diagram, using to display the scope (with the exception of decorators) and conditional structures. Such a presentation is also intended for quick assessment of complexity. In fact, nesting and branching remain on the diagram.
Smart scaling: level 2
At this level, only classes and functions remain in the diagram. Such a mapping was conceived as a “bird's-eye view,” only large objects in the module remain visible.

Smart scaling: level 3
At the moment, the experience of practical application of levels of smart scaling is very small. Therefore, it is difficult to draw firm conclusions about the usefulness of any of the levels, as in general, the ideas of smart scaling. In the plans, however, there is an introduction of the next level with number 4. It is supposed to show the module dependency diagram, a kind of look at the file system. In the center there may be a primitive of the current module, and around it there are primitives of imported modules. Thus, it will be possible to visually assess current dependencies.
Interestingly, the implementation of smart scaling did not require much effort. On the graphical representation, it turned out to be quite easy to manipulate the contents. Therefore, the introduction of some new intermediate levels for experimental purposes can be done very quickly.
The basic idea of functionality is simple - to give the opportunity to combine several graphic elements into a group, followed by folding and unfolding the group into one graphic element with a new signature. The use case may be, for example, such. The developer starts working with a new code written for him by another person. In the course of the analysis, an understanding gradually comes about what the code fragment consisting, say, of ten blocks, does. Then the developer combines these blocks into a group and supplies it with appropriate text. With further analysis, the group remains on the screen collapsed, that is, instead of 10 elements on the diagram, there is only one, which should facilitate subsequent analysis. Of course, groups can be nested and there are no restrictions on the number of groups in a module.
Nobody forbids the use of groups and at the time of initial development. The programmer can create groups, which will facilitate the analysis of the code to those who will work with him later.
Since groups support unlimited nesting, they can be considered as the introduction of the similarity of the third dimension into the code. The first two are a diagram, and the third is a folded group in which you can look inside.
To draw a group on a chart, Codimension needs to know where it starts and where it ends. To leave the corresponding marks in the code, micro markup language is used in the comments of the Codimension Markup Language.
The first comment has the gb code (from the words group begin) and is located before the first element of the group. The second comment has the code ge (from the words group end) and is located after the last element of the group. Codimension understands that the comments are paired by the value of the required id attribute, which can be an arbitrary string.
Obviously, there are a number of restrictions for group formation. The group must have one entrance and one exit. When selecting items for a group on a chart, all of them should be highlighted without gaps. If an if condition is selected, then all branches must also be selected. For cycles, a similar requirement is associated with the else construct: if it is present, both parts must be selected, and the cycle itself and its else block. Similarly, the components of try-except-else-finally cannot be broken. All of these restrictions are taken into account when the user interface allows grouping.
In addition, as we worked on the groups, a change was needed in the python parser. With the initial design of the technology, it was decided not to support the final comments. However, for groups such a final comment is absolutely necessary. For example, a group can combine all elements in one of the if branches:
Here the final group comment should belong to the if branch, which was not previously provided.
For groups also added the ability to change the default colors. For this purpose, optional attributes for specifying background, ink, and stroke colors are supported in the cml opening comments.
To draw groups, three variants of primitives are required: a collapsed group, an expanded group, and an empty group.
For a collapsed group, such a primitive is desirable so that it is immediately clear that several elements are hidden behind it and that it can be revealed. It is also desirable that the drawing of the primitive is simple, regardless of whether it is selected or not. As a result, a rectangle with a double stroke was selected, inside which the group header is placed.

Rolled up group
There is no complete satisfaction from the selected primitive at the moment, so there is a chance that it will be replaced by something else in the future.
The open group should indicate its borders, plus it should be possible to quickly see the title of the group. To make the borders look "easier", the rectangle of the open group is drawn with a dotted line. There is no special meaning in making the fields of the open group wide, so the dotted line is drawn closer to the primitives than if it were another element.
Open group
In the upper left corner of the open group, its “sensitive point” is drawn. When the mouse cursor is over it, the group stroke is drawn with a solid line, and its title is displayed above the group.
“Sensitive point” of the open group
If necessary, in addition to the group header, you can add some control buttons. This allows you to perform actions with a minimum number of mouse clicks.
There is nothing in an empty group, but it may, for example, contain a title. Later, when editing functions appear on the graphical representation, new elements can be added to the empty group. Therefore, drawing an empty group is still necessary. A rectangle with stroke is selected for it.
Empty group
The similarity of the primitives of empty and minimized groups is obvious. Therefore, if the primitive is changed for a collapsed group, then appropriate changes should be made for an empty group.
Group management is carried out from the context menu. To create a group, the necessary primitives are selected, and then the Group item is selected from the context menu. After entering the group header, the required CML comments are added to the code and the diagram is immediately redrawn. In this case, the newly created group is drawn in a collapsed form.
All other group manipulations — disclosing, hiding, deleting, editing the title, changing colors — are performed optionally from the context menu of the group.
You can try new functionality by installing the Codimension IDE. Codimension supports Linux and Mac. Installation instructions are available at codimension.org
- Part One - discussed the flowcharts, the available tools for working with flowcharts, as well as all the graphic primitives needed to create a graphical representation of the code.
- Part two - the implementation (mainly performed on Python) of generating a graphical representation of the code, the implemented and planned functionality, the proposed micro markup language are discussed.
An example of an environment that supports such a graphical representation is shown in the picture below.
Environment that supports graphical code presentation
')
In the third part of the article we will discuss new features of the graphical representation of the code.
Little things
Since the writing of the second part, an interface has been added for changing colors used to display graphic primitives and an interface for changing text displayed by a graphic primitive. In both cases, the interface is minimalist and uses the context menu.
Context menu of selected graphic elements
The user selects one or more primitives and presses the right mouse button. In the context menu that appears, you can select the desired item (the availability of menu items is determined dynamically).
In the case of selecting one of the first two menu items, an additional dialog is displayed for selecting color or entering text accordingly. After the input is completed, the necessary cml comments are added / modified and the entire diagram is immediately redrawn with changes.
Suppression of primitives
In the process of working with the environment, it was noticed that sometimes there is a desire to temporarily hide certain graphic elements in order to reduce the amount of information presented on the screen. This can help with certain program analysis scenarios. Of course, this functionality is fairly easy to implement for a graphical representation.
The following candidates were identified: documentation lines, comments and except blocks. To control the suppression of primitives, three buttons have been added to the graphic toolbar, each of which can be in one of two positions: pressed / pressed.
Controlling the suppression of primitives in a diagram
The buttons are independent of each other, so you can select any desired combination of suppression. By changing the state of the buttons, the diagram is immediately redrawn, that is, with just one click of the mouse, you can quickly change the number of parts displayed at the moment.
Suppression of lines of documentation
Python supports documentation strings for modules, classes, and functions. To display all of these cases, Codimension uses a “scope” primitive, in which the documentation string is located after the header. For example:
Function with string documentation
However, documentation lines are optional, and if the developer did not take care of the documentation, Codimension does not draw the appropriate section at all. For example:
Function without documentation line
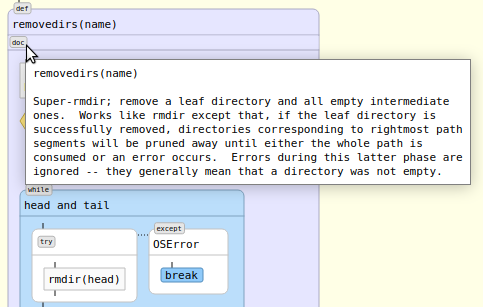
When the documentation lines are suppressed, it would be possible not to draw the section, but then it would have been impossible to understand from the glance at the diagram: there is no documentation at all or it is suppressed. Therefore, such a decision was made - instead of the suppressed lines of documentation, draw a section in which, instead of the entire text, only the badge is placed. A badge takes up less space than a single line; it gives you the opportunity to immediately understand what documentation is. And allows you to easily add a tooltip for the section with the full text of the documentation. For example:
Function with suppressed documentation string
In cases where the documentation is extensive, and the initial introduction to the module has already been completed, the docstring suppression functionality is quite convenient.
Suppress comments
Comments can also take up substantial space in the diagram. Sometimes there is a desire to suppress them. Not to draw comments at all seems unreasonable for the same reasons as for lines of documentation, so it was decided to replace them with a small primitive supporting a pop-up hint with the full text of the comment.
Comments are shown
Comments are down
Block suppression except
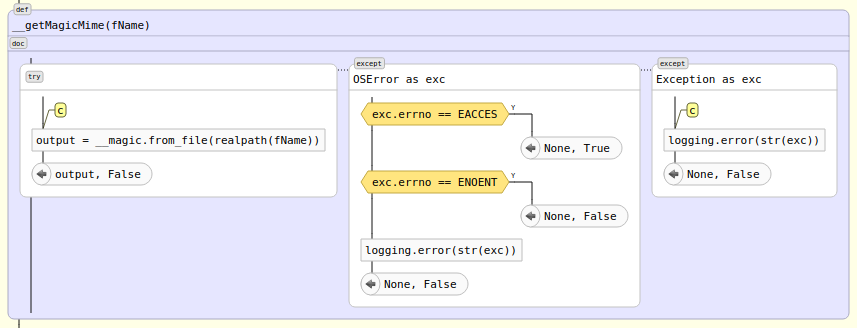
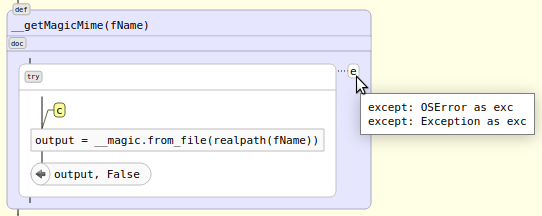
Usually, code located in except blocks does not lie on the main path of program execution, but serves to handle rare exceptions. Therefore, when analyzing the main purpose of the program, it seems convenient to be able to suppress except blocks and present them with a small primitive, which makes it clear that they exist at all.
Two shown blocks except
Suppressed Units
The tooltip to the primitive shows as many lines as there were except blocks with an indication of what is intercepted in each.
Smart scaling
Codimension in its current implementation supports two types of scaling diagrams. Normal, or just scaling, which is based on the size of the selected font. With this scaling, the font size increases or decreases, and then all sizes are recalculated. Smart scaling involves several fixed levels, each of which changes the contents of the chart. Each next level hides more and more elements in the diagram.
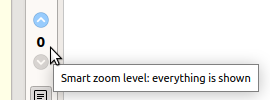
It was not possible to come up with reasonable short names for each of the levels, so they are indicated by numbers. To control level switching, a current level indicator and up and down buttons are added to the toolbar.
Smart scaling control
For the level indicator, a tooltip has been added with a description of what changes have been made in the diagram.
Smart scaling works in conjunction with the settings for suppressing elements. That is, if the level assumes display, for example, except blocks, then they can be independently suppressed by pressing the corresponding button. In the examples below, it is assumed that neither comments, nor lines of documentation, nor blocks except are suppressed.
Level 0
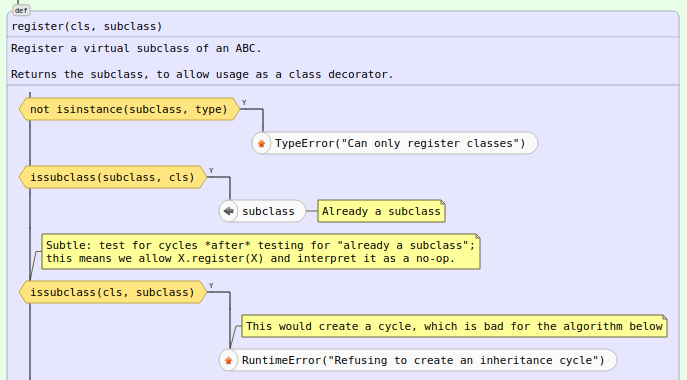
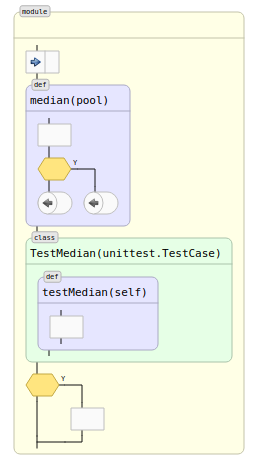
This is the level of maximum detail. All graphic elements are shown.
Level 1
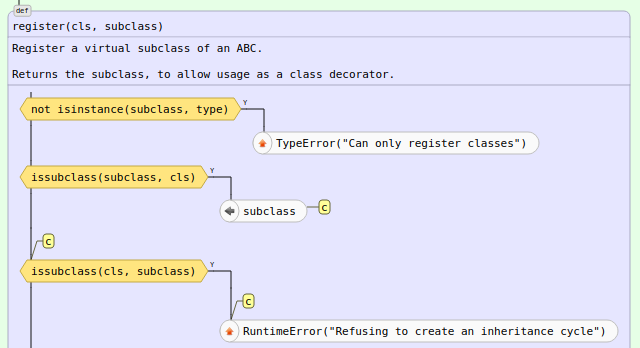
At this level, comments and documentation lines disappear from the diagram. The remaining graphic primitives remain on the diagram, but the text in them is suppressed, with the exception of class headers and functions.
Smart scaling: level 1
This view allows you to quickly get an idea of the amount of code and its complexity: the higher the concentration of “boxes” in the diagram, the more complex the code. For each graphic element at this level, a tooltip has been added that shows suppressed text.
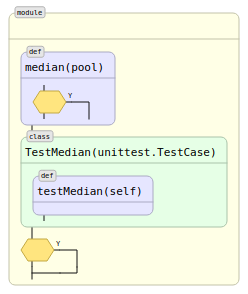
Level 2
At this level, primitives remain on the diagram, using to display the scope (with the exception of decorators) and conditional structures. Such a presentation is also intended for quick assessment of complexity. In fact, nesting and branching remain on the diagram.
Smart scaling: level 2
Level 3
At this level, only classes and functions remain in the diagram. Such a mapping was conceived as a “bird's-eye view,” only large objects in the module remain visible.
Smart scaling: level 3
More levels
At the moment, the experience of practical application of levels of smart scaling is very small. Therefore, it is difficult to draw firm conclusions about the usefulness of any of the levels, as in general, the ideas of smart scaling. In the plans, however, there is an introduction of the next level with number 4. It is supposed to show the module dependency diagram, a kind of look at the file system. In the center there may be a primitive of the current module, and around it there are primitives of imported modules. Thus, it will be possible to visually assess current dependencies.
Interestingly, the implementation of smart scaling did not require much effort. On the graphical representation, it turned out to be quite easy to manipulate the contents. Therefore, the introduction of some new intermediate levels for experimental purposes can be done very quickly.
Groups
The basic idea of functionality is simple - to give the opportunity to combine several graphic elements into a group, followed by folding and unfolding the group into one graphic element with a new signature. The use case may be, for example, such. The developer starts working with a new code written for him by another person. In the course of the analysis, an understanding gradually comes about what the code fragment consisting, say, of ten blocks, does. Then the developer combines these blocks into a group and supplies it with appropriate text. With further analysis, the group remains on the screen collapsed, that is, instead of 10 elements on the diagram, there is only one, which should facilitate subsequent analysis. Of course, groups can be nested and there are no restrictions on the number of groups in a module.
Nobody forbids the use of groups and at the time of initial development. The programmer can create groups, which will facilitate the analysis of the code to those who will work with him later.
Since groups support unlimited nesting, they can be considered as the introduction of the similarity of the third dimension into the code. The first two are a diagram, and the third is a folded group in which you can look inside.
CML for groups
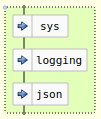
To draw a group on a chart, Codimension needs to know where it starts and where it ends. To leave the corresponding marks in the code, micro markup language is used in the comments of the Codimension Markup Language.
# cml 1 gb id=101 title="Module imports" import sys import logging import json # cml 1 ge id=101 The first comment has the gb code (from the words group begin) and is located before the first element of the group. The second comment has the code ge (from the words group end) and is located after the last element of the group. Codimension understands that the comments are paired by the value of the required id attribute, which can be an arbitrary string.
Obviously, there are a number of restrictions for group formation. The group must have one entrance and one exit. When selecting items for a group on a chart, all of them should be highlighted without gaps. If an if condition is selected, then all branches must also be selected. For cycles, a similar requirement is associated with the else construct: if it is present, both parts must be selected, and the cycle itself and its else block. Similarly, the components of try-except-else-finally cannot be broken. All of these restrictions are taken into account when the user interface allows grouping.
In addition, as we worked on the groups, a change was needed in the python parser. With the initial design of the technology, it was decided not to support the final comments. However, for groups such a final comment is absolutely necessary. For example, a group can combine all elements in one of the if branches:
item = self.__processes[index] if item.widget: # cml 1 gb id=102 title="Script started" msg = item.widget.appendIDEMessage('Script started') item.procWrapper.startTime = msg.timestamp # cml 1 ge id=102 Here the final group comment should belong to the if branch, which was not previously provided.
For groups also added the ability to change the default colors. For this purpose, optional attributes for specifying background, ink, and stroke colors are supported in the cml opening comments.
Graphics for groups
To draw groups, three variants of primitives are required: a collapsed group, an expanded group, and an empty group.
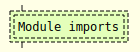
For a collapsed group, such a primitive is desirable so that it is immediately clear that several elements are hidden behind it and that it can be revealed. It is also desirable that the drawing of the primitive is simple, regardless of whether it is selected or not. As a result, a rectangle with a double stroke was selected, inside which the group header is placed.
Rolled up group
There is no complete satisfaction from the selected primitive at the moment, so there is a chance that it will be replaced by something else in the future.
The open group should indicate its borders, plus it should be possible to quickly see the title of the group. To make the borders look "easier", the rectangle of the open group is drawn with a dotted line. There is no special meaning in making the fields of the open group wide, so the dotted line is drawn closer to the primitives than if it were another element.
Open group
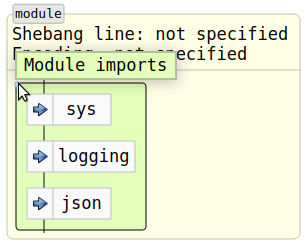
In the upper left corner of the open group, its “sensitive point” is drawn. When the mouse cursor is over it, the group stroke is drawn with a solid line, and its title is displayed above the group.
“Sensitive point” of the open group
If necessary, in addition to the group header, you can add some control buttons. This allows you to perform actions with a minimum number of mouse clicks.
There is nothing in an empty group, but it may, for example, contain a title. Later, when editing functions appear on the graphical representation, new elements can be added to the empty group. Therefore, drawing an empty group is still necessary. A rectangle with stroke is selected for it.
Empty group
The similarity of the primitives of empty and minimized groups is obvious. Therefore, if the primitive is changed for a collapsed group, then appropriate changes should be made for an empty group.
Group management is carried out from the context menu. To create a group, the necessary primitives are selected, and then the Group item is selected from the context menu. After entering the group header, the required CML comments are added to the code and the diagram is immediately redrawn. In this case, the newly created group is drawn in a collapsed form.
All other group manipulations — disclosing, hiding, deleting, editing the title, changing colors — are performed optionally from the context menu of the group.
How to try
You can try new functionality by installing the Codimension IDE. Codimension supports Linux and Mac. Installation instructions are available at codimension.org
Source: https://habr.com/ru/post/358826/
All Articles