Finding the number of commissions that "draw" integer turnout values in the presidential election of the Russian Federation in 2018
We see graphs with unusual peaks after every federal election. For the first time, they came out to the masses after the elections in 2011, when people both saw the fraud and got acquainted in general with the analysis of election data and the problem of integer division in particular.
Distributions even began to appear their names. This is the “beard of Churov” for the elections of 2011, and the “peak of Volodin” for the famous 62.2% in Saratov. As until now, even articles that are not familiar with the solution of the problem of integer division and not agreeing to “ add garbage ” of a small random addition to the data appear on the Habré, let's look at the results quite differently. We will go to the construction of graphs from the opposite side, where there are no problems of integer division. And we also see peaks on integer values.
Let's figure out how to analyze the data from the election. Since there are different numbers of people at the polling stations, the approximately close turnout will differ in the tenths and hundredths, even when the commission wants to adjust to a certain round number, say, 85%. For example, the turnout of 1658 people to the polling station with 1950 voters is 85.03% of the turnout, the turnout of 1619 out of 1905 voters is 84.99%, and 263 people out of 309 are 85.11%. Thus, it is necessary to somehow understand whether the turnout is suitable for a round percentage, considering the number of voters and what exactly is, say, 85% difficult to get into (this will be only if the number of voters in the list of the polling station is a multiple of 20).
')
Therefore, we do this - we simply loop through the percent percent (in this case turnout) in the cycle, and for each percent value we check the condition for the number of voters voted, taking into account the size of the people segment:
, 70% - .
, , , .

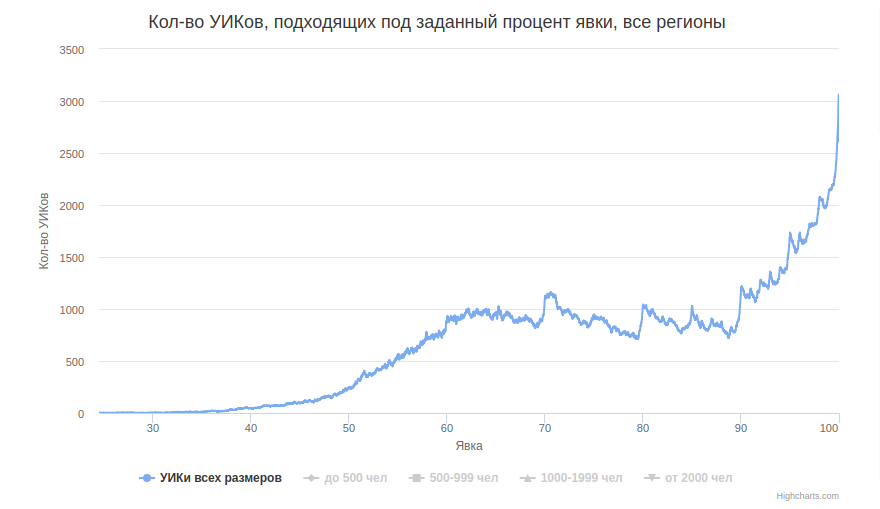
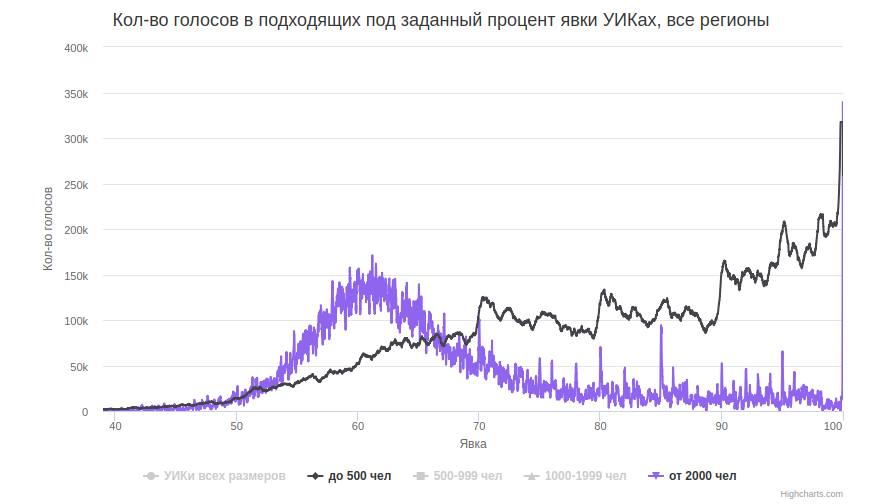
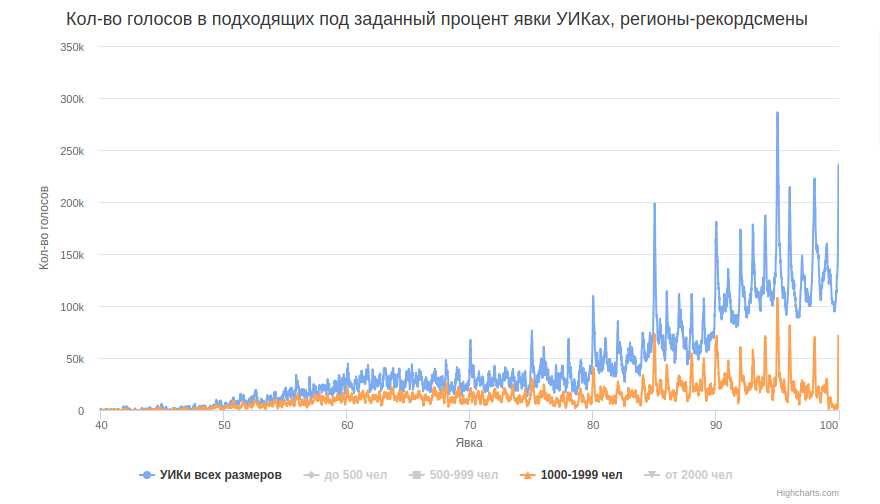
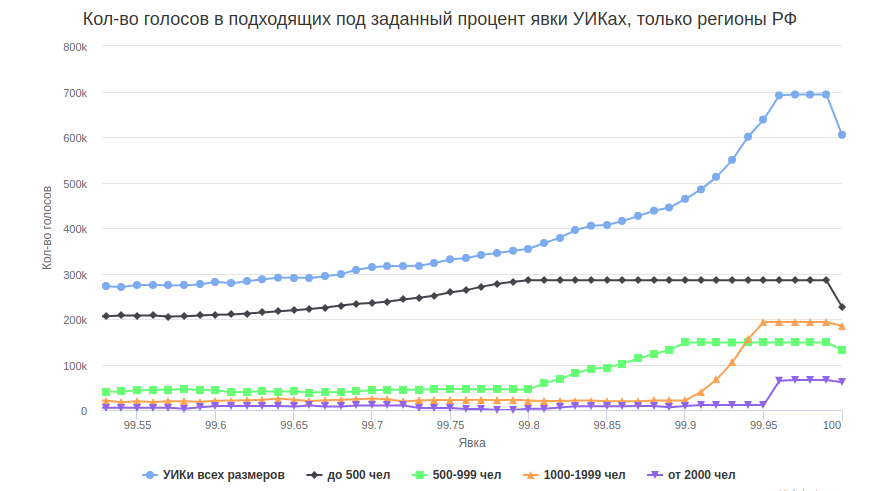
. , «», . , 4 0-499, 500-999, 1000-1999 >=2000. , , .
vsvor - , 8 -, . , .
, . 1%, 0.001%, . 0.01% 0.001% .
, , , «» 1 , 100%/( ). :
,

, 70%, , , « 70%». , . , — .
100% , , , , « », — 100% , , «» , , 100% - , , 8000 5297 . «» — , .. , , - () 1719 . 10 , . - .
, , , . , (3 — 0.3%). , 70% , .
\ . , , 1058, 20% 98%, , , , -, , .
, , , , . , «» .
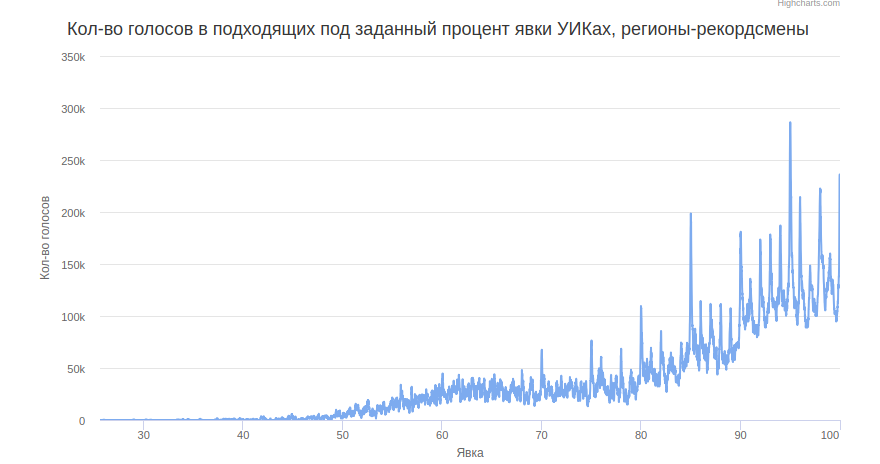
, , . , , 95%, 70 — , 2.5%. 95%, , , , — . 85% — 40 , .
«» , ( , , ). , ( ) «» , , , (, ).
+-0.5%. :
2.9% (!) . , . 10 (), , . , , « ».
— , . , , , .
, — , . , — : - . , (50=4.5) , 12 , .
( ).
, json (php, laravel 5.4), gist, , .
— csv- «».
UPD1. ,
UPD2. 1058 ( — , )
UPD3. , , . >=500 , 2259 , , , .
Distributions even began to appear their names. This is the “beard of Churov” for the elections of 2011, and the “peak of Volodin” for the famous 62.2% in Saratov. As until now, even articles that are not familiar with the solution of the problem of integer division and not agreeing to “ add garbage ” of a small random addition to the data appear on the Habré, let's look at the results quite differently. We will go to the construction of graphs from the opposite side, where there are no problems of integer division. And we also see peaks on integer values.
Search method possible attendance
Let's figure out how to analyze the data from the election. Since there are different numbers of people at the polling stations, the approximately close turnout will differ in the tenths and hundredths, even when the commission wants to adjust to a certain round number, say, 85%. For example, the turnout of 1658 people to the polling station with 1950 voters is 85.03% of the turnout, the turnout of 1619 out of 1905 voters is 84.99%, and 263 people out of 309 are 85.11%. Thus, it is necessary to somehow understand whether the turnout is suitable for a round percentage, considering the number of voters and what exactly is, say, 85% difficult to get into (this will be only if the number of voters in the list of the polling station is a multiple of 20).
')
Therefore, we do this - we simply loop through the percent percent (in this case turnout) in the cycle, and for each percent value we check the condition for the number of voters voted, taking into account the size of the people segment:
floor(percent * people / 100) === voted || ceil(percent * people / 100) === votedtrue, ( , ). , , . ( ), .. , «5\4» . , . , , , , , , , . , , ., 70% - .
, , , .
. , «», . , 4 0-499, 500-999, 1000-1999 >=2000. , , .
vsvor - , 8 -, . , .
, . 1%, 0.001%, . 0.01% 0.001% .
. .
, , , «» 1 , 100%/( ). :
| 500 | 248 | 0.40% |
| 500-999 | 726 | 0.14% |
| 1000-1999 | 1499 | 0.07% |
| 2000 | 2368 | 0.04% |
| 1116 | 0.09% |
,
, 70%, , , « 70%». , . , — .
100% , , , , « », — 100% , , «» , , 100% - , , 8000 5297 . «» — , .. , , - () 1719 . 10 , . - .
, , , . , (3 — 0.3%). , 70% , .
\ . , , 1058, 20% 98%, , , , -, , .
,
- «»
- , . ( 0.1%) , , . «» 1.5 , .. , - — .
- — , 0.001%, . - , . , .
, , , , . , «» .
, , . , , 95%, 70 — , 2.5%. 95%, , , , — . 85% — 40 , .
«» , ( , , ). , ( ) «» , , , (, ).
+-0.5%. :
| 500 | +0.23 | 496 |
| 500 999 | +0.52 | 823 |
| 1000 1999 | +1.28 | 1007 |
| 2000 | +1.07 | 514 |
| +3.1 ( +2.5 ) | 2840 |
2.9% (!) . , . 10 (), , . , , « ».
?
— , . , , , .
, — , . , — : - . , (50=4.5) , 12 , .
( ).
, json (php, laravel 5.4), gist, , .
— csv- «».
UPD1. ,
UPD2. 1058 ( — , )
UPD3. , , . >=500 , 2259 , , , .
Source: https://habr.com/ru/post/358790/
All Articles