Development of Clickhouse API for Rambler / Top-100

Everyone knows what Rambler / Top 100? Just in case, this is a web analytics service. Our users place a counter on their sites, but we, in turn, prepare all the necessary statistics of visits in the form of a set of standard reports. Under the cut, is the story of Vitaly Samigullin, the head of the Rambler / Top-100 technology development group, about how we developed the ClickHouse API in Python and why we started it all.
The transition from batch to stream processing required a new repository and a new API
Actually, why would we need to develop the Clickhouse API ? First, we had certain changes in the data processing. The general scheme of the service now looks as follows.
')
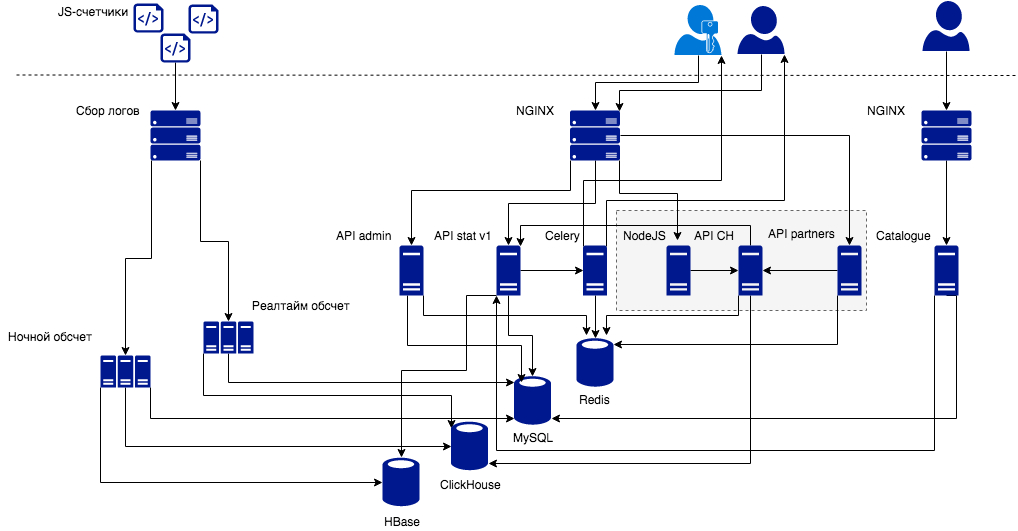
In the upper left corner you see counters that send us events. The logs of these events are parsed and processed in a certain way. How it happens now: we have a cluster of nightly batch-computing, which cheats the logs for yesterday. For the user of Top 100, this is not very convenient, because the latest statistics appear in your account after a day.
Everyone really wanted the service to work “like in the best houses in London”, and the statistics for the current day would arrive to the user as soon as possible. Therefore, we decided to switch to the so-called stream data processing (near real-time data processing or micro-batchy). The delay in displaying data in 5-10 minutes is nothing compared to the scheme, when the data arrive on the next day.
If earlier the results of the night calculation were flooded in the open-source analogue of BigTable from Google, then for real-time we needed a new database. We chose ClickHouse (more on this in our article on Habré ). Then we started developing the ClickHouse API to work with this database. It should be noted that the API is quite low-level. Users interact with it through various layers: partner APIs, user application APIs.
What is Clickhouse?
Clickhouse is a database management system. ClickHouse is a column database. This means that the data is stored, organized in columns, not in lines. This provides the opportunity to work with dozens and even hundreds of columns. The second important feature of this database is that it is very fast just because it is organized into columns (when we query, we only read the required columns), it uses data compression, it can parallelize the processing of requests on several processor cores, and also supports distributed processing of the request on a cluster from many servers.
Another important aspect is the SQL-like syntax of the query language, extended by a large number of useful functions of aggregation and transformation. This allows part of the logic to be removed from the application to the request. That is, if you have an application in Python, the removal of logic in Clickhouse, written in C ++, will not only be convenient, but also provide a speed boost.
Analytic queries
Analytical queries are a pattern with a set of characteristics. For example, analytic queries involve mostly reading. In analytical queries, we do not need transactions — the data is read and almost never changes. And if changes are required, this is done through deleting partitions and recording a new partition. In addition, the recording takes place in large batches from a real-time cluster. In analytical queries, it is often envisaged to read the data of individual columns from a wide multi-column table.
In contrast to the nightly calculation, the results of microbatch are recorded in ClickHouse in a non-aggregated form. And when there is so much data, requests can be slow. For analytics, queries are allowed based on a piece of data with some approximate result. ClickHouse allows you to do this using the sampling mechanism.
Product challenge
Previously, we performed standard reports for users with night-time data — these are about 30 standard reports, for example, reports on classroom or behavioral indicators, technologies, traffic sources, page contents. From the API side, two pens were required for each report: one for tabular data, the second for a chart.
Now we were faced with a grocery call - in addition to speeding up the calculation to almost real time and saving the already existing reports with statistics, we had to implement the report designer. The report designer should allow the user to create fully custom reports to fit his needs. What does this mean for the API?
This means that we can no longer do the standard template with a SQL query for each standard report from our statistics. You need to be able to generate queries for custom reports. That is, the API assumes the functions of almost- ORM . Why almost because we did not solve some kind of universal task of generating SQL queries for ClickHouse. We solved the problem for our data schema, for our tables.
It is clear that in the case of the API that will be used for the report designer, we need a certain single entry point, one handle: the handle receives a set of parameters for the query to the database, generates the query, sends it to ClickHouse, formats it in some way and returns the answer. In order to generate this query, we introduced such a concept as cubes.
Cubes are entities for generating SQL queries. By their type, cubes are divided into two categories:
Dimensions - answer the question WHAT?
Metrics - answer the question HOW MUCH?
Best of all, the structure of the cube can be seen on the example of our standard report “Geography”. In the table we see a breakdown by country. It is obvious that the country answers the question “WHAT?” And refers to the dimension. Each country has some quantitative views: visitors, refusals, viewing depth, and so on. These are metrics.

Now let's imagine that a user was inspired by a report broken down by country and decided to add regions and cities as dimensions to conduct more complex analytics and find out on which pages the residents of Moscow, Kiev and Minsk finish viewing his site. And then the user will want to see how these indicators change over time and add the Day cube to the report designer.
From API request to SQL query
What would an API request look like? What database query will it generate? How is the SQL query generated? And how the cubes are implemented in Python code.
As an example, take the simplest report "Technology / Operating Systems."
JSON API Request
{"dimensions": [ {"name": "counter", "filters": [{"op": "eq", "val": 123}]}, {"name": "os", "filters": [{"op": "nlike", "val": "Windows%"}]}, {"name": "day", "filters": [{"op": "eq", "val": "2017-03-22"}]} ], "metrics": [ {"name": "visitors", "filters": [{"op": "gt", "val": 100}]} ], "sort": [ {"name": "visitors", "order": "desc"}, {"name": "os", "order": "asc"} ], "offset": 0, "limit": 20, "sample": 1.0} Obviously, we will send some JSON to the API, which consists of a list of metrics, dimensions, sorts, limits, offsets and sample (if we want to build a query only on the part of the data set).
Each cube - both metrics and dimensions - is described by some keyword and includes filters. In the above case, it is clear that we have the dimension "Counter", "Project Number" and it is equal to a certain ID. We have the “Operating Systems” cube, and in this query we want to make a breakdown for all operating systems except Windows. We have a cube "Day", and we want to see the data only for today.
The same with metrics. We have “Visitors”, we want to see all operating systems where there were more than a hundred visitors. Well, sort it all in descending order by visitors and increasing order by OS name.
From SQL query to cubes
SELECT os_name AS os, uniqCombined(user_id) AS visitors FROM hits SAMPLE 1 WHERE (counter_id = 123) AND (dt = toDate('2018-03-22')) AND (os NOT LIKE 'Windows%') GROUP BY os HAVING visitors > 100 ORDER BY visitors DESC, os ASC LIMIT 0, 20 We want the API based on the incoming JSON to generate a SQL query for ClickHouse. In the above query, we see all the dimensions and metrics described in JSON. We have a SELECT section, in it we choose the names of operating systems. There is also an aggregation of visitors. All filters are sent to the WHERE and HAVING sections. After grouping, we want to weed out all the operating systems, where we have 100 users and less, and so on.
Properties of cubes
Each cube has certain properties that define it:
- Column in db
- Alias
- Sign of Visibility
- Filters
- Sorting
- Expressions for all necessary sections of the SQL query (SELECT, WHERE, ...)
For example, for the “Operating Systems” cube, the column in the database, as we see from the query, is os_name. Alias allows you to conveniently work with filters, groupings and sorts. The sign of visibility is this: in the example above, it is clear that the dimension, “Counter” and “Day” are invisible. We use them only for sorting, but they do not participate in the SELECT section. At the same time, the “Operating Systems” and “Visitors” cubes are clearly visible. It's the same with sorting - some cubes are involved in sorting, some are not. There are certain orders to sort. And naturally, in the final query, we want to get pieces for each section of the query, for each keyword: SELECT, WHERE, and others. Each cube will provide us these pieces through the corresponding expressions.
Implementing Cubes in Python
The API is written in Python. Consider the implementation of cubes in this programming language.
class Selectable(object): column = not_implemented alias = not_implemented def __init__(self, visible: bool=True, sortable: bool=False) -> None: self.visible = visible self.sortable = sortable self.filters = [] ... def filter(self, operator: str, value: Any) -> None: ... def sort(self, ascending: bool=False, priority: int=0) -> None: ... @property def select(self) -> Optional[str]: ... Obviously, metrics and dimensions have much in common. Therefore, we will describe the properties common to these entities in the base, parent class. It has class variables: column, alias. During initialization, we set the properties of visibility and sortability. We have a method for adding filters, which will add an operator and a value. And it is obvious that there can be many filters, so all these filters will be added to the list. For example, we may have a date range in the "from and to" query. Accordingly, two filters are added.
The same with sorting: we can specify the sorting order in descending or ascending. Next, we want to have attributes for each section of the query that will return rows. From these lines, a large final query will be glued together.
Below is a simplified example of the implementation of the "Operating Systems" and "Visitors" cubes in Python.
class OSName(StringDimension): column = 'os_name' alias = 'os' functions = [] ... class Visitors(IntegerMetric): column = 'user_id' alias = 'visitors' functions = [uniqCombined] ... We simply inherit from the parent class, set the column names in the database, alias, the list of transformation or aggregation functions. For example, as we saw in the request, we need the uniqCombined aggregation function to calculate the approximate number of visitors.
All our cubes can be ordered in a certain class hierarchy.
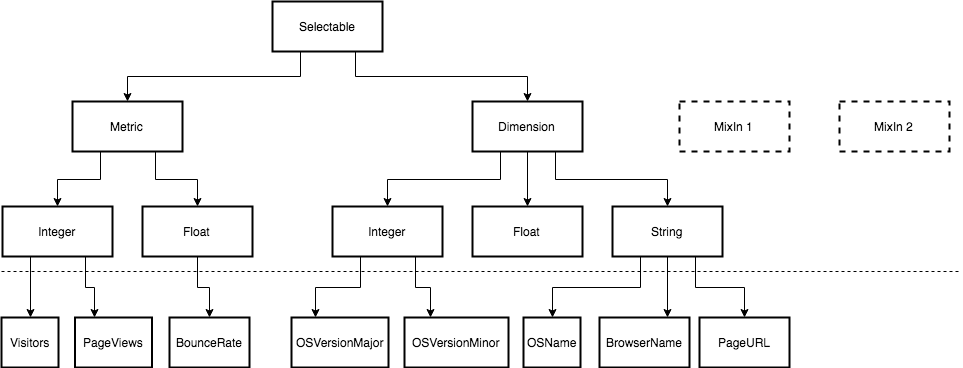
As mentioned earlier, metrics and dimensions have a lot in common. Therefore, the main logic is in the main parent class Selectable.
However, there are differences between them. For example, we always group by dimensions, and the HAVING section is only for metrics. Accordingly, they will be different in this. Similarly with sampling. When we specify, for example, a 1/10 sample, we need to multiply the metrics by the reciprocal number (by 10) to get an approximate value for these metrics. Therefore, we distinguish two classes Metric and Dimension.
At the next level of hierarchy, it is logical to create classes that are somehow tied to the type of stored and output data. Metrics can be integer, such as "Visitors" or "Page views." These can be floating point metrics, such as the Bounce Rate.
It is the same with dimensions, but there are mainly lines: “Browser name”, “Operating systems”, URL, and so on. On the diagram you also see Mixin-classes. These are such auxiliary classes that we can mix when defining concrete cubes, for example, to implement more complex logic, say, in working with transformation or aggregation functions. In the simplest case, which suits us in most cases, it is a kind of chain of functions applied to a column. Sometimes there are complex functions that require arguments, dependencies with other cubes, and more. Mixin in this case are well suited.
SQL Query Generator
So, we have cubes. From the set of cubes you need to collect a line of request. This is done by the SQLGenerator class — the generator is initialized with certain properties of the query as a whole, which are applicable to all all the cubes that participate in the generation of the final SQL query. Obviously, such a common property may be the name of the table, for example, “hits”. This is a sample - it is clear that there can not be a different sample for different cubes. Well, limits, offset.
Next to this generator, we must pass a list of objects that have already been initialized, have visibility set, filters set, sort. As a result, the generator class must save lists of strings in some dictionary. The keys of the dictionary will be the names of the query sections (SELECT, WHERE, ...), and the values will be these same lists of cubes, from which we refer to the attributes corresponding to the query section. Attributes are simply strings, pieces of the corresponding section.
generator = SQLGenerator(table="hits", sample=0.01, limit=[offset, limit]) generator.add([sel1, sel2, ...]) ... { 'SELECT': [sel1.select, sel2.select], 'FROM': 'hits', 'SAMPLE': 1, 'WHERE': [sel1.where, sel2.where], 'GROUP BY': [sel1.groupby, sel2.groupby], 'HAVING': [sel1.having, sel2.having], 'ORDER BY': [sel1.orderby, sel2.orderby], 'LIMIT': [0, 20], } Finally, to get a fully formed string for each section, we must glue these pieces according to some rule. Obviously, we will have a dictionary of correspondences of the section and the rules of gluing, separator. For example, in SELECT we will connect all the pieces separated by commas. And in WHERE or HAVING, the pieces will be glued together through AND.
API internal device
How does it look all together? Consider the diagram below.
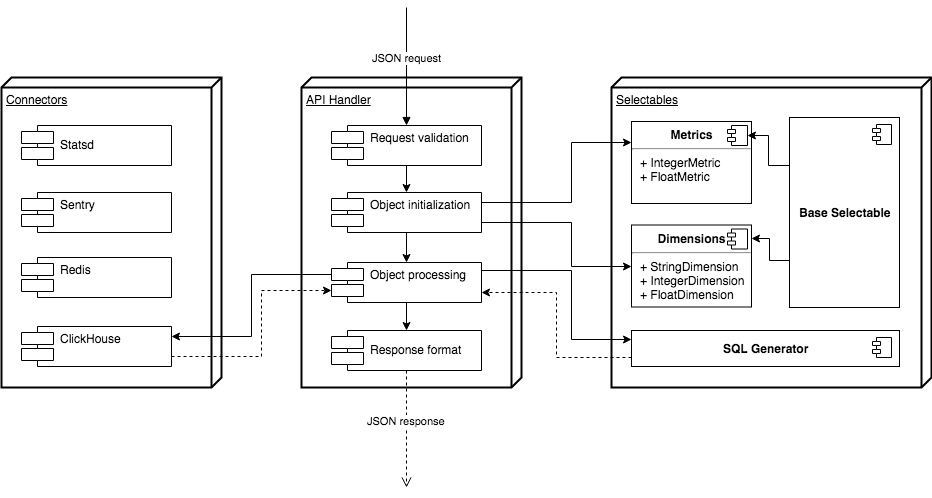
As with any API, we need to validate incoming requests, in our case, a POST request with a JSON load. Next we need to look at the correspondence of the names of the cubes to the names of classes in Python, initialize the corresponding classes, set filters, sort. Next, we need to slip the objects of the classes into the generator so that it will glue us a line of the SQL query. Then, through a special connector, in which all the logic of working with ClickHouse is made, the request will be sent to ClickHouse. We must receive a response from the database, format it and give it to the user.
findings
The project is developed on CPython 3.6.4. We really like f-string. If you do not use them, consider that life passes by you. Equally important are ordered dictionaries, where the order of inserting keys is de facto guaranteed, and starting with Python 3.7, this guarantee will be official - also very convenient, taking into account the use of dictionaries, where the keys are the names of the SQL query sections, which must be followed in a certain order. This significantly increased the speed of development. Well, since different clients are included in this API, and a relatively high load is planned for the API, we decided to try asyncio and the aiohttp framework . As a result, we got a fairly fast API.
We also liked the thing called mypy . A great tool that can improve the quality of the code, forcing the programmer in some cases, it is better to decompose the functions and, of course, catch some of the errors before starting the program. If you previously had experience with mypy and it was negative, it is definitely worth trying again - lately mypy has stabilized, some unpleasant bugs have been fixed.
Since the ClickHouse API component is critical in our architecture, it is important for us to maintain the quality of the code. We write a lot of unit tests with a large percentage of code coverage, and pytest helps us a lot with this . Especially convenient is the ability to write parameterized tests. We use this to compare the SQL queries that the generator creates across the various input JSON queries with the corresponding SQL reference queries.
PS You can also watch the video from the presentation of Vitaly Samigullin (aka pilosus ).
Source: https://habr.com/ru/post/358762/
All Articles