Developing your own visualization plugin for Grafana
Grafana is a handy tool for visualizing and monitoring time data from multiple sources. In this post I want to tell the key concepts of developing your plugin.
Creating your own plug-in may be necessary for 1) visualizing temporary data, because the Grafanovsky engine is convenient for creating queries. 2) to extend the functionality of grafana to fit your needs.
')
Installation
- Download and run Grafana in any way.
- After launching through
bin/grafana-server, thedatafolder should appear.
What is a plugin c those. points of view
These details are not necessary to know. I dealt with these concepts along the way.
Grafana 5.x is a great Angular application version 1.6.6 :) and a bit of React . The plug-in itself is an angular controller, which lies in the data/plugins/your-module/dist/module.js , which can be loaded as a SystemJS module. Next should be a plugin.json file with a meta-description of the plugin: name, id, icons ...
Project for development
I recommend using the following template on webpack . There is a description of the features why it is better. By the way, he is in the official documentation
The system must have npm installed.
cd $GRAFANA_PATH/data/plugins git clone https://github.com/CorpGlory/grafana-plugin-template-webpack.git cd grafana-plugin-template-webpack npm install npm run build You can clone to another directory, for example in /home/alex/development/grafana/plugins/grafana-plugin-template-webpack , and then create the file $GRAFANA_PATH/conf/custom.ini and write there
[plugin.template] path = /home/alex/development/grafana/plugins/grafana-plugin-template-webpack Now you need to restart Grafana. A line should appear.INFO[05-17|06:08:46] Registering plugin logger=plugins name="Plugin Template Name"
in the launch logs grafana.
Then we go to localhost:3000 , click on the + sign under the logo to create a new dashboard, a window should appear in the new window with the selection of the "Plugin Template Name" panel. This window should appear:
Development
Open the file src/module.js - this is our "main". From here, grafana makes the plug-in loading into the page, waiting for the PanelCtrl instance. Pay attention to the last line: export { Ctrl as PanelCtrl } . In general, remember that you are working in a large front-end application where many variables are defined and libraries can be imported. All that 'import {...} from grafana / *' is already available features.
Let's rewrite the constructor like this:
constructor($scope, $injector) { super($scope, $injector); console.log('hello from console'); } Now you can use npm run dev instead of npm run build , since the code will rebuild itself. You can not reboot the graphs backend (this is what we run through the bin/grafana-server ), but graphan likes to cache the plug-in files, so be careful with reloading the dumped sorts. At the bottom of the post there is a video where I talk more about how the build system works, and use the Angular template, which lies in partials .
Our class is an Angular controller and there is a link(scope, element) function link(scope, element) . I advise you to do console.log(element) , there will be an html element with which you can do what you want.
Data Output from Request
Our controller is a successor of the PanelCtrl class, let's replace it with the MetricsPanelCtrl class MetricsPanelCtrl . Now, if you enter the panel editing mode, a new tab will appear there.
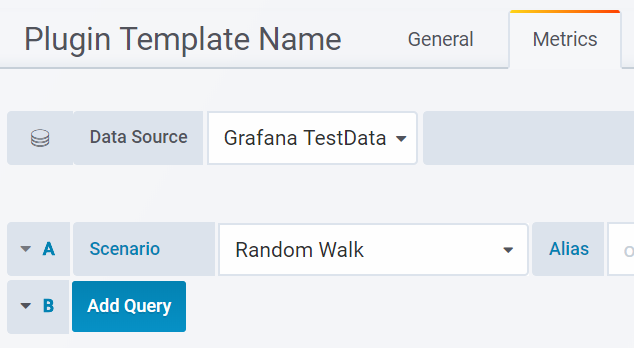
Here I use Grafana TestData
Now we will change the code of the class of successor
constructor($scope, $injector) { super($scope, $injector); this.events.on( 'data-received', this._onDataReceived.bind(this) ); } _onDataReceived(data) { console.log(data); } This is where the use of this.events object this.events - the field of the parent class for subscribing to the event of the received data. More features MetricsPanelCtrl only in source
Reload the plugin and get the data from the data source in the console. You can further select the data source you need and create requests to it through Grafana. And render as you like. For example, through d3.js.
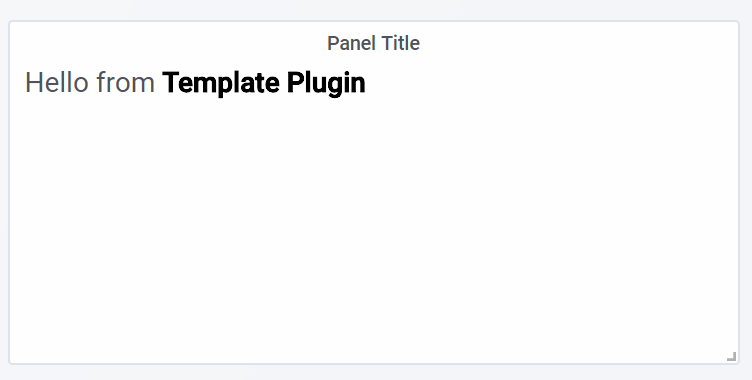
You can also try adding value output to the template. To do this, change the constructor:
constructor($scope, $injector) { super($scope, $injector); this.message = "nice!"; } and modify the partials/template.html file:
<div class="hello"> Hello from <b>Template Plugin</b> {{ ctrl.message }} </div> Conclusion
You can read the official documentation .
I advise you to look into one open-source plugin in order to figure out how to load data and how to get more of the graphs available for use. For example, using typescript , editor, saving plugin.json file, assets
By the way, the use of the old directives of the Angler is evil, because there are name collisions. Now we have thoughts to make a builder of plugins with components.
And video with similar content from me. I apologize for the sound. There is more information here:
I still recommend to develop Visual Studio Code , in this case it will be possible to debug
All successful coding.
PS post checked by Alexander Zobnin . Thank him so much.
Source: https://habr.com/ru/post/358746/
All Articles