Our long-term experiment - the introduction of Dell EMC ScaleIO in the KROK Cloud

We scoffed at the large test installation on which the Dell EMC based ScaleIO was built, scoffed in every way for a couple of years, and even more. Made a huge number of fixes and finally finished the product under our cloud infrastructure. Storage fills our extremely demanded niche between the usual slow HDD-based storage and high-speed solution on all-flash arrays. Moreover, by virtue of its Software Defined specificity, it allows collecting fault-tolerant storages almost from sticks with branches. Just keep in mind that it makes no sense to completely save on hardware, the cost of a license will outweigh the benefits of saving.
In short, today I will tell you how we implemented ScaleIO and walked around the rake with eyes closed. About the architectural features of the stack and its integration into the Cloud. And, of course, it will be about load testing. For details - welcome under cat.
"Almost like AWS"
As mentioned above, in the CROC Cloud there are two types of disk storage - “standard” and “flash”. The first one is built on the basis of arrays with magnetic disks, LUNs with storage systems are presented to the Clouds servers and assembled into a cluster file system. The second type, in turn, is built on the basis of all-flash arrays, known in narrow circles as “fiddle arrays”, whose LUNs are presented directly to the Cloud server with a hypervisor and are forwarded directly to the VM for maximum performance.
')
With each of these solutions, we had various problems during operation. “Violin arrays” with a large number of LUNs (more precisely, their exports to servers) dramatically increase the response time to API requests. In severe cases, they generally cease to show signs of life. The presentation time of the LUNs themselves is also greatly increased. Cluster FS based on magnetic disks with increasing load loses stability, especially during scaling attempts. Plus a few times let down the iron.
Both types of storage are built quite conservatively, with a minimum of layers of abstraction. As a result, they are significantly more difficult to maintain than the classic "cloud" solutions, plus the problems with scalability and fault tolerance. Therefore, as the basis for a new type of storage, it was decided to consider the Software Defined Storage (SDS) solutions, in which most of these problems were solved at the architectural level.
We compared many of the available SDS solutions on the market, among which, besides the Dell EMC product, were Ceph (RBD), GlusterFS, MooseFS, LizardFS, and a few more products. In addition to functionality, a critical factor for us was the performance of the solution on magnetic disks. It is ScaleIO in this parameter that has outpaced all the others in both sequential and random IO operations. Our colleague Roman ( RPOkruchin ) in his articles already wrote about interesting solutions based on this product: “ Do not rush to throw out old servers, you can assemble fast Ethernet storage in an hour ” and “ How can you make a fault-tolerant data storage system from domestic servers ” .
Looking ahead, as a result of performance testing, we decided to position the new storage type as a faster “ Throughput Optimized HDD (st1) ” type from AWS, but reduced the limit on the minimum disk size to 32 GB and made it possible to use as a boot disk. Due to the flexibility of the resulting solution, we called the new type of storage - “universal” (st2), positioning it as an improved version of AWS.
Architecture
To begin, I will describe what components the Dell EMC ScaleIO cluster consists of.
- MDM (Meta Data Manager) - manages the ScaleIO cluster and stores all its configuration. All possible tasks for managing the rest of the ScaleIO components go through it. It can be represented by a single server or a cluster of three or five servers. The tasks of the MDM cluster also include monitoring the entire system: tracking errors and failures, rebuild and rebalance the cluster, sending logs to a remote server;
- Tie Breaker MDM (TB) - used in a cluster of MDMs for voting and maintaining a quorum, does not store data;
- SDS (ScaleIO Data Server) is a service that aggregates server local disks in the ScaleIO Storage Pool. Accepts all client IO, performs replication and other data operations;
- SDC (ScaleIO Data Client) is a device driver that represents ScaleIO disks as block devices. In Linux, it is represented by a kernel module;
- Gateway (GW) is a service that accepts REST API requests and redirects them to MDM: all Clouds communicate with the MDM cluster through it. Also on these servers is the Installation Manager (IM), through the WEB console of which automatic installation / update / analysis of the cluster takes place;
- Also, to manage the entire cluster using the above-mentioned IM, it is necessary that the LIA (Light Installation Agent) be installed on all servers in the cluster, which allows for automatic installation and updating of packages.
In general, the assembled ScaleIO cluster inside our Cloud on each site can be represented approximately like this:
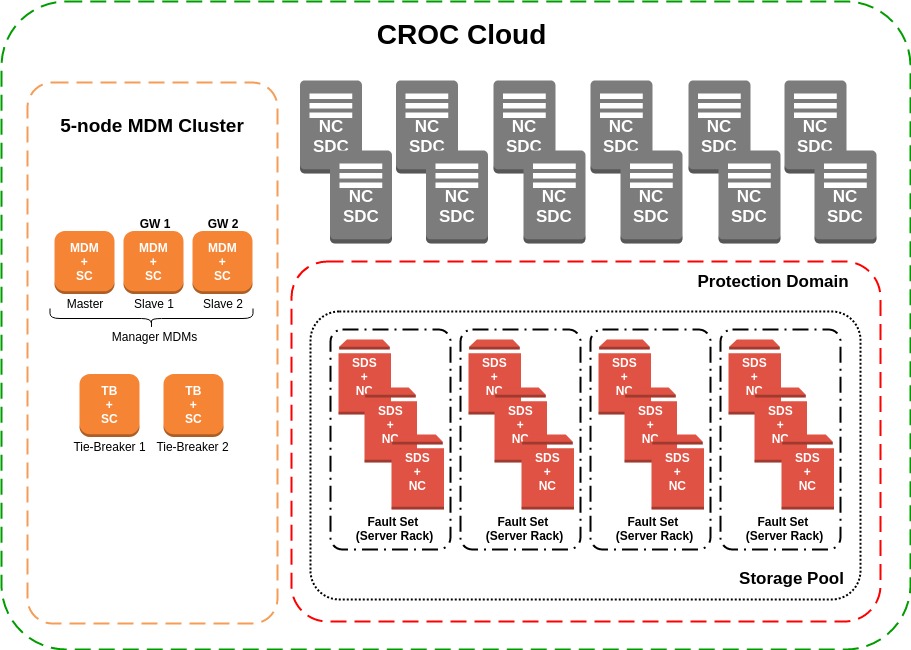
In the Cloud, there is a SC (Storage Controller) service that controls the execution of all operations associated with disks for virtual machines. Creating LUNs on various storage systems used by us, their further export to the desired hypervisor, increasing the size, deletion and the rest of the life cycle of devices. The most logical solution in this architecture was to deploy the MDM cluster on these servers. Physically, SC and MDM live on Dell EMC PowerEdge R510 servers with CentOS 7.2 as the OS. Also on the two servers of this group are the ScaleIO Gateway, which provide the REST API for managing the cluster. Everyone is in the Active state, but the Cloud accesses them through a balancer configured in Active-Backup mode.
For pre-production testing, we prepared a pool of 12 SDS, in each of which 4 SAS disks - Seagate 12Gbit / s 10K 1.8Tb 2.5 ". Further, all SDS were added to one Protection Domain, because the servers are geographically located in one data center, and in one Storage Pool. After this, the SDS were merged into groups in the Fault Set. Fault Set is an extremely interesting concept, which involves splitting servers into clusters with a high probability of simultaneous failure. And the reasons for this can be any: both the features of the installed OS and the location in one rack in an area with a high probability of falling eteoritov. The data will be mirrored in such a way to avoid getting copies into one risk group.
When using the Fault Set, it is also necessary to allocate a certain percentage of the total raw volume for the Spare-space. This is a reserved place, equal to the largest Fault Set, which will be used if you lose a disk / server / Fault Set during the cluster rebuild. Therefore, we group servers into SDS locations in server racks, which ensures availability of a copy of the data even after losing all servers in one Fault Set, for example, in case of a power failure in the rack. Although, in our data center with TIER-III certification, the probability of this is extremely small. The total size of the test pool:
- 78.5 TB of wet space;
- 25% Spare space - 19.6 TB;
- 29.5 TB of usable space (taking into account the replication factor - 2).
All SDS are located on nodes with a hypervisor (NC) and SDC - our version of the convergence of systems. The decision to place SDS on servers with a hypervisor came consciously. During the initial tests, we monitored the load created on the server with the disks, tried to detect a noticeable effect, the load on the CPU, RAM and OS - in vain. What pleasantly surprised us. And since keeping dedicated servers for disks with an idle CPU is not very profitable, and the increase in the number of SDS is expected in the future, the solution was asked by itself.
Clients (SDC), respectively, are servers with a hypervisor, providing ScaleIO disks as block devices for VMs. Physically SDC and SDS are located on Dell EMC PowerEdge R720 / R740 servers and the same CentOS 7.2. As for the network component, the data transmission takes place on 56 Gbit / s InfiniBand (IPoIB), the control is 1 Gbit / s Ethernet.
After collecting the entire cluster and making sure that it works, we started testing it.
Primary tests and analysis
Initial performance tests were carried out without the participation of the hypervisor and virtual machines: the volumes were connected to empty servers and mercilessly loaded in attempts to find the performance ceiling by IOPS and Mbps. Along the way, we determined the maximum latency in various conditions: an empty cluster, packed to capacity, etc. Having obtained varying results, we realized that magnetic disks are not the most stable thing, especially under maximum load. But we got an approximate cluster performance limit: for a test cluster of 48 1.8 Tb SAS 12 Gb / s 10K disks with a “raw” volume of 78.5 Tb, the maximum IOPS in the most complex tests was about 8-9 thousand IOPS (later testing and other details). In the future, we have focused on these indicators.
In parallel with all this, we analyzed the load on storage systems in production and virtual disks that we planned to transfer to ScaleIO. From two sites received the following averages for a period of 3 months:
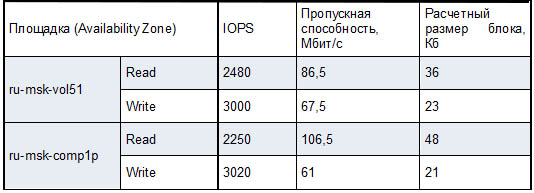
On the one hand, the recording occurs more frequently with a ratio of 45/55 on the number of operations, on the other hand, reading takes place in larger blocks and loads the storage system by 30, or even 70 percent more. We used these indicators later on when testing on virtual machines in order to reproduce the load on real servers as accurately as possible.
Implementation never goes smoothly
Cheap room of fear: dark and rakes everywhere.
Every group of our Cloud team had a headache during the introduction of a new type of stack. However, such tasks and difficulties are always a great experience. We tried to list the most important issues.
API client to ScaleIO
Having an interesting experience of working with the “array of violins” API, we decided that at the stage of choosing a solution we would test the operation of the API of each of them under loads and parallel queries. And since most Cloud services, including SC (Storage Controller), are written in python, it was important that the solution also had an API client in the same language.
And here we had a problem: ScaleIO API client was only for version 1.32, and we were testing version 2.0 already. I had to postpone testing a bit and write my own API-client - pyscaleio . It turned out to implement not only the basic CRUD operations, but also a full-fledged ORM for some API entities, validation of responses and management of client instances. And most importantly, all the code was covered by unit-tests, and functional tests were written on the most important API-operations, which can be run on a running ScaleIO cluster.
Of course, we managed to find several bugs in the API. For example, it was possible to set the IO limit for the disk (throttling), but it was impossible to remove it, because “iopsLimit (0) must be a number larger than 10” . But we were not going to use throttling at the SDS level, so it was not critical. In general, the ScaleIO API under load proved to be excellent: there were no problems either with a large number of disks created or with the execution of parallel queries.
Throttling
During the initial load testing, which was written a little higher, the approximate performance limit of the ScaleIO cluster became clear, and we had to decide how to limit customers' disks and how to position a new type of storage. After analyzing the results, it was decided to limit the disks on IO-operations to 500 IOPS, and limit the bandwidth depending on the size of the disk. It does the same for AWS for its “Throughput Optimized HDD” drives. As the disk size increases, the limit is recalculated automatically.
For example, for a disk of 104 GB (the disks in ScaleIO must be a multiple of 8 GB - the system limit):
Size (GiB) | MBPS Baseline | MAX MB / s |
104 | 0.25 | 26 |
(MBps Throughput / KB per IO) * 1024 = MAX IOPS
26/53 * 1024 = 502 IOPS
15.6 / 32 * 1024 = 500 IOPS
26/64 * 1024 = 416 IOPS
26/128 * 1024 = 208 IOPS
If you need better performance, the disk will have to increase. And if you need great performance on small disks, you will have to switch to the “flash” storage type with guaranteed IOPS and the ability to change them. Fortunately, the cloud provides live-migration of disks between storage types, which greatly simplifies life.
Thin discs and emptiness
And just during the testing of live migration from other types of storage to the experimental ScaleIO, it turned out that the disk becomes “thick”, completely allocated, although it was created “thin”, and the original disk is filled with data less than half.
Inefficient waste of resources is always sad, so we started looking for the cause of the leaks.
In the cloud, QEMU-KVM is used as a hypervisor, which gave us the opportunity to study the problem at a low level. The block device driver in the hypervisor is able to efficiently write zeros to the device by executing the BLKDISCARD system call and deallocating the space inside the disk. However, in addition to supporting the operation BLKDISCARD, the block device also needs support for the BLKDISCARDZEROES option. Otherwise, reading from those blocks for which BLKDISCARD was called may return non-zero values.
Support for the BLKDISCARDZEROES option was not available for ScaleIO drives. But if you execute BLKDISCARD on the entire ScaleIO disk, the space will be correctly allocated. It turns out either in ScaleIO the semantics of BLKDISCARDZEROES is implemented somehow in a special way, or the flag is simply set incorrectly. The Dell EMC forum suggested that BLKDISCARDZEROES semantics is not fully supported, and in order to effectively write zeros, BLKDISCARD requests must be multiples of 1MiB.
The solution to the problem was found and it remained to “teach” the hypervisor this specific semantics of effectively writing zeros. For this, changes were made to the QEMU-KVM block device driver , by analogy with similar behavior for XFS. We often make various edits to the hypervisor, and for the most part these are backports from newer versions or upstream, but this time it’s our own changes, which we are very pleased about. Now, during the live migration of disks, space on the cluster is being spent efficiently.
And exactly emptiness?
During the re-testing of live migration with an updated hypervisor, we noticed another problem: the source and target disks after migration differed, and in random places — either in the very first blocks or in the middle. I had to double-check the recent driver edits in the hypervisor, the integrity of the original disk images, the use of page cache when writing. It was quite difficult to isolate the problem, but we managed to do it in a few hours, gradually eliminating all extraneous factors. We created a new thin disk, checked that there were zeros at the beginning, wrote down a certain pattern at the beginning, after which we deployed the beginning of the disk using BLKDISCARD, and when we tried to read again, we saw the same recorded pattern.
It turns out that the space is deployed, but the data remains. Despite the fact that this is very similar to a bug, it is better not to rush to conclusions and re-read the documentation. And it says that the Storage Pool in ScaleIO has an option “Zero padding policy”, which is responsible for filling the sectors with zeros during the first recording so that you can read those most cherished zeros. By default, this option is disabled and can be changed only if no physical disks have been added to the pool. Since the ScaleIO installation in production is already assembled, ready and actively tested, the pool will have to be reassembled.
Of course, additional write operations of zeros, during the first write operation to a non-allocated block, should affect performance. To assess this effect, we repeated part of the load test cases and saw a degradation of up to 15% during the first recording, but the load on the SDS did not change.
Thus, the driver of our own development helped us to find our own errors in the cluster assembly. After rebuilding the pools and enabling the necessary option, everything worked as it should.
Device Name
As mentioned earlier, each server with SDS is also a hypervisor, and there is an impressive number of VMs on it. This means that the total number of block devices on a server can be quite large, moreover, they can change very often, since virtual machines can be migrated and disks attached and detached.
Among all these disks it is necessary to allocate devices presented for ScaleIO. If you add them by short name, for example, / dev / sdx, then in case the disk was added after non-permanent devices for VM, after reboot, this name will change and ScaleIO will lose the disk. As a result, it will have to be re-added to the pool, which means conducting rebalance in the case of each maintenance work. Naturally, this does not suit us very much.
We collected the ScaleIO pool and did the first tests on empty servers without virtual machines. Thinking about it, only when they began to plan an increase in the main pool and waited for a new batch of SAS disks.
How to avoid such a situation? You can use symbolic links to a block device:
# udevadm info -q symlink /dev/sdx disk/by-id/scsi-36d4ae5209bf3cc00225e154d1dafd64d disk/by-id/wwn-0x6d4ae5209bf3cc00225e154d1dafd64d disk/by-path/pci-0000:02:00.0-scsi-0:2:2:0 The documentation from RedHat says that to reliably identify SCSI devices you need to use a system independent identifier - WWID (World Wide Identifier). Moreover, for us this is not news, since we use such identifiers when presenting block devices from “arrays-violins”. But the situation is complicated by the fact that we use physical disks connected via a RAID controller, which cannot be used in Non-RAID mode (device pass-through, JBOD). And we have to assemble a RAID-0 from each physical disk using MegaCli, the reassembly of which is a new SCSI device with a new WWID, and therefore it is impractical to use it.
I had to compromise and use the symbolic disk / by-path link, in which there is data that uniquely identifies the physical disk on the PCI bus. Since the disks were already inserted incorrectly, the administrators on duty had to add each physical disk in a new way to the ScaleIO pool, with awe at the progress bar of the cluster rebalance for several dozen hours.
Performance testing inside the VM
Since ScaleIO's disks were still planned to be used as disks for VMs, we received a large release from our development team, in which we received the long-awaited improvements described above. And taking into account the results of the initial tests and the analysis of the load on the replaced stack, we started testing ScaleIO disks already in virtual machines.
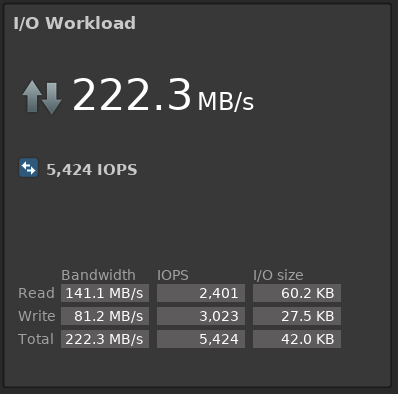
The algorithm was chosen as follows: 30 virtual machines on CentOS 7.2, a 128 GB ScaleIO disk is connected to every second block device (respectively, has a limit of 32 Mbps and 500 IOPS), one Zabbix server for monitoring with the removal of metrics every second and one more VM, constantly writing sequentially, 4k block, which will signal that it doesn’t receive much storage if the recording on it falls below 500 IOPS. On a certain number of test VMs, we simultaneously run the fio test utility with the same parameters and watch the ScaleIO GUI and the test Zabbix. Fio startup options:
fio --fallocate=keep --ioengine=libaio --direct=1 --buffered=0 --iodepth=16 --bs=64k,32k --name=test --rw=randrw --rwmixread=45 --loops=2 --filename=/dev/vdb In ScaleIO GUI with a load of 10 VM, we almost exactly simulate the average load on production storage:
Zabbix:
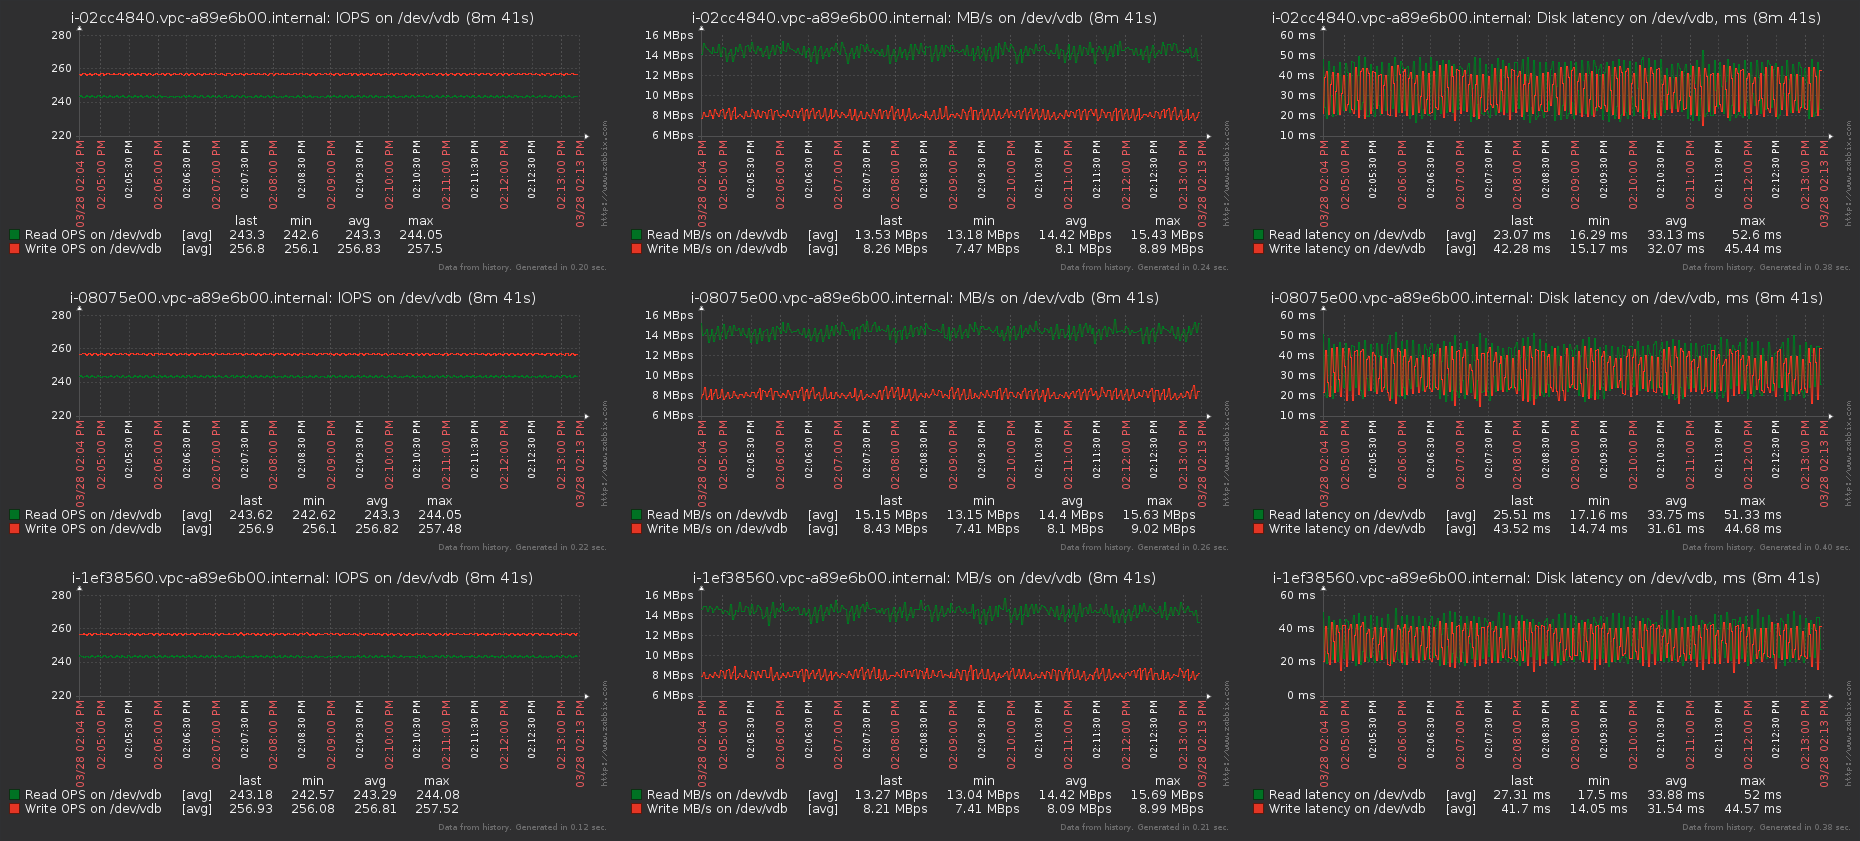
Each VM gets its promised IOPS and MB / s, latency is high due to the specified queuing depth of the test. With iodepth = 1 latency is about 1.6 - 2 ms, which, given the virtualization layer, is pretty good. By the way, I can advise a good article about IOPS, latency and storage performance in general - Understanding IOPS, Latency and Storage Performance .
On the graphs of a free-standing VM, which measures the effect and drawdown of performance, there were no deviations from the norm for the entire duration of the test.
Then they gradually increased the number of simultaneously writing virtual machines and reached a performance limit of about 9000 IOPS and 800 Mbit / s, when the drawdowns on the remaining VMs did not begin. These figures roughly coincided with those that we obtained by testing the cluster without using the VM, so we considered them normal for the current number and characteristics of the disks.
After these tests, we decided to understand how the performance will increase with the expansion of the cluster volume. They removed 2 SDS and began to carry out repeated measurements of performance when adding each node back. As a preliminary conclusion, it was established that adding each new SDS to a cluster directly increases the IOPS / Mbps ceiling. So, we are already waiting for the delivery of new disks to increase our usable volume by about 5-6 times, so the peak loads of the current production storage with new performance indicators and smart throttling will not frighten us.
Another test case was fault tolerance: we took out the disks from the servers, turned off the entire server within one Fault Set, and worked on other indecent acts. Is that only an ax cables are not chopped. The cluster did not fail, the data continued to be available, and the performance almost did not suffer: for a minute IOPS sagged by 10-15%. The main thing was to choose the right rebuild / rebalance policy, which is set by the following commands:
scli --set_rebalance_policy scli --set_rebuild_policy We stopped at limiting the number of IO and bandwidth rebuild / rebalance in Mbps for each disk connected to SDS.
Conclusion
At the moment, the cluster is undergoing pilot operation on internal accounts in order to catch the maximum of possible problems or errors on themselves, and not on customers. After correcting the last minor errors in the work of the Cloud services, all our customers will have a new type of storage available for creating disks - Universal (Universal).
You can get a demo access to our Cloud or ask questions by contacting below.
Links
- Cloud Croc
- Mail Team Cloud - cloudteam@croc.ru
- My personal mail is IEmmanuylov@croc.ru
Source: https://habr.com/ru/post/358732/
All Articles