Q & A Explorer. April feature for Power BI Desktop
Empowering the Question Answer feature
Today we would like to take a closer look at the April update of PBI Desktop. In the updated version of PBI Desktop, it is possible to add a special window to the report page, where it is possible to use the Question-Answer function (Q & A Explorer). This function allows users to ask questions of interest to them on the data, being on the report page. To run this function, you need to set up a special Q & A Explorer button.
Customization
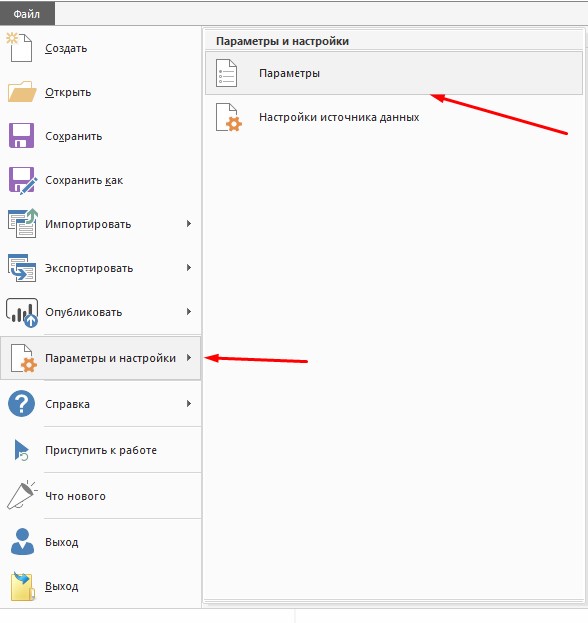
To do this, we go into the parameters of Power BI Desktop and turn on the Question-Answer function (Q & A Explorer).
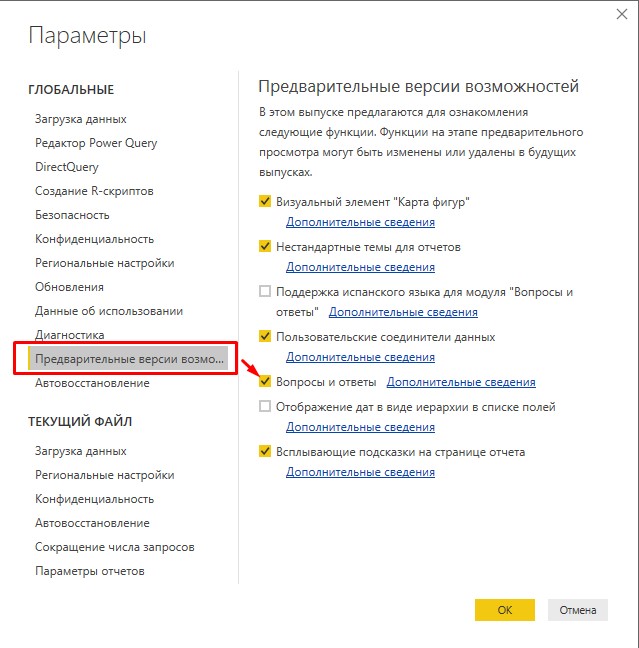
Next, we select "Preliminary versions of features", enable the "Questions and Answers" feature and restart Desktop.
')
"Buttons"
A new feature has appeared on the “Home” ribbon called Button or simply “Buttons”.

When creating any button, they will differ only by the icon inserted into them. Thus, if this is the “Right Arrow” button, an arrow will appear with a direction to the right, if “Help”, then a question mark, etc. We can select a button with a bookmark element and set it up for the Q & A function and vice versa, take the Q & A button and make a bookmark from it. You can also create several buttons with default options: “Back”, “Bookmarks” and “Questions & Answers”. For example, the “Back” button by default takes the user to the previous page of the report. After, we press the Ctrl + LKM buttons and go to the previous page of the report.

In our case, we throws on page number 2

"Questions and Answers" button
Next, we will look at the Questions Answers button in this article.
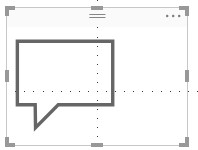
At the very beginning we have a small element of the report with a picture, which can be edited as a visual element: change the background, fill, insert text, include the border, choose the location of the text and image. In addition, for such buttons there is the ability to configure in three different states: “Default”, “Navigate” and “Selected”. Also, we can customize “Button Text”, “Icon”, “Contour” and “Fill”.
Now we will consider the “Button Text” option.
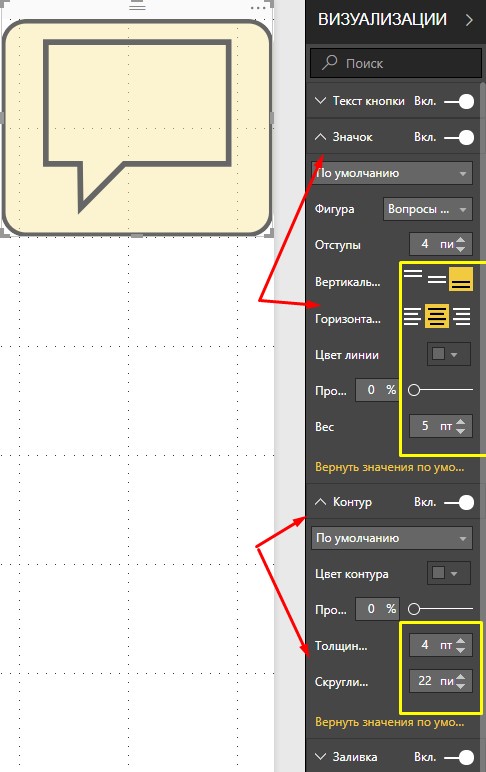
To begin, we will format this button: we will fill (background), turn on the contour and round the edges, adjust the icon, align it horizontally / vertically and make the weight more thickened.
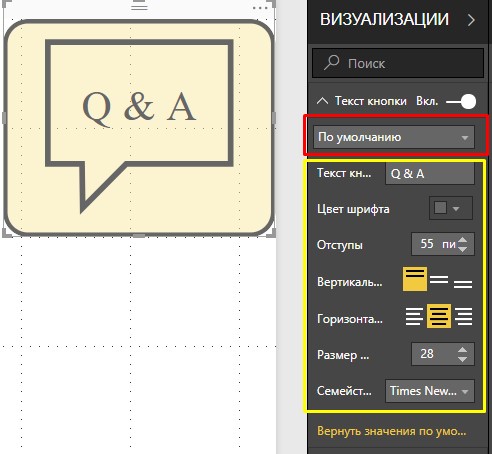
Now we will go to the “Button Text” tab and set the “Default” value. Next, we will write the text “Q & A”, which is aligned, increased in size and font. It will look like the image below.
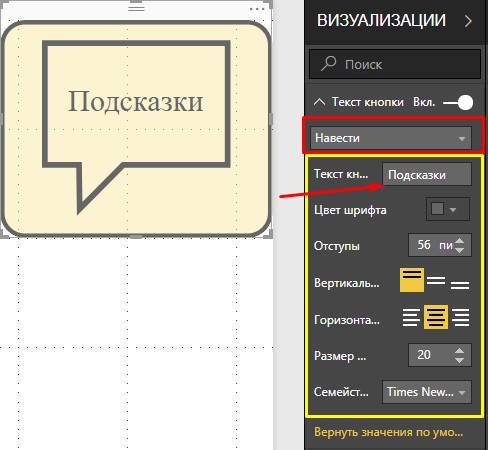
From the drop-down list, select the value “To hover and enter the text“ Hints ”in the field (you can change other values yourself). At first it seems that nothing has changed, but at first glance. If you hover the mouse over the button, the same text that we entered earlier will appear. Each time by moving the cursor past the button, we will see the text driven into the field settings.
If we select the “Selected” value, we will have the opportunity to select the text that appears when the Ctrl + LMB button is launched. If in the two previous states there was still a certain sense (to diversify the picture), then for the value “Chosen” it does not make much sense to make separate settings. This is due to the instantaneous download speed of the question window and there is no point in changing both the text and anything else. As for the other tabs, they have a similar principle of operation.
Now we go to the tab "Action"
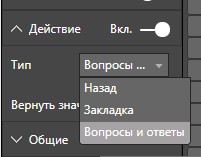
It has the ability to set an action that works when you press a button. The April update allows you to choose between the “Back”, “Bookmark” and “Questions and Answers” windows.
Now we will start working with the Q & A themselves. With the data source, we took the Excel table Financial Sample and built a report consisting of two pages (Fig. 1 and Fig. 2). After creating the Q & A button, we launch it by pressing Ctrl + LMB on it.

Next we will go to the Q & A editing window for recording questions and viewing them.
Question and Answer Editor Window
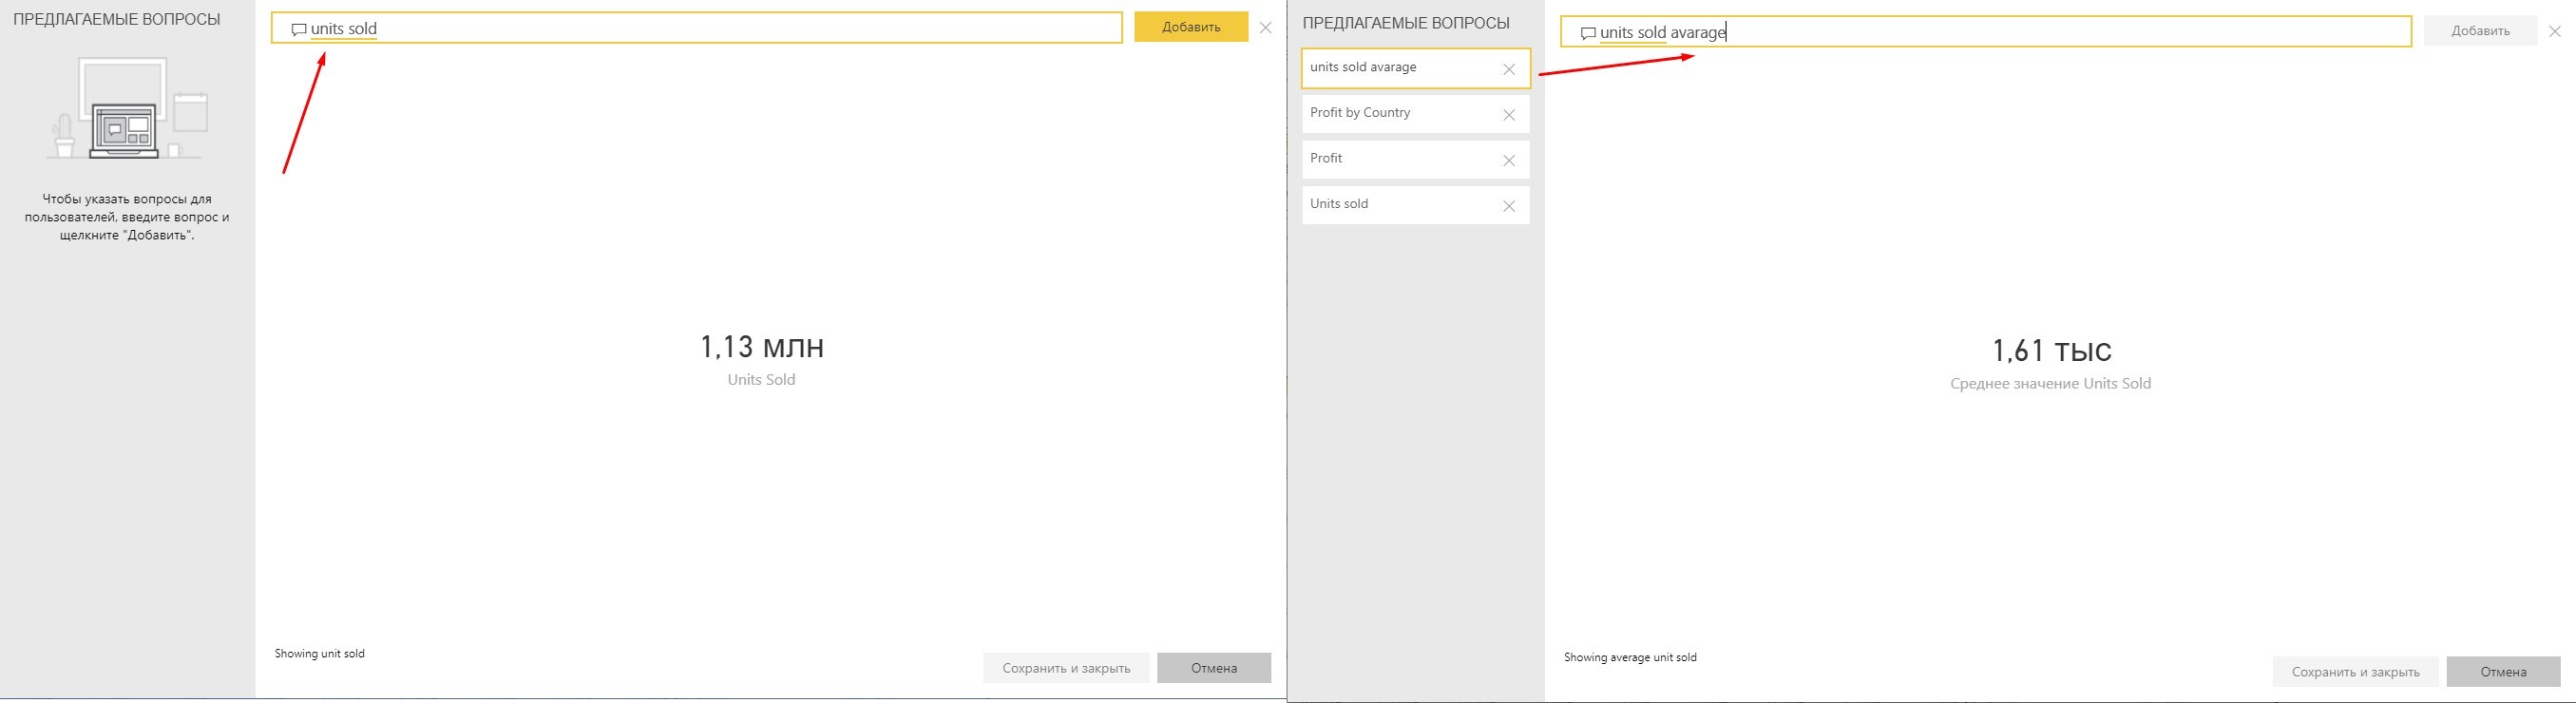
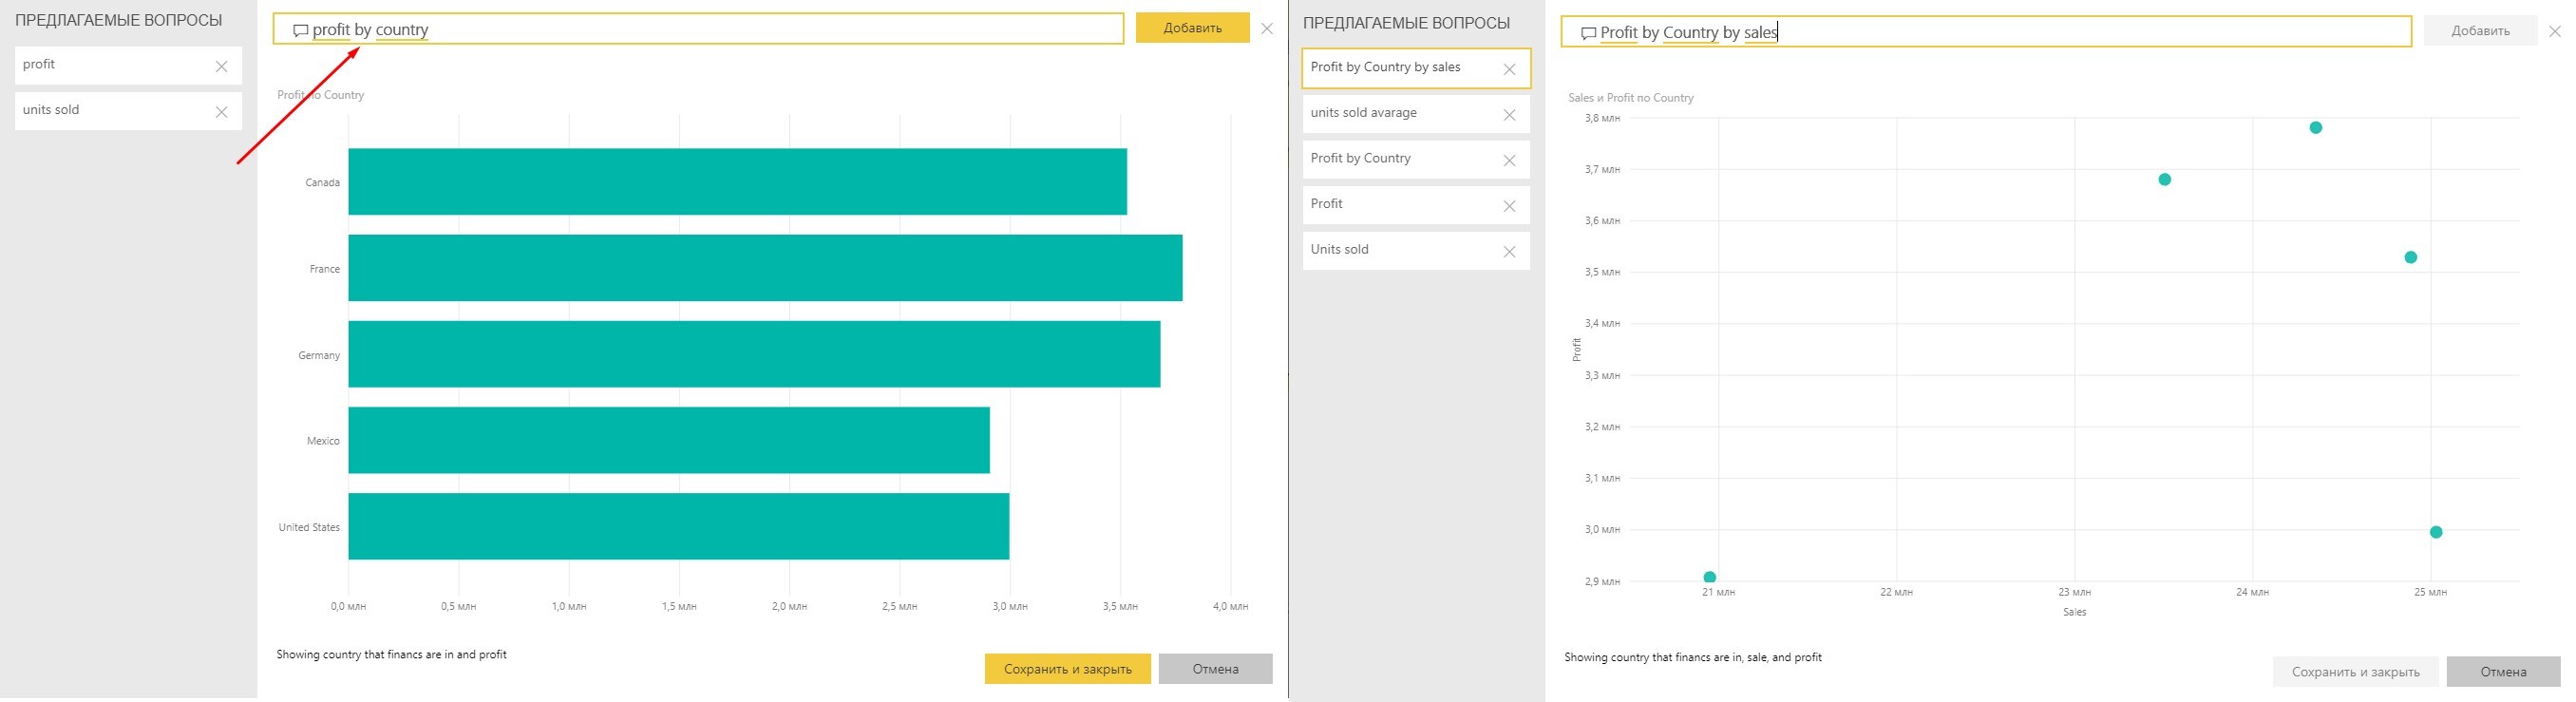
We will be able to write the name of the field that Q & A will use the aggregation functions of numeric values for this field. We will be able to select a specific function to use in the question. After we create a question and get an answer in the form of a visual object, click “Add”.
We can build simple visualizations based on two or three fields.
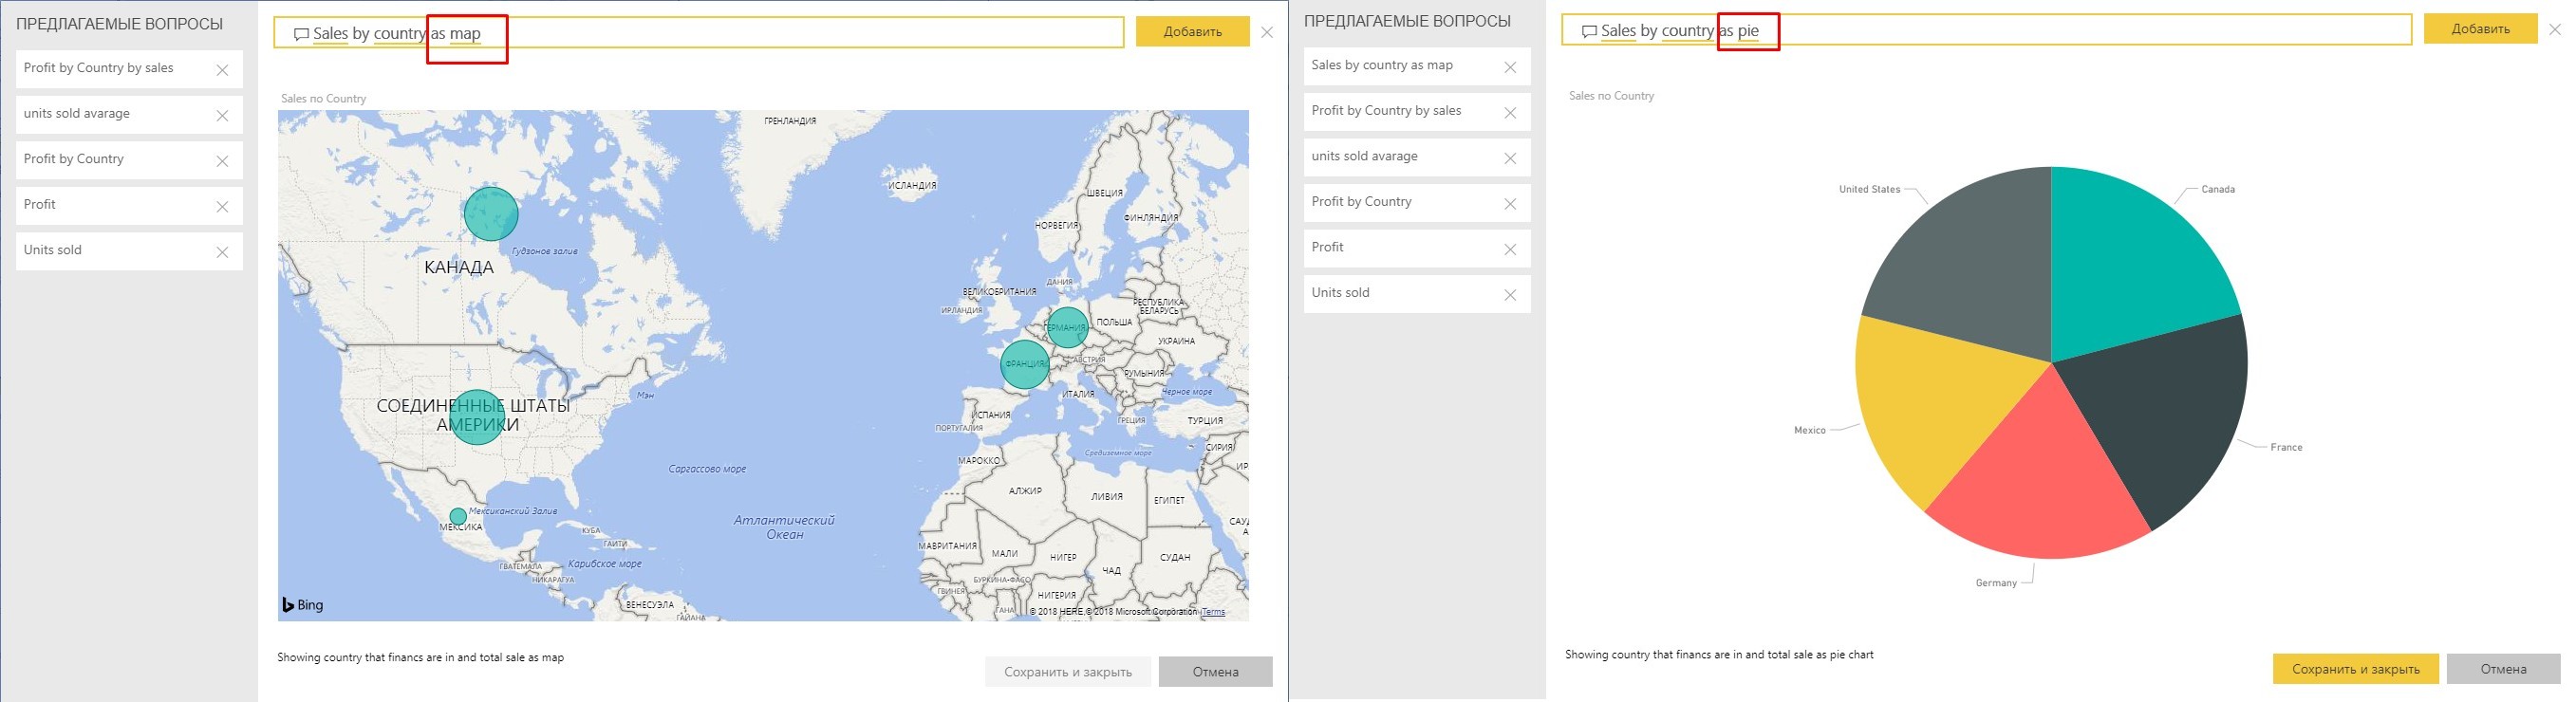
You can also select a specific type of visualization.
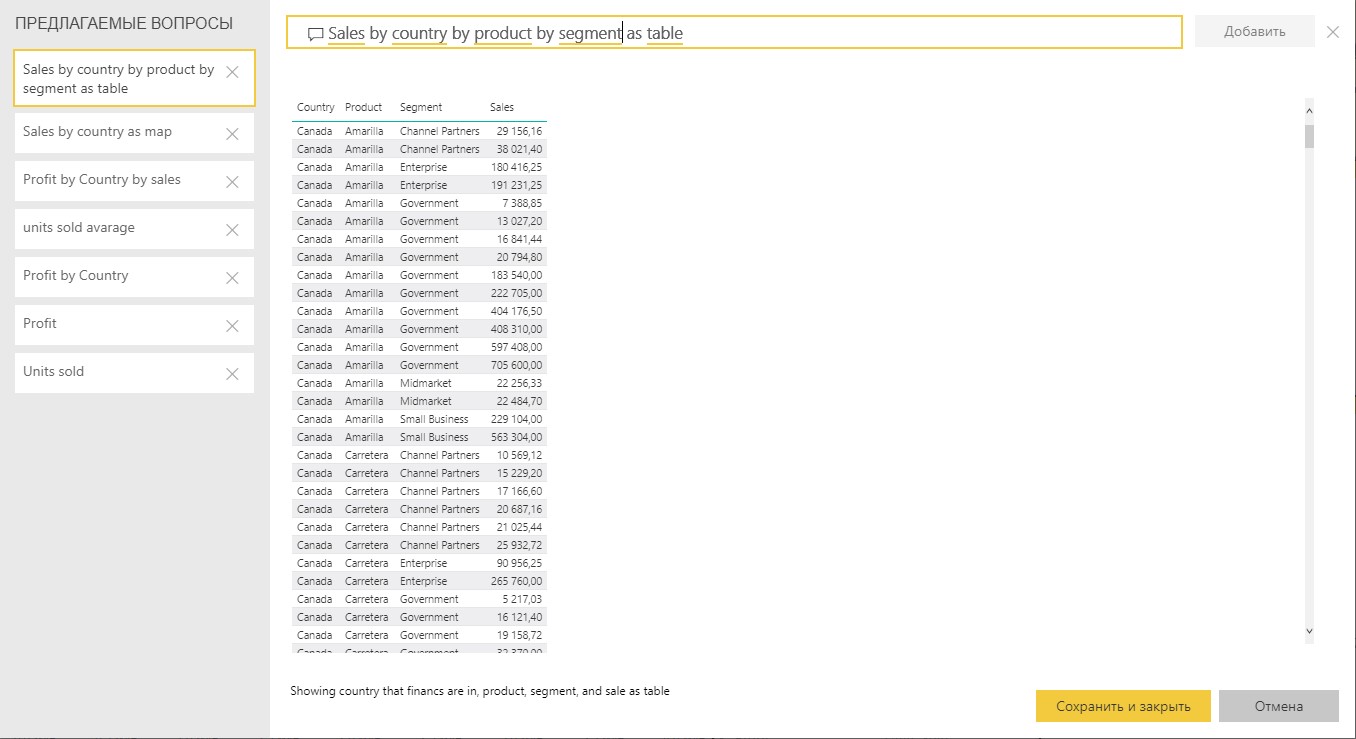
build tabular forms
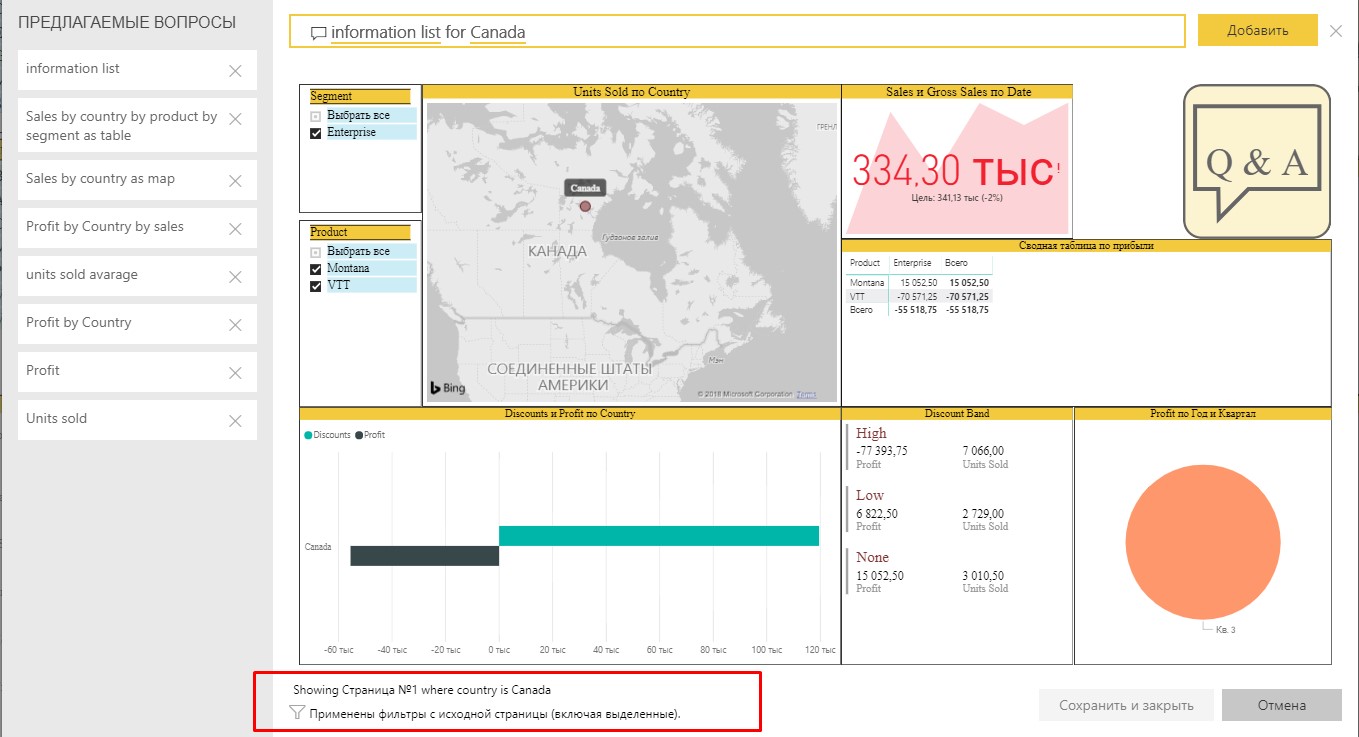
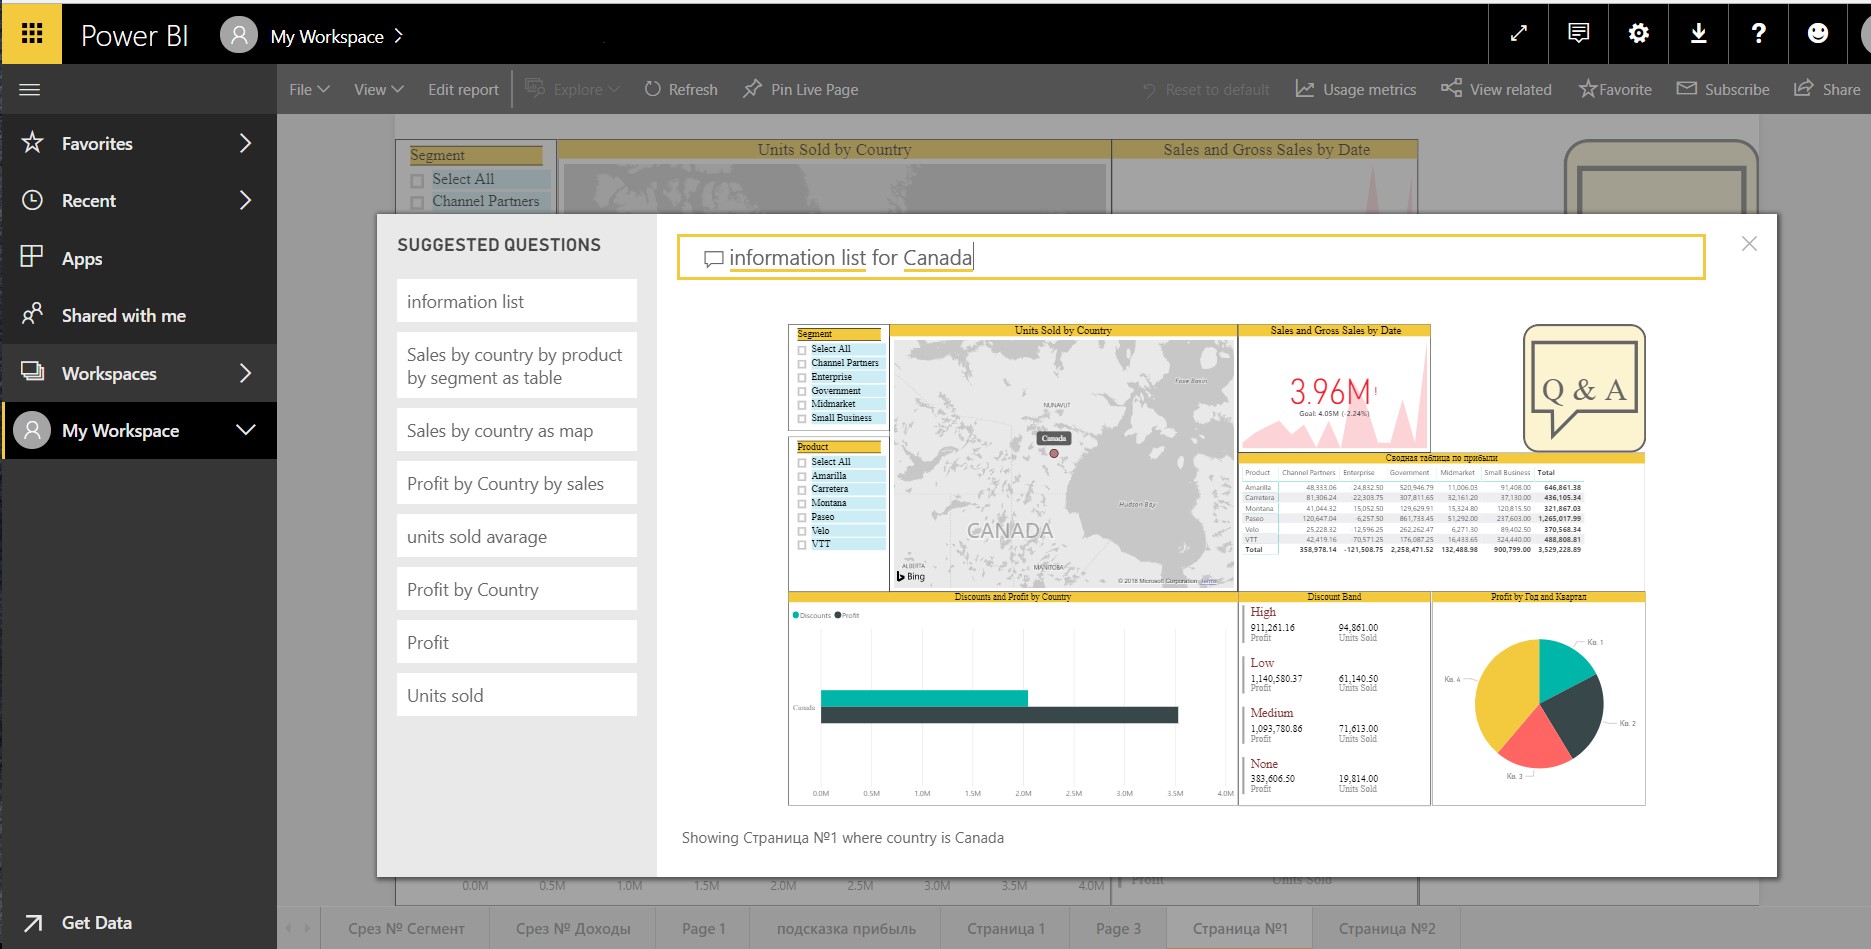
The Q & A Explorer function can return report pages as answers. To do this, you need to enable Q & A for the page in the settings and give it some synonyms (phrases). To do this, we will enter these synonyms in the field of questions

Also, if you set a filter at the report page level, you can set the condition for selecting a value from this filter in the Q & A Explorer by ticking the “Required value to display the page in the“ Questions and Answers ”section. If you do this, you can use this filter in Q & A to filter the page. Since end-to-end filters automatically require a separate selection, they are automatically parameters for Q & A pages. When you create such filter parameters, you will need to specify a value for the filter so that the page is displayed in Q & A.

Also, the Q & A Explorer function will transfer filters from the original page to the Q & A window and this will be visible on the notification in the bottom of the dialog box. For example, we will filter the page by the Segment = Enterprise field and by the Product = (Montana; VTT) field.

The Q & A Explorer feature will work with other questions, passing answers through filters.
Power BI prompts you how to write questions by starting to enter field names.
For a more detailed study, please refer to the official Microsoft documentation:
• Tips for Q & A in BI
Questions should be written in English. If the columns are named in another language (Russian), then we write their names in the appropriate language.
Report publication
Now we will publish our report in the Power BI service.

and move on to the site in your work area by going to the reports section. We can work with Q & A Explorer created questions already in the Power BI service, reviewing them and, if necessary, writing new ones.
In cases where you use a data source with multiple tables, you must adjust the relationships between the tables before using the Q & A function to ensure that the Q & A Explorer function works correctly. We recommend not to take a similar data source, as we wanted to briefly show how the Q & A feature update works in new versions of Power BI Desktop.
During the preview stage, the Q & A Explorer feature will not be displayed for reports published on the Internet or in mobile reports. However, it will work in Power BI Embedded reports.
Source: https://habr.com/ru/post/358710/
All Articles