Troubleshooting Node.js Applications Under the Hood
Since the advent of Node.js, diagnostics has been improved in several stages, from debugging applications to in-depth performance analysis. This time we will discuss strategies for using tools such as core dump debuggers, flame graphs, production errors and memory leaks.
The material is based on the interpretation of the report by Nikolai Matvienko from Grid Dynamics from our December conference HolyJS 2017 Moscow.
To understand at what stage of the evolution of diagnostic tools we are now, I propose to turn to history. On the timeline, I depicted the most significant moments.
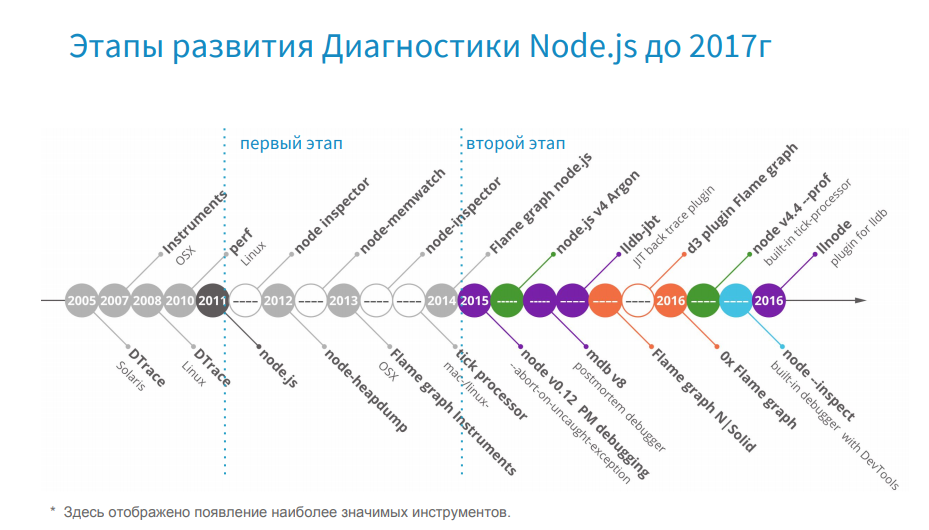
')
First, such tools as DTrace, Instruments, perf were published - these are system profilers that appeared long before Node.js, and they are still used today. With the advent of Node.js, Node-oriented tools come to us - here we should highlight node inspector, node-heapdump, node-memwatch. I marked this period gray and conditionally call it a troubled time. You remember that there was a split in the community: at that time, io.js separated from Node.js, and the community did not have a common understanding of where to go and whom to choose. But in 2015, io.js and Node.js merged, and we saw Node.js v4 Argon. The community has a clear development vector, and Node.js in production began to use such large companies as Amazon, Netflix, Alibaba.
And here, effective tools that are ready to work in production become popular.
Since 2017, I conditionally single out the third stage.
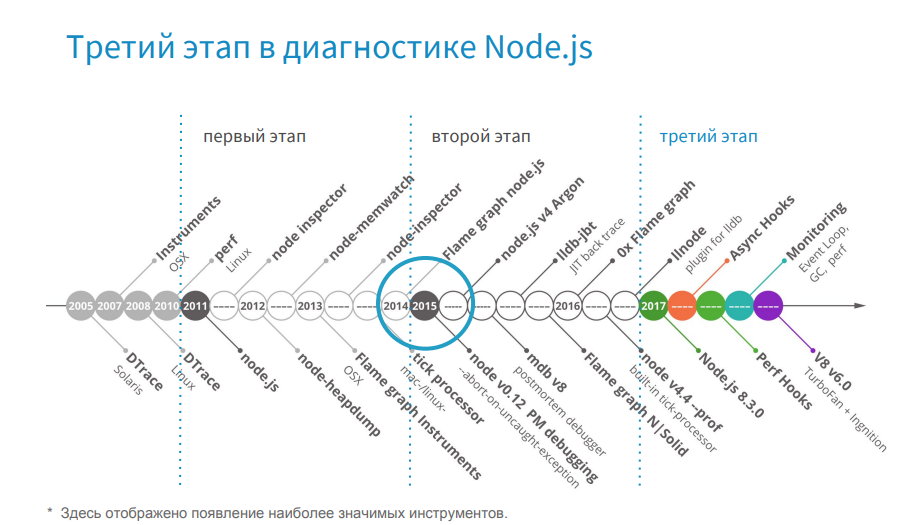
From this point on, Node.js has been developing qualitatively. It is worth noting the full transition to Turbofan and the development of Async Hooks.
In 2015, we launched the release on the Node.js 0.12 version and gradually updated first to the fourth version and subsequently to the sixth one. Now we are planning to move to the eighth version.
In the release year, we used tools from the first stage, which were low-functional for work in production. We have a good experience with the tools of the second stage, and now we use the tools of the third stage. But with the transition to new versions of Node.js, we are faced with the fact that we are losing the support of useful tools. In fact, we had a choice. Either we are switching to a new version of Node.js, which is more optimized and faster than the previous one, but we do not have the tools, and we cannot diagnose it. Either we stay on the old version of Node.js, which is slower, but we have the tools for it, and we know its weak points. Or there is a third option, when new tools appear, and they support, for example, Node v4 and higher, and the previous ones do not.
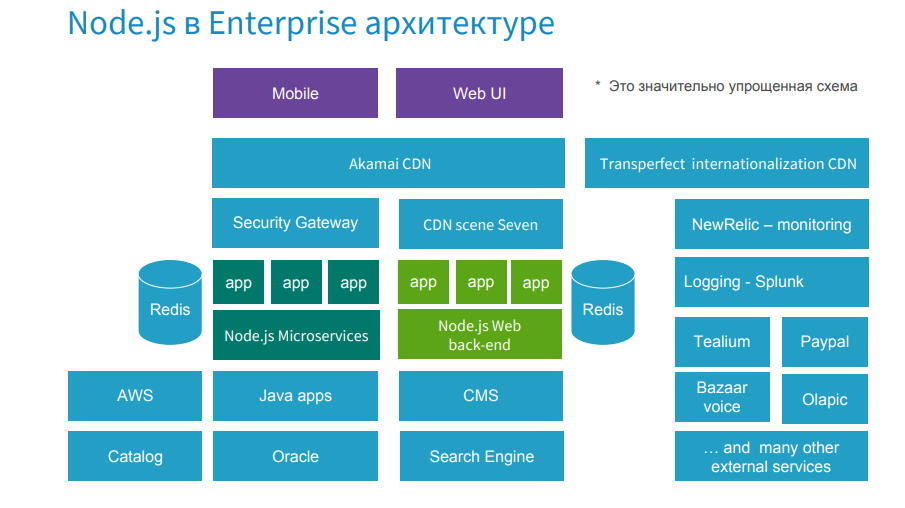
Our application is a large e-commerce project where Node.js applications (these are Web UI backend and Node.js microservices) occupy a central place in the enterprise architecture.
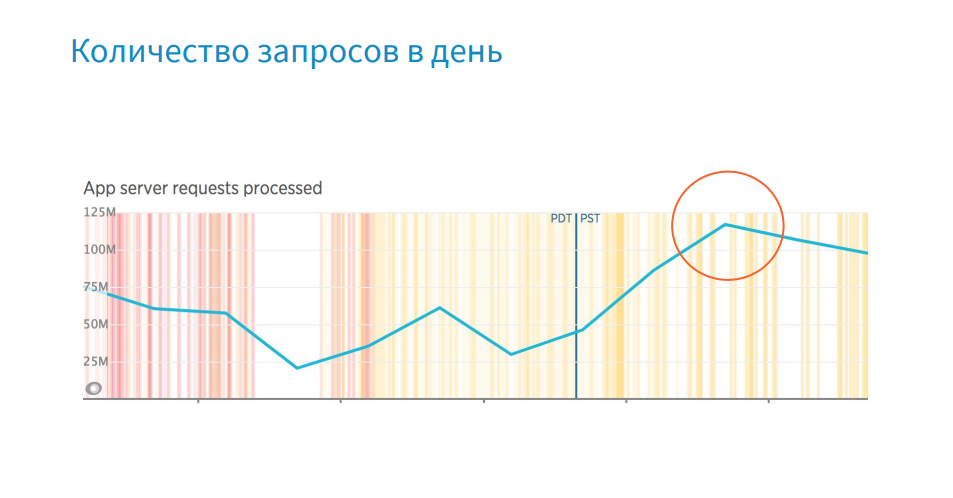
The problem in this place can come from any side. In the days of high loads, such as Black Friday, when a company earns 60% of its annual profit over several days, it is especially important to maintain high throughput. If some kind of malfunction happens, a local consultation is held, where all the heads of the systems are present, including me from Node.js. If the problem is on the side of Node.js, you need to quickly select a strategy, pick up the tools for it and fix the problem, because the company is losing thousands of dollars a minute.
Below, I would like to use concrete examples to show how we in production act in cases of errors, memory leaks and a drop in performance.
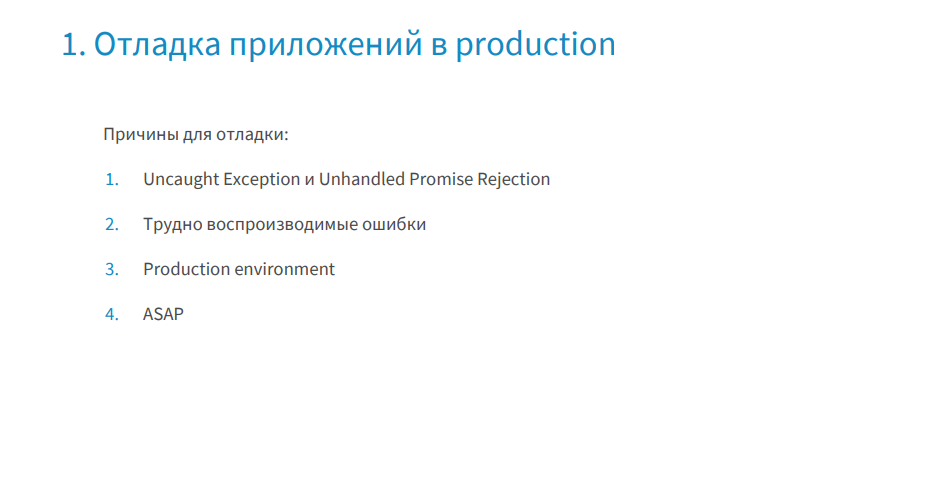
There are several prompts for debugging in production.
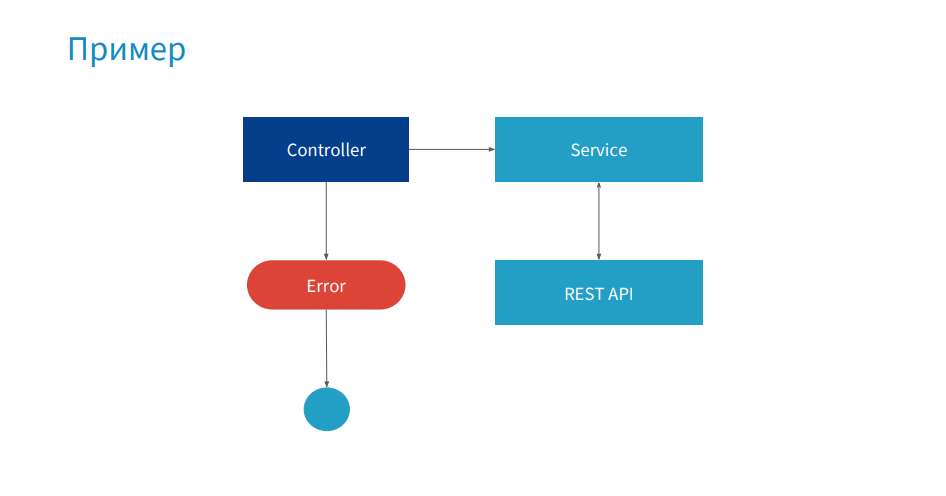
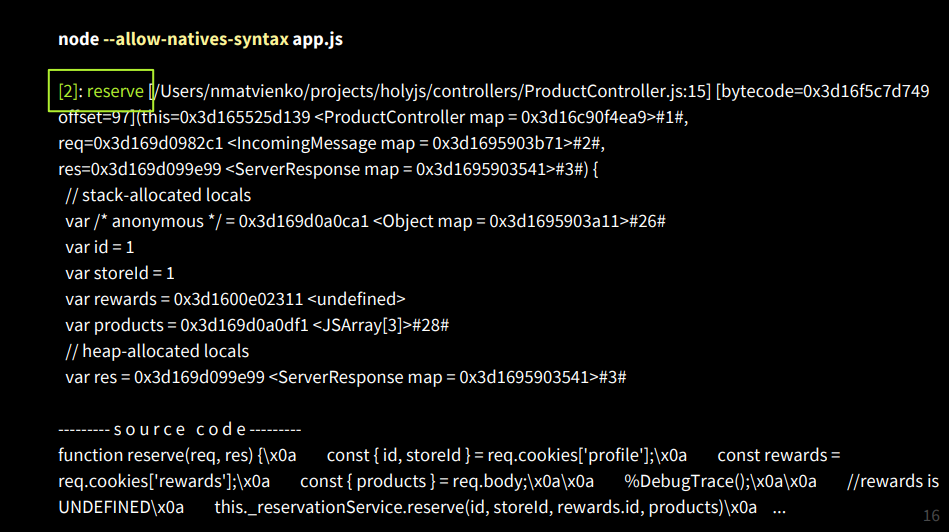
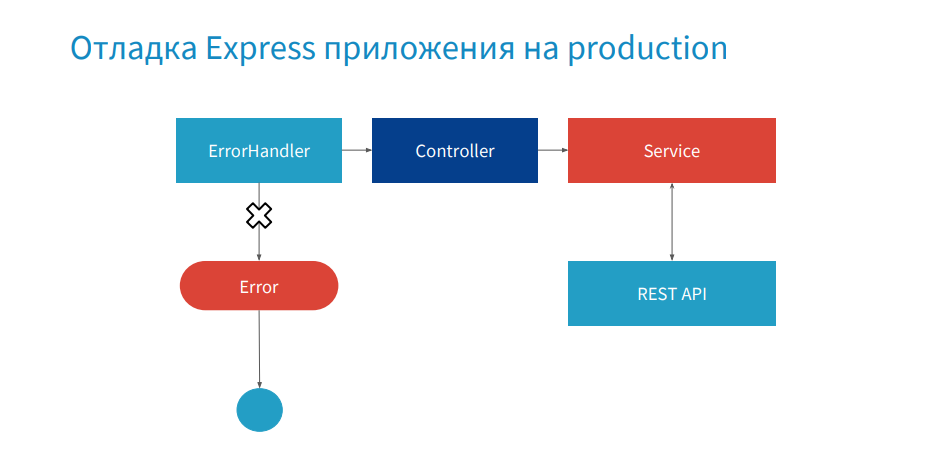
Consider a simple example: a service for backing up products. The controller uses service, which sends a collection of products to the REST API, returns data, and an error is thrown to the controller.
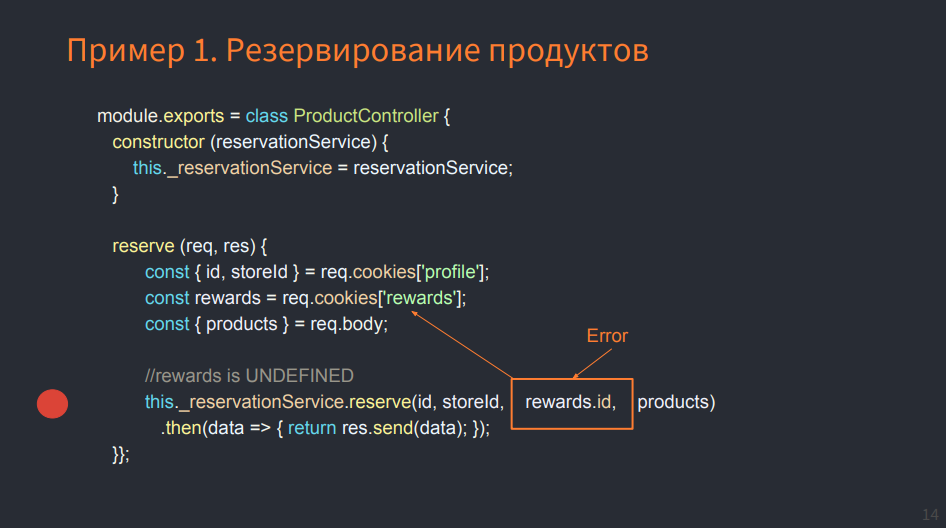
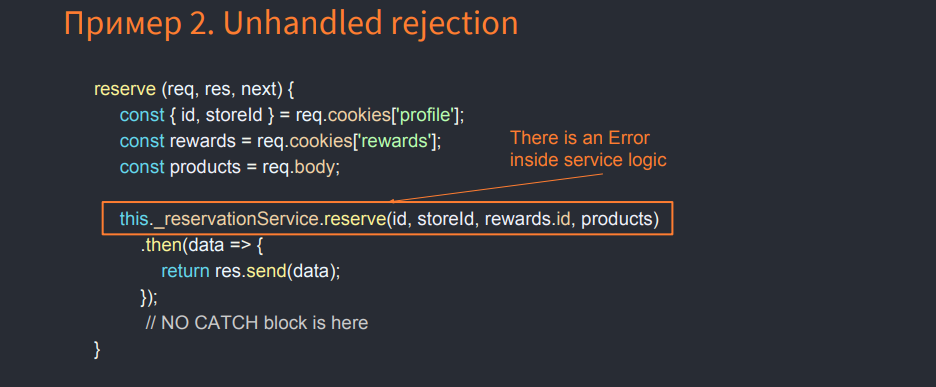
In the picture you see the listing of ProductController. In the reserve method we get the profile from cookies, also take a rewards account where bonus points, id and other useful information are stored, also from cookies. And this cookie is missing - undefined. In the case when id is taken from rewards, the error falls. Locally, we would set a breakpoint (red dot), get the status of all objects and find out the reason why the code falls.
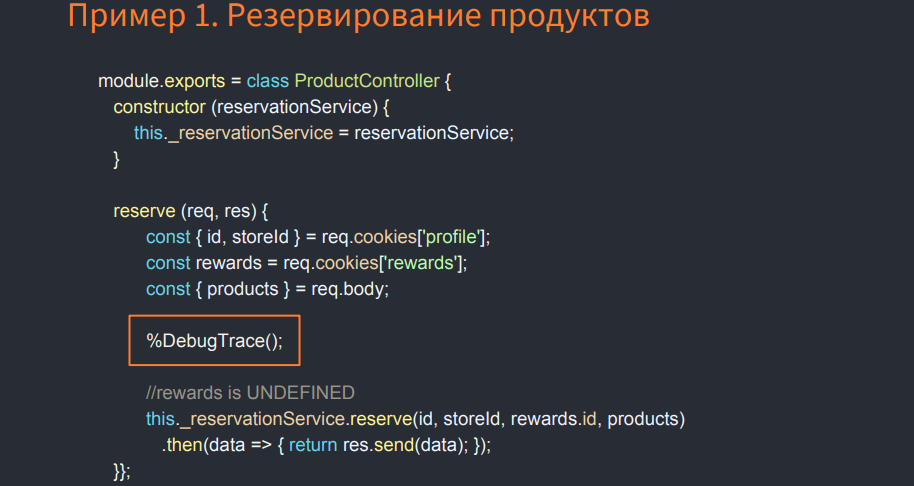
I'll show you how it works under the hood so that you understand what a stack track is. If you write the% DebugTrace () command, the native V8 command, and run Node.js with the --allow-natives-syntax option, that is, enable the native syntax in V8, you will get a big message from Stack Trace.
At the very top in the second frame we will have the reserve function before the controller method, and we will see there a link to the ProductController context - this, the request, response parameters, we will get local variables, some of which are stored on the stack, and the other in Heap (managed heap ). We also have the source code, and it would be nice to have something similar in production when debugging to get the state of the objects.
This support was implemented in 2015 from version 0.12. If we run Node with the --abort-on-uncaught-exception flag, a core dump will be created - this is the memory snapshot of the whole process, which contains the Stack Trace and Heap Dump.
For those who have forgotten, I remind you: the memory conditionally consists of Call Stack and Heap.
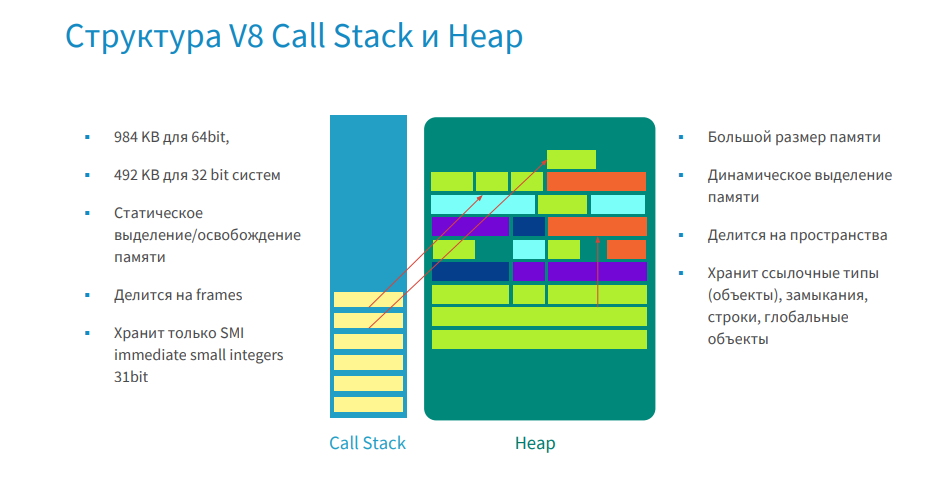
In Call Stack, yellow bricks are frames. They contain functions, and the function contains input parameters, local variables, and a return address. And all objects except small integer (SMI) are stored in a managed heap, for which there are addresses.
We figured out what the core dump consists of, now let's move on to the process of its creation.
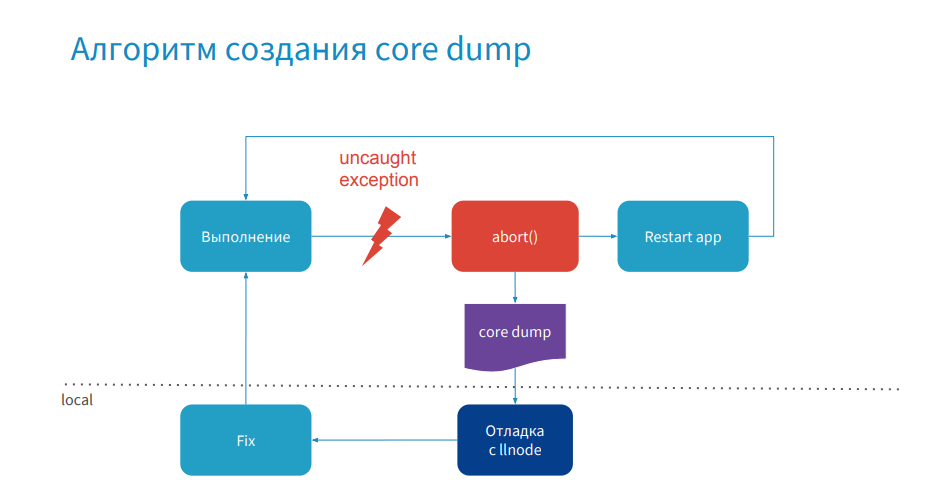
Everything is simple: the process of your application is executed, an error occurs, the process crashes, a core dump is created, then the application is restarted. Then you connect to production remotely or pull this core dump to your local computer, debug it, make a hot-fix and publish it. Now that we understand what this process looks like, we need to know which debuggers can be used.
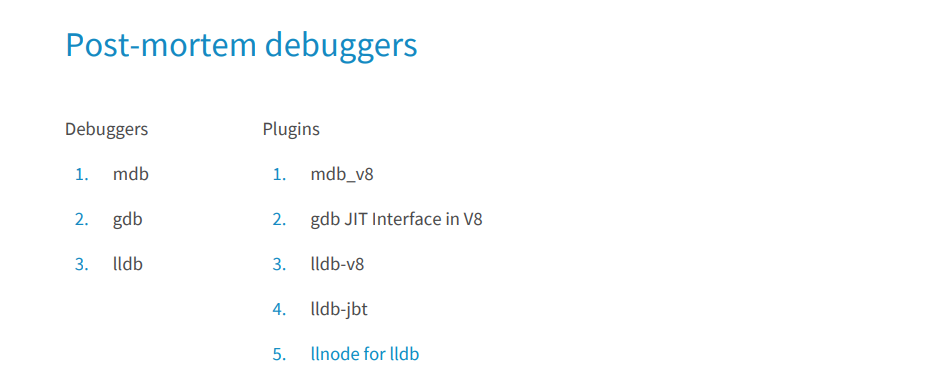
They all appeared before the Node.js. In order to read the JS Stack Trace, several plug-ins have been written to them at different times. Most of them are already outdated and not supported by the latest version of Node.js. I tried almost everything and in this report I want to highlight llnode. It is cross-platform (except for Windows), it works with the latest versions of Node.js, starting with the fourth. I will show how you can use this debugger to debug errors in production.
Consider the example described above - product reservations.
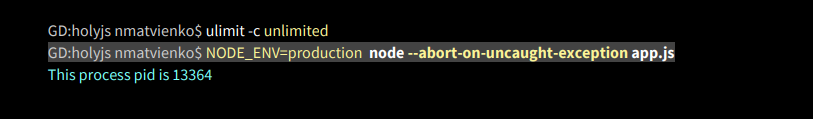
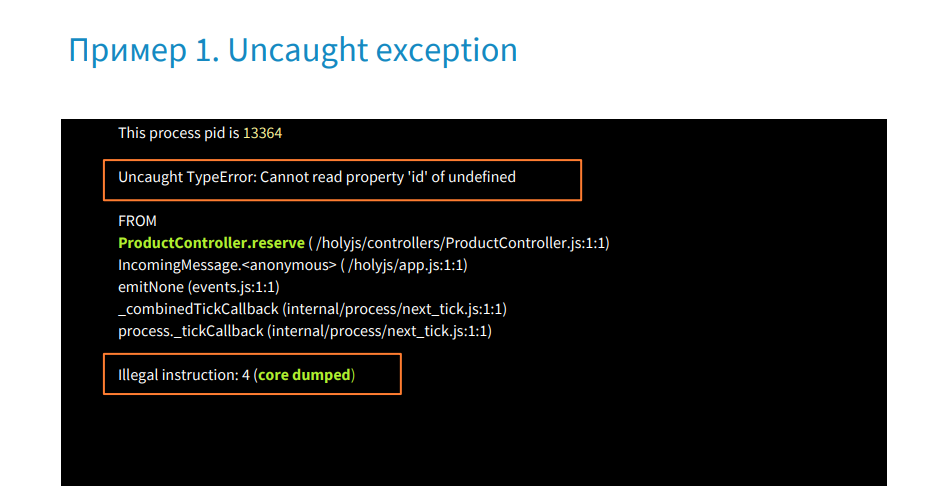
Set up the environment, set the possibility of creating a core dump, and launch our Node application with the --abort-on-uncaught-flag flag. Next, we get the process pid, we make a request to the user who does not have cookies reward, and we receive a message that the error appeared in the ProductController in the reserve method.
Next, we get the message that the core dump was created - a memory cast. Having received a core dump or access to it, we check its availability - it weighs 1.3 GB. A lot.
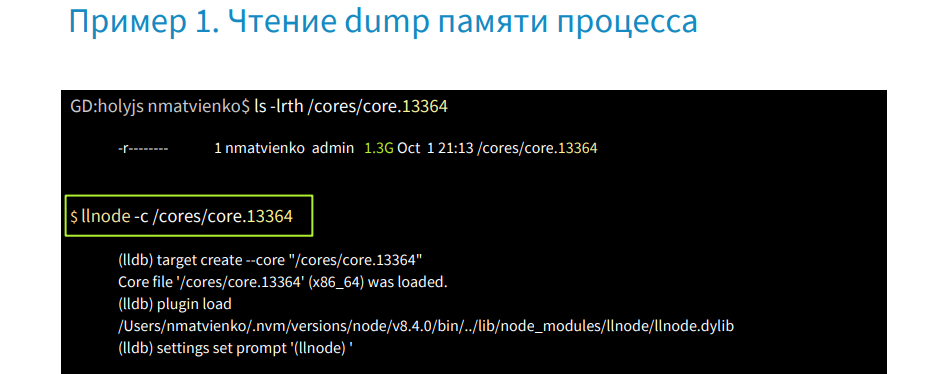
Run this core dump with a debugger using the llnode command, we can get the Stack Trace using the bt command.
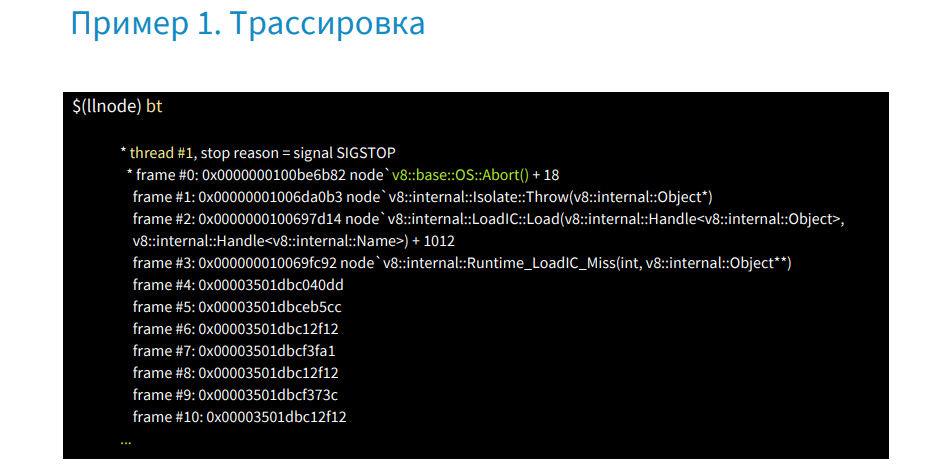
The image shows (above and below - in more detail) that there is no information in frames 4 through 20.
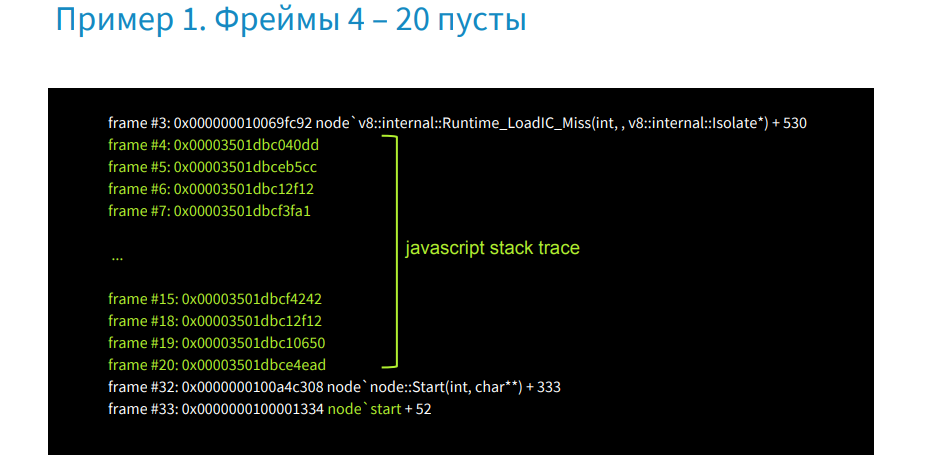
The fact is that this is JS Stack Trace, which C ++ debuggers cannot read. In order to read it, just use the plugin.
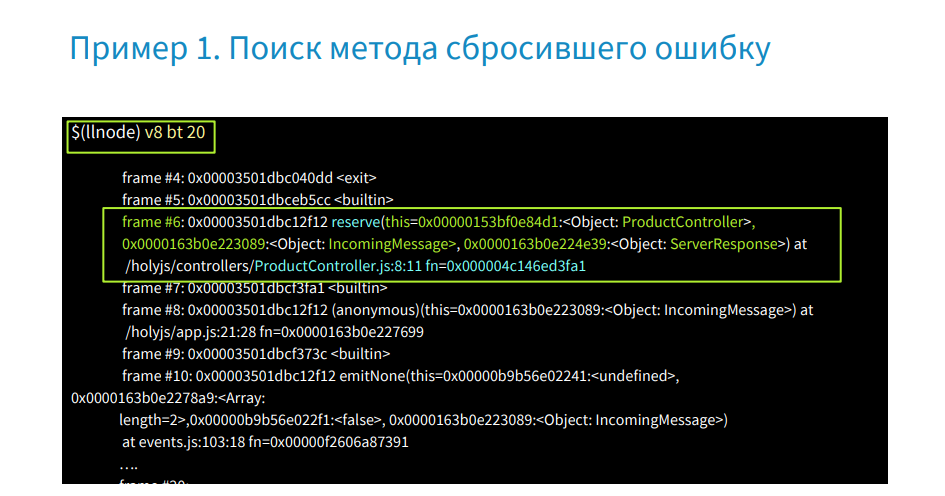
By running the V8 bt command, we get the JS Stack Trace, where in the sixth frame we will see the reserve function. In the frame there is a link to the context of this ProductController, parameters: IncomingMessage - Request, ServerResponse and blue is the address of the function in memory. At this address, we can get its source code from core dump.
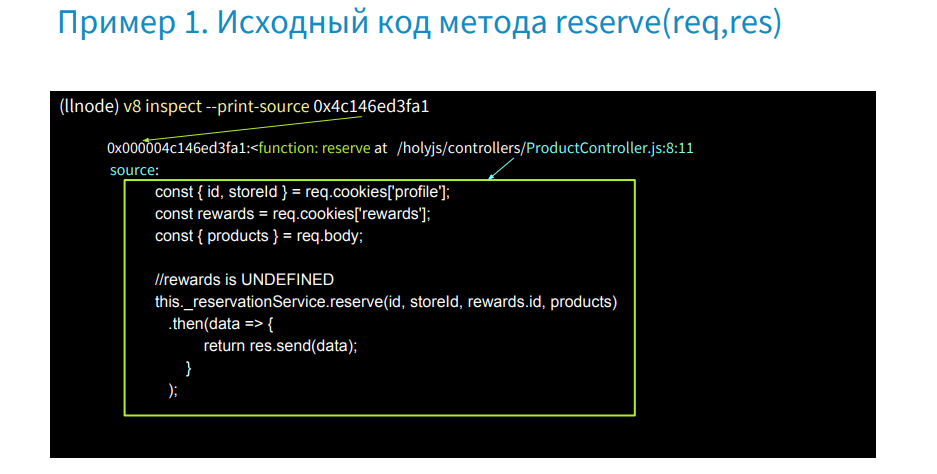
Next, we write the command v8 inspect --print-source [address] and get the source code of our function from memory.
Let's go back to the Stack Trace, there were the request and response parameters, and find out what was in the request.
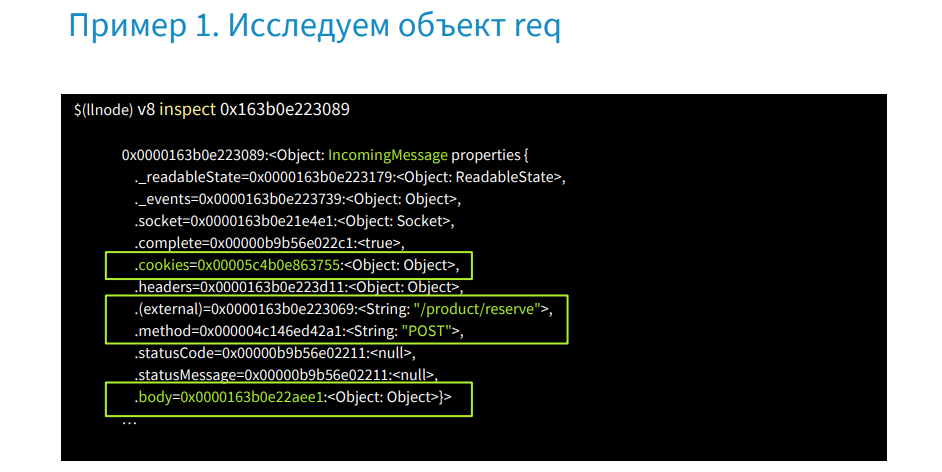
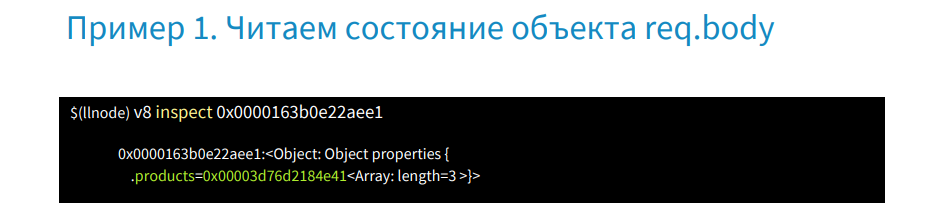
In the image we see the v8 inspect command with the address. After it is executed, we get the status of the request object. Here we are interested in the cookies property, url, POST method and body. Find out what products were transferred to the server.
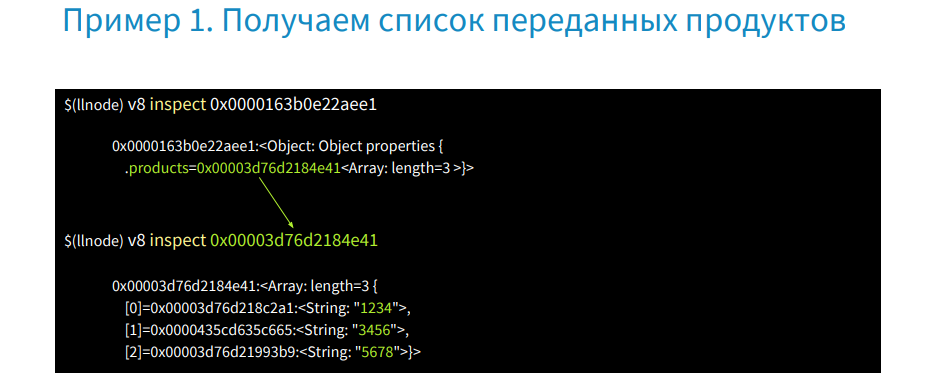
Let's write the command v8 inspect [address of the body].
We get an object in which the array consists of three elements in the products property. We take its address, we inspect and we receive an array from id.
There is no problem here. Let's see what was in the req.cookies object.
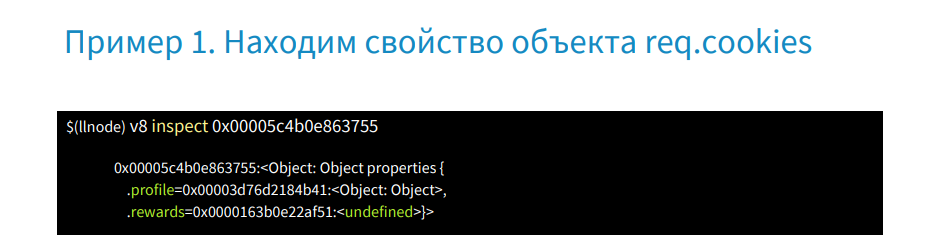
This is an object of two properties: profile and rewards - undefined. Find out which user has no rewards account.
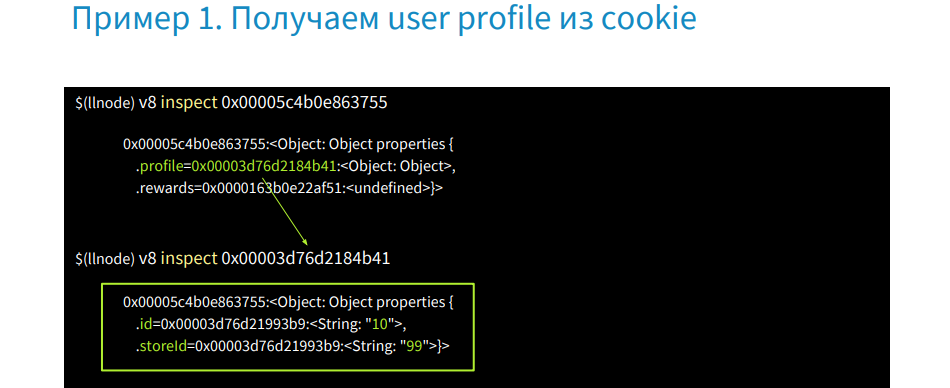
Let's write the v8 inspect command [profile address] and get its id and storeid. Thus, we managed to get the source code in production without source code and restore the user session.
Here was a very convenient case, and if you use a framework that contains ErrorHandler Middleware, then unlike the previous example, where we had links from Stack Trace to the context of this, request, response, if ErrorHandler is not rewritten, then you in Stack Trace there will be the last calls of Express itself and it will not work with anything. You will not have links.
I will give an example of how this happens.
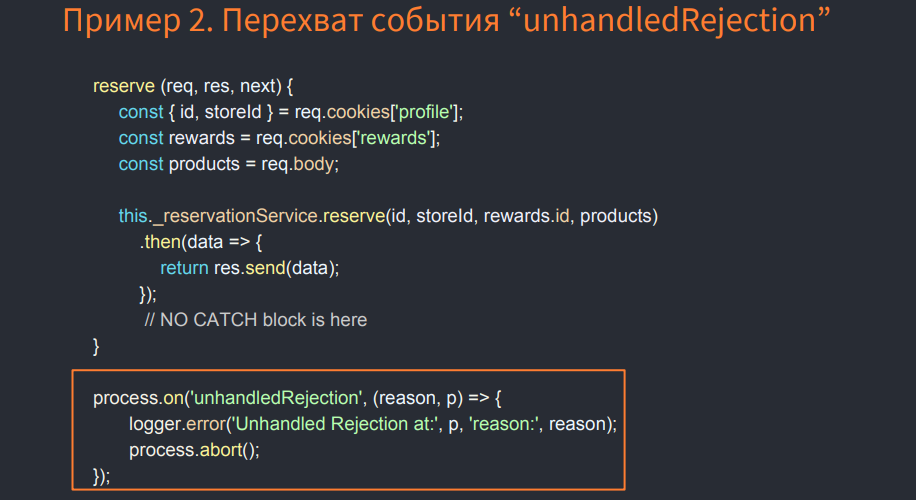
The same example with the reserve method, but the error already falls deep in the service, which operates in asynchronous mode. In order to catch it, let's subscribe to the events of the unhadledRejection process, where we do process.abort () to create a core dump.
Below is what the backtrace looks like in this case.
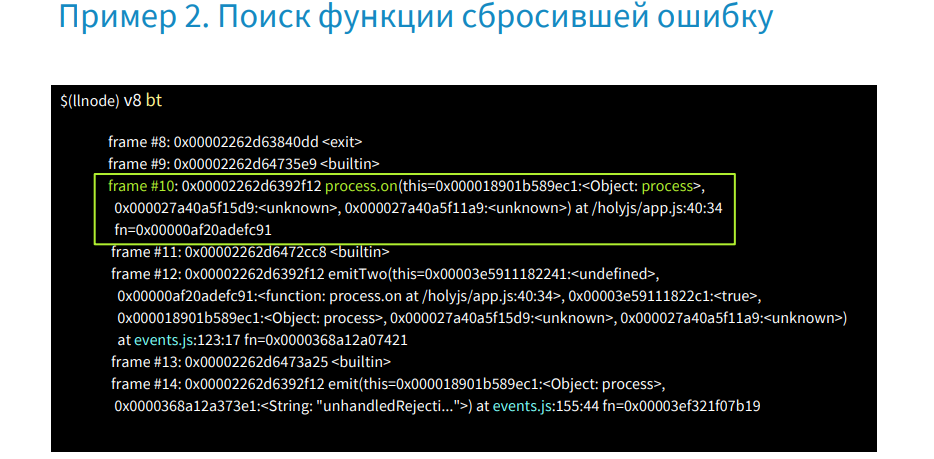
There is no information about ProductController, about reserve. There is a process.on call in this frame and nothing more useful. Such cases happen in production when the error was not intercepted and there is no information in Stack Trace. Next, I will show how, by working only with a managed heap without Stack Trace, to find all the objects.
We can get all instances of an object by type IncomingMessage. This will be a large list of all requests that have been submitted, but we need to find the one that caused the process to fail.
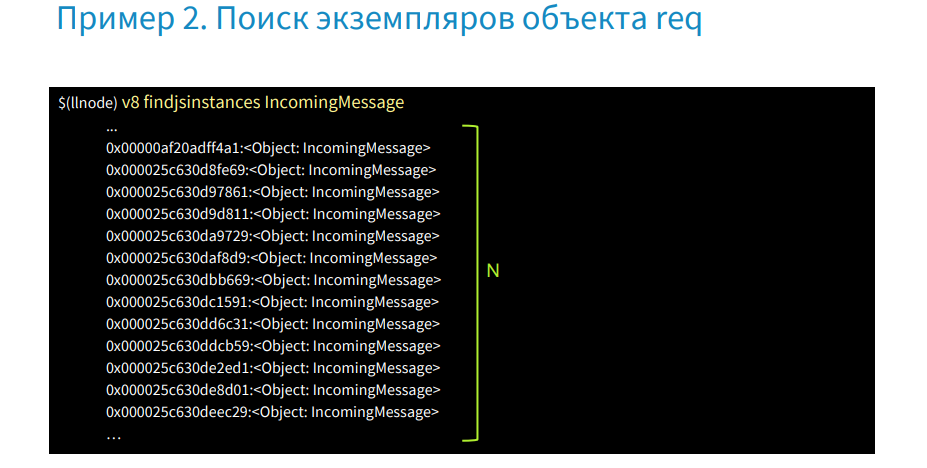
In this case, we will need logs and we need to get the id request in them - this is the X-Transaction-ID.
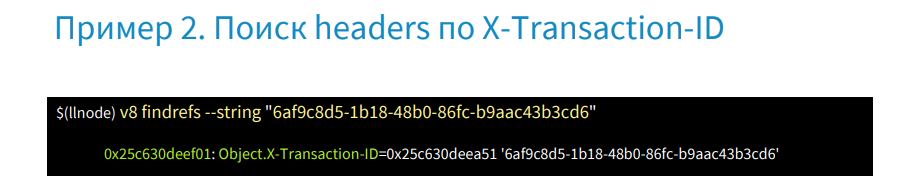
In llnode there is a possibility in memory by the value of a string to find links that refer to it. If we write the v8 findrefs --string [string value] command, we will find an object that has the X-Transaction-ID property, and it refers to this string. Find out what kind of object.
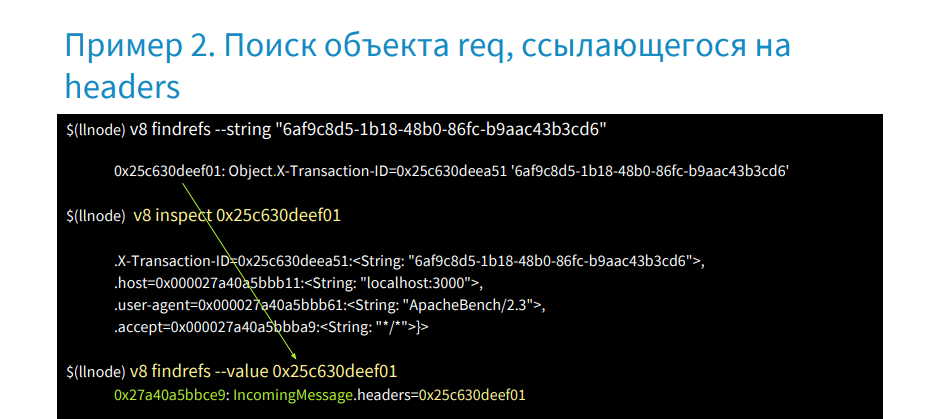
We write the command v8 inspect [address], after which we get the headers object. Further we learn that refers to this object, and we receive object IncommingMessage. Thus, without having Stack Trace and addresses, we were able to restore the user session.
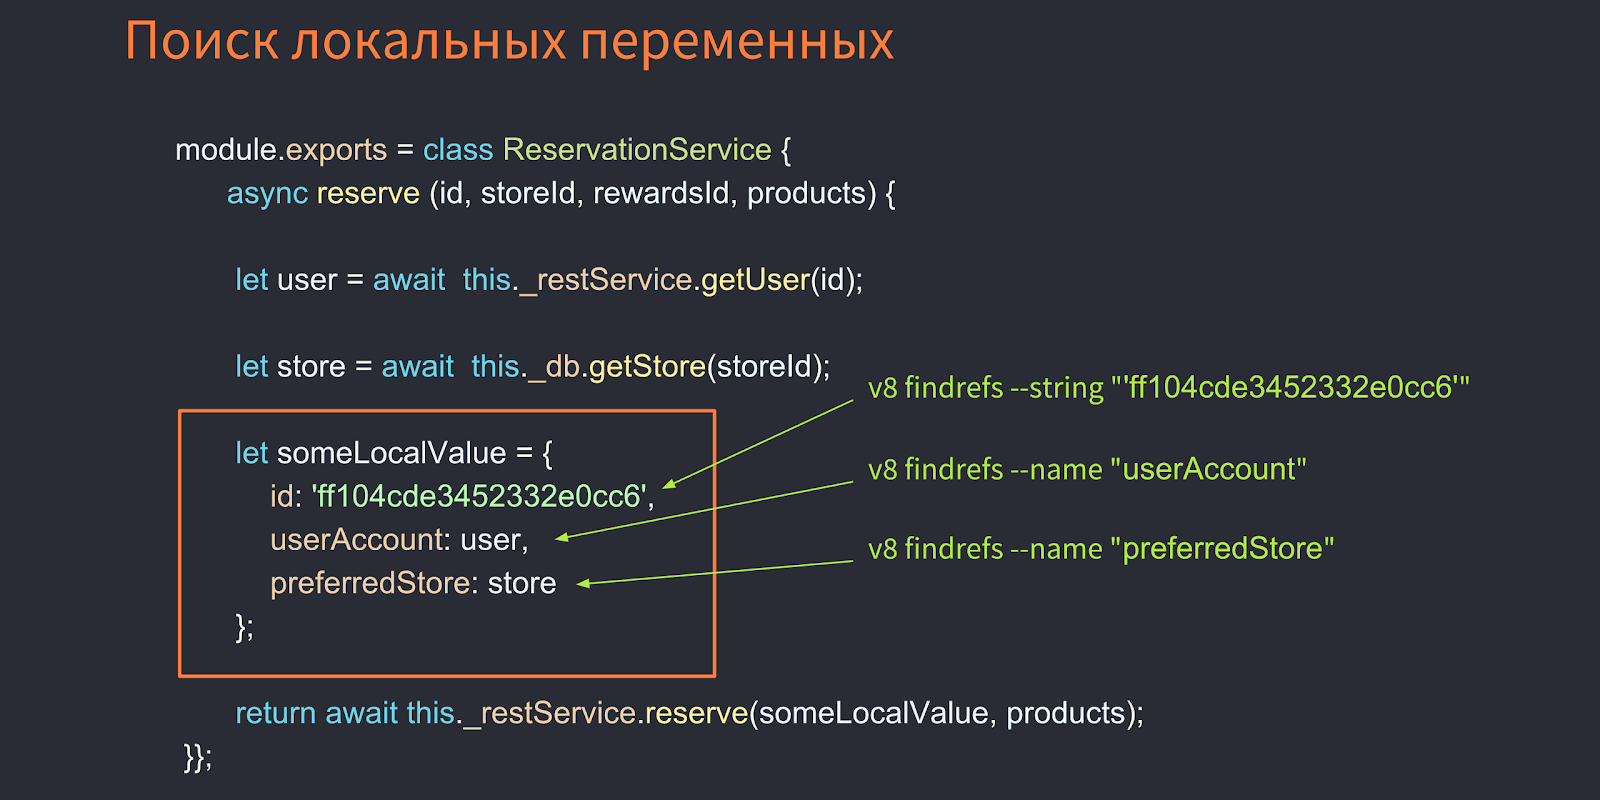
Let's dive into a more complex example when you need to get local variables - they are in services. Suppose that the error has fallen somewhere deep and the data received are few. In this case, the REST API is used. Objects are taken from the database, and all of them are assigned to some local variable called someLocalValue. And we don't have an object that refers to someLocalValue. How, then, to get a local variable from memory? You can find this object, for example, by the value of id, if you received it from the logs, but you can also get objects from the memory by the name of its properties, i.e. With the v8 findrefs name command, we can find objects that have a userAccount property, preferredStore, and in this way we will get the local variables we need!
So, we will undertake a real case - errors in production.
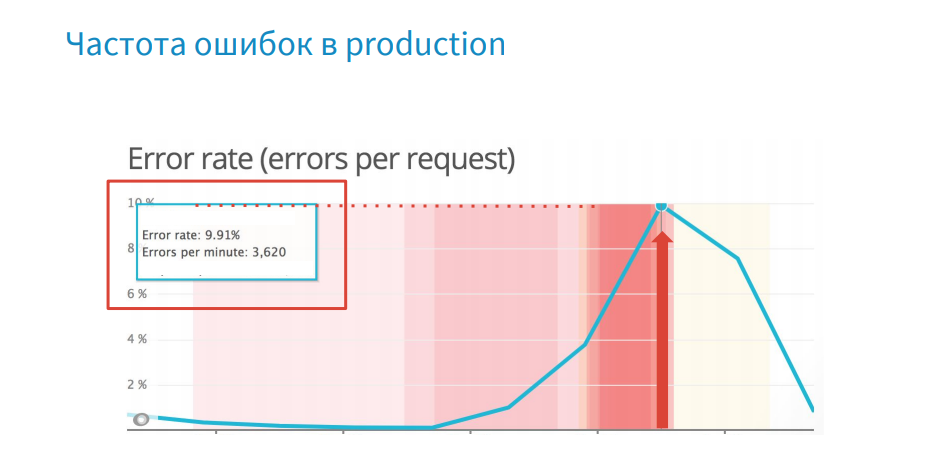
For every error we create a core dump. But what is wrong here? There are a lot of errors - 3620 per minute, and the core dump weighs 1.3 GB, and the time it takes to create and merge it onto the system is about 15-20 seconds. There is clearly not enough logic to select the creation of core dump.
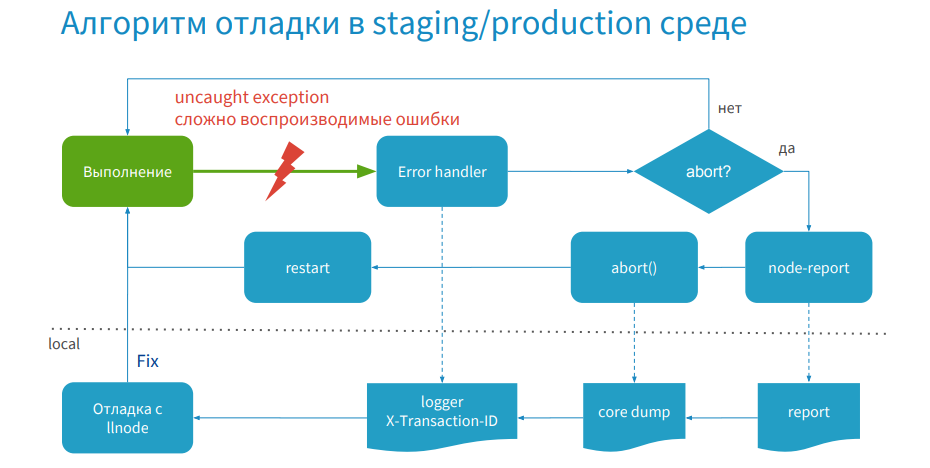
For example, your application is running and an error occurs, or you catch an error that is difficult for you to reproduce. Then the process goes to ErrorHandler, where you have logic - is it necessary to do process.abort for this error in order to create a core dump, or we continue the execution of the program.
If the error is unique and needs to be processed, a report is created using node-report, then process.abort is called and a core dump is created, and the process is restarted. Your server works again, serves the traffic, and later you get access to the report, core dump and logs, then debug with the help of the debugger, make a hotfix and publish.
The image below shows an example of logic that makes selection. I call it the registry of errors. It restricts the creation of core dump.
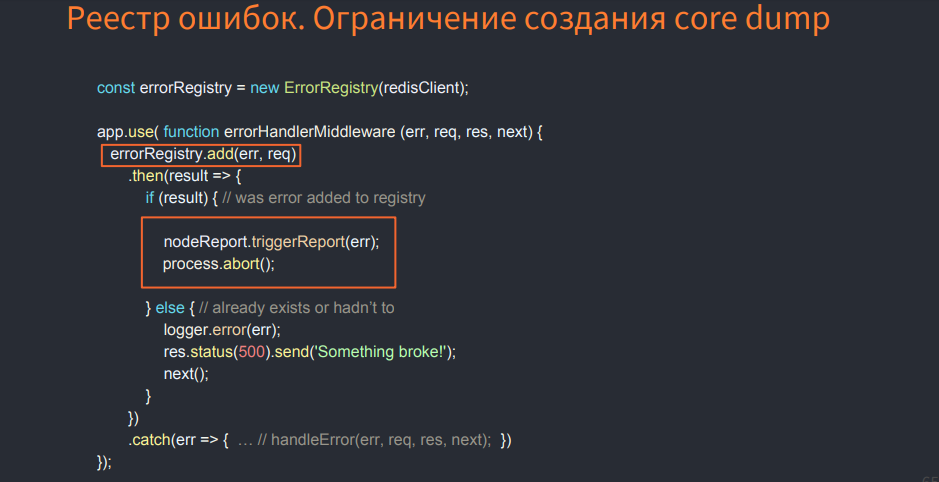
This is some class that uses In-Memory Databases, and when you find an error, check if it is registered in the registry or not. If not, see if you need to register it. If yes, then reset the process, create a core dump. In this case, you will not create a core dump for errors that repeat. You will select them. This will speed up the debugging process.
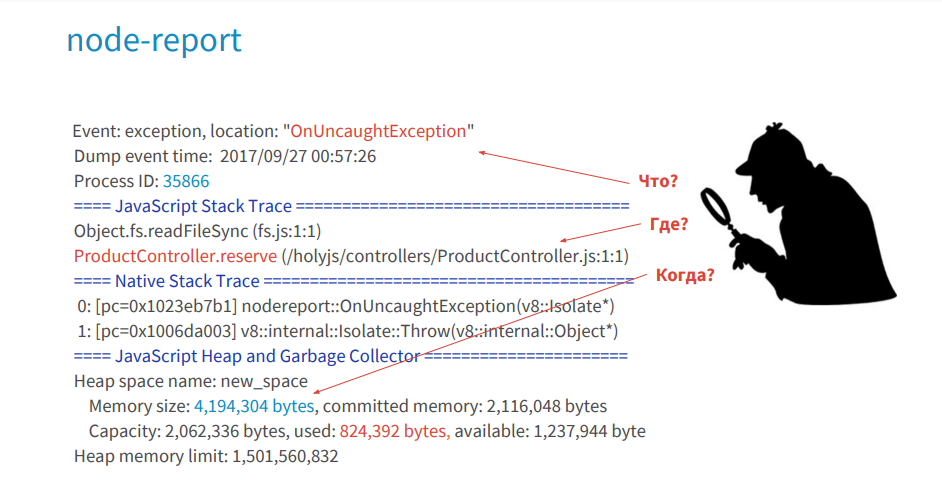
I believe that the debugging process in production is a kind of detective investigation, where a node-report will tell you what happened, where and under what circumstances a crime was committed against your JS Stack Trace process. Logs will give you clues, evidence, valuable information. The debugger will allow you to find objects that took place at the time of the crime, that is, in these functions.
This is how we work in production and debug errors.
Let's look for a memory leak.
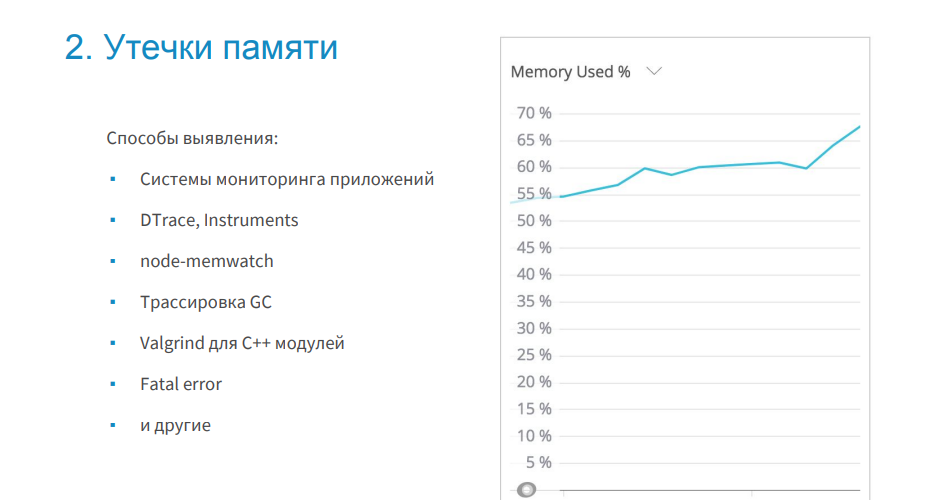
There are many ways to detect memory leaks (some are mentioned in the image above).
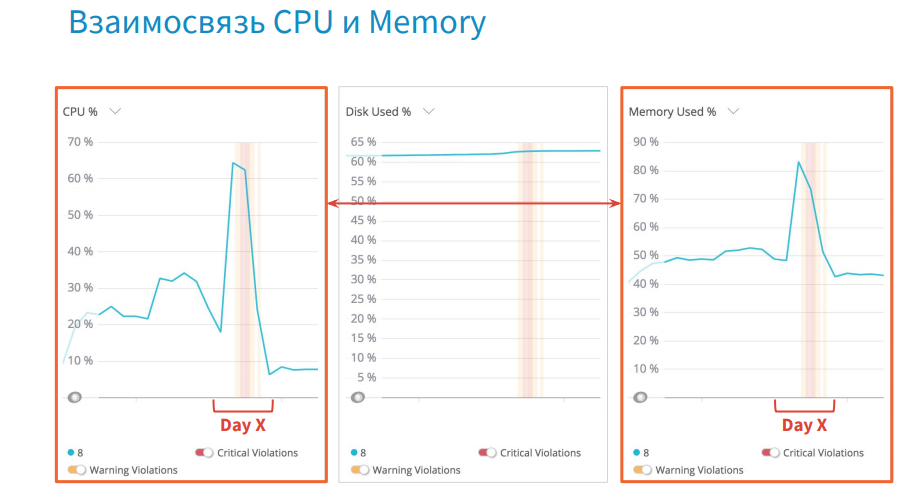
For example, in the graphs of CPU and memory load, you can notice a certain correlation. And in situations where you have a memory leak, the garbage collector is loaded, which takes up more CPU time.
Consider an example of a leak.
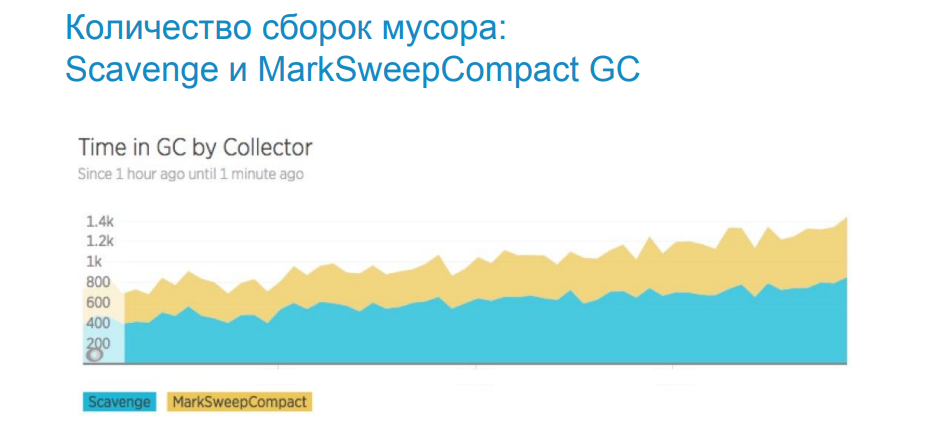
The image above shows the work schedule of the garbage collector. Scavenge - works in the space of young objects. MarkSweep - in the space of old objects. The graph shows that the number of garbage collections is growing, which means that the memory is leaking and more frequent garbage collection is needed. To understand where and in which space it is leaking, we use the tracing of the garbage collector.
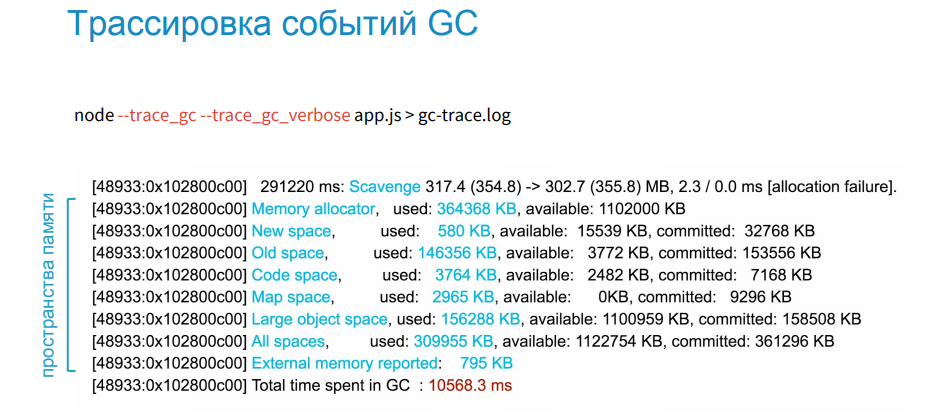
In the image above, a list of memory areas is visible, which displays their states at each iteration of the garbage collection. There is old space, new space and others. When we got the source code from the core dump, we took it from the code space.
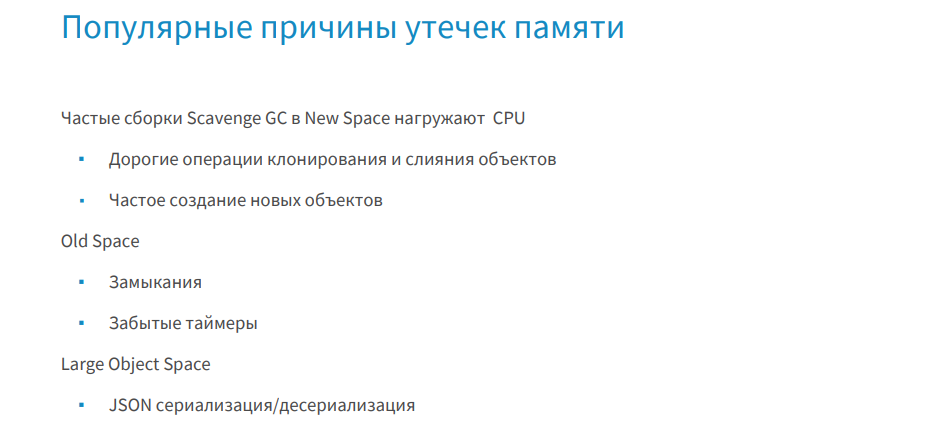
From experience, I can say that if memory leaks in the space of new objects, then expensive cloning operations, merge, and so on are to blame for this. If the memory is flowing in a large space of old objects, then these are the missing circuits, timers. And if the memory leaks in large space, where the garbage collector does not work, then this is serialization / deserialization of large JSON.
The image below shows an example of Scavenge tracing, which works in the field of young objects. There is no memory leak.
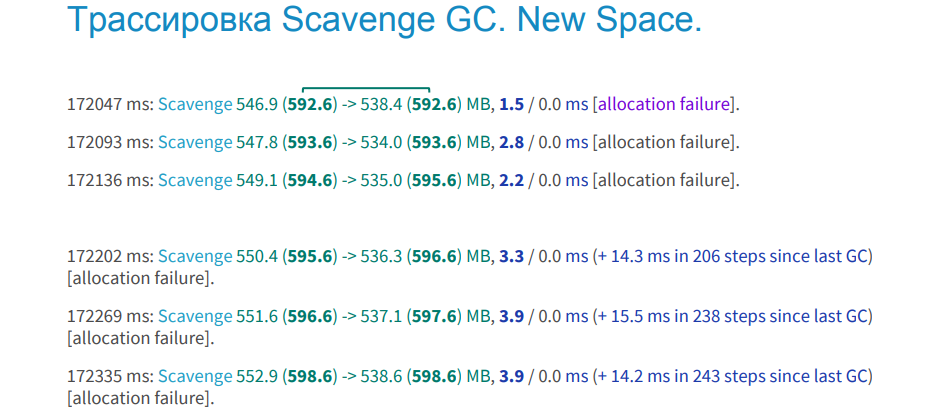
How can you find out? We have two bars in bold green text. This memory, which was allocated to your process before assembly and after assembly. Values are equal, and this suggests that the allocated memory did not increase after garbage collection. The blue font indicates the time spent on garbage collection. The documentation states that this requires 1 millisecond by default. In our project it is about 3 seconds, and we consider this the norm. In the upper image below you can see three lines, this is also a garbage collection, but already iterative, that is, you have not all memory scanned and cleared, but in pieces. It also shows the number of iterations.
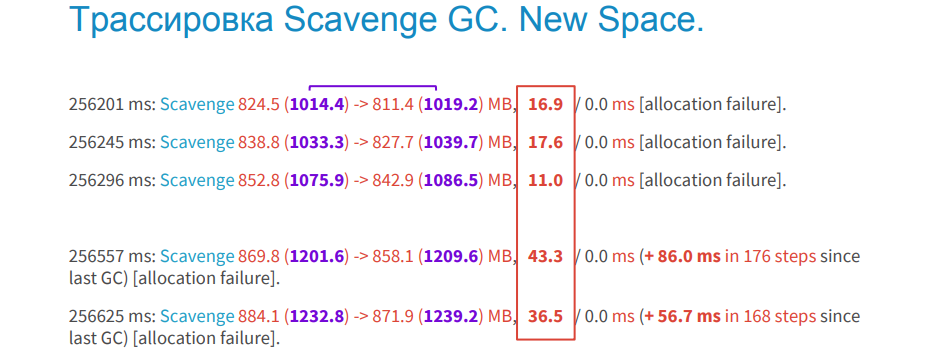
The image below shows an example of a memory leak in the same space. In the purple columns, it is clear that the amount of memory occupied increases, that is, after garbage collection, it increases every time.
How are things in the space of old objects?
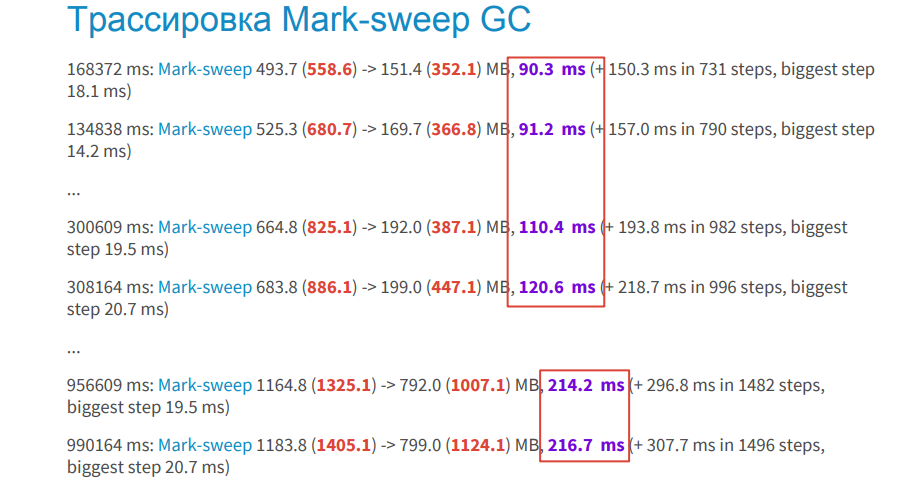
Here we see that the process takes longer: 90ms, 110ms, etc. This is a lot. Moreover, it is executed still iteratively, which also takes time in the background thread.
Under the hood, Node.js has several threads. One for profiling, several for garbage collection, and a thread for executing the application itself.
Consider the example below to figure out how to detect memory leaks.
Notice that the Middleware, which processes the request, records the start time of the execution at the beginning, and when the request has ended, it records the time after the execution, where some function for its processing is called — someProcessOperation. In this function, we pass the request. There is a closure here. The request object is retained after it is sent. And there may be other links to it, which draws many objects. What to do in this case? We do not need the entire request object. We can transfer only its id and url. This way we avoid memory leaks.
How can you find out?
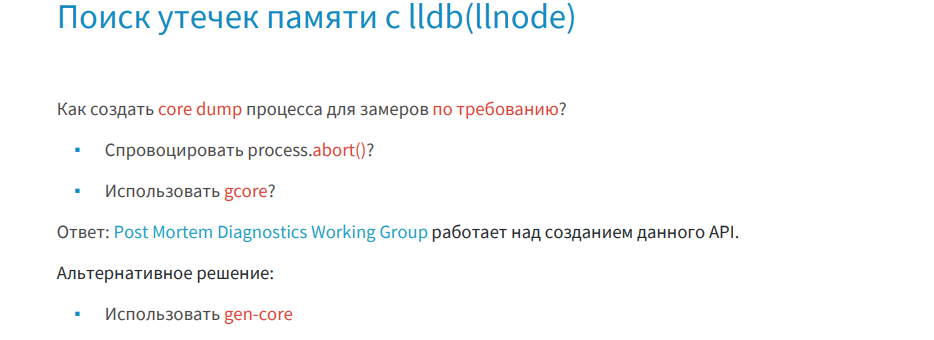
I'll show you how we do it with the llnode debugger (in the case of Fatall Error, when after the crash of the application due to lack of memory, Node.js will create coredump). In the previous case, we received a core dump, when we had an exception and the process ended. This time, of course, we did not call process.abort () on a running application to get a core dump, but armed with the gcore tool, which allows you to query the process id at the infrastructure level and get a core dump on demand. However, here we are faced with an infrastructural constraint, which is why we had to look for other options.
A month ago, a library called gen-core was published. This tool allows you to fork your process, kill it without harming your main process, and get a core dump.
The image below shows an example of gen-core operation.
Here, the DiagnosticController by REST API can make a core dump.
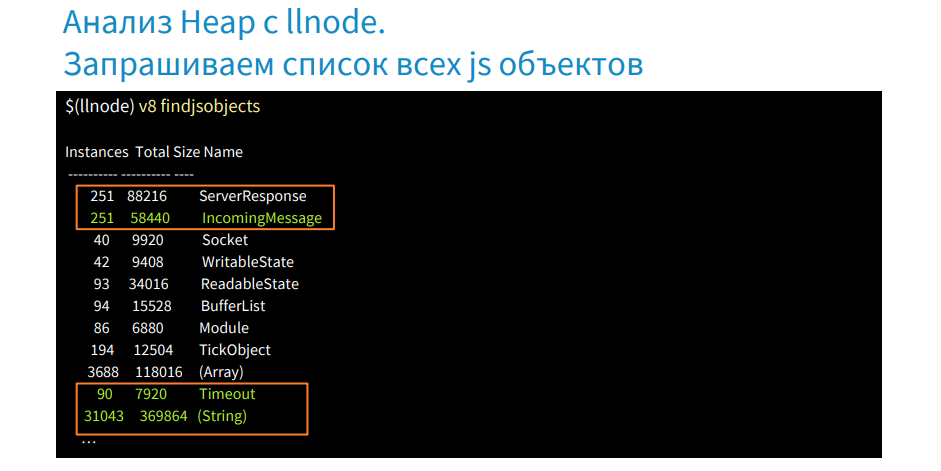
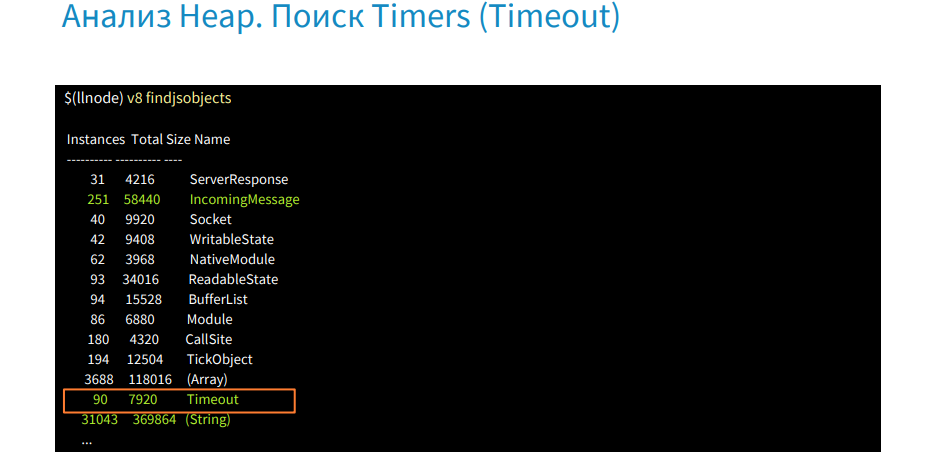
We have the findjsobjects command, with which we can scan the entire heap and group them by type, get a report on the number of instances of each type of object, their size in memory, etc. The image above shows that there are a lot of ServerResponse and IncomingMessage instances, there are also Timeout and String objects. The strings themselves are very large and take up a lot of memory. Often they are in the large space where the garbage collector does not work.
Let's find out why we have a lot of request objects. Remember that the request object was held in Middleware.
There is a command findjsinstances [type], and with its help we get a list of request objects.
We take the address of the first object and with the help of the v8 command findrefs -v we look for an object in memory that has a link to it.
These are two objects. The first is an array of 18 elements, and the second is the request object. We find out what this array is and why it holds our request objects.
Use the v8 command findrefs -v [address of this array] and find that this array is in an object of type Profiller and the property processingQueue. In this way, we were able to find out where our request objects hold in memory. Next we go to the source code or get it from there and see where the processingQueue is called.
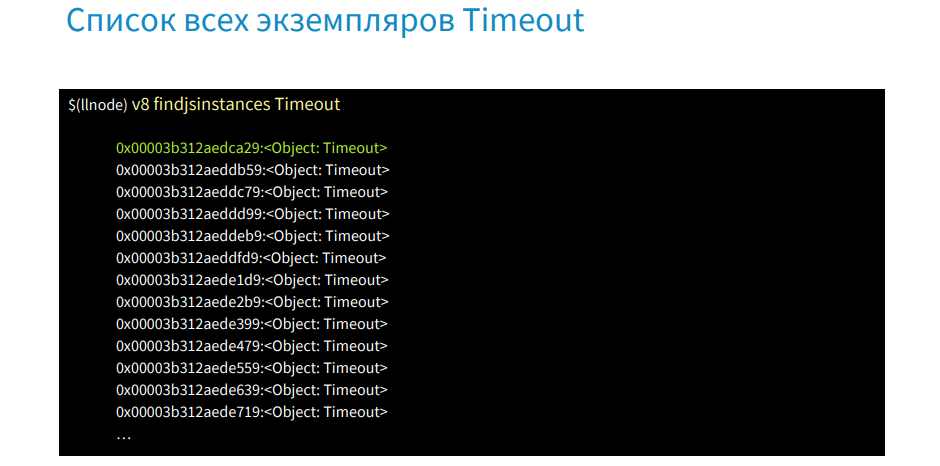
We use the command findjsinstances [type Timeout], get a list of all timeouts and then we will look for where they are used.
With the help of the command v8 i we get the first timeout.
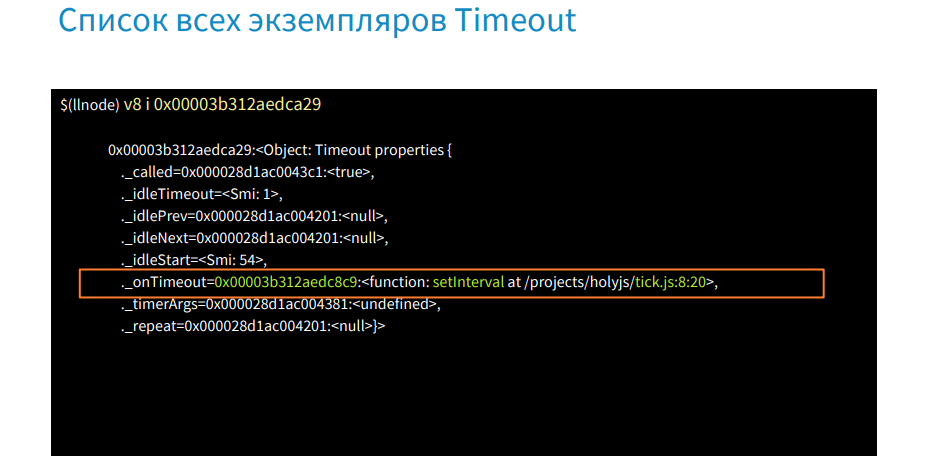
In the onTimeout property, we can see that the setInterval function is called and the address where the file is located. In this way, we quickly learned where the forgotten timer is and why it is executed.
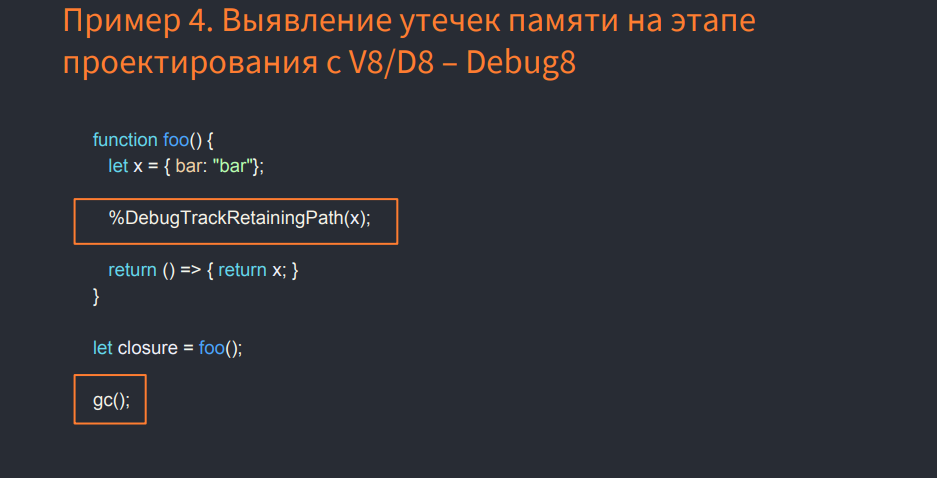
If you use the% DebugTrackRetainingPath (x) command, which was added recently to V8 (Node.js does not yet have its support), download the V8 sources, compile and use the V8 debugger, and run the above in the JS image, we will get any links variable to the root object. Do not forget to call the garbage collector. In the example, this is a call to gc ().
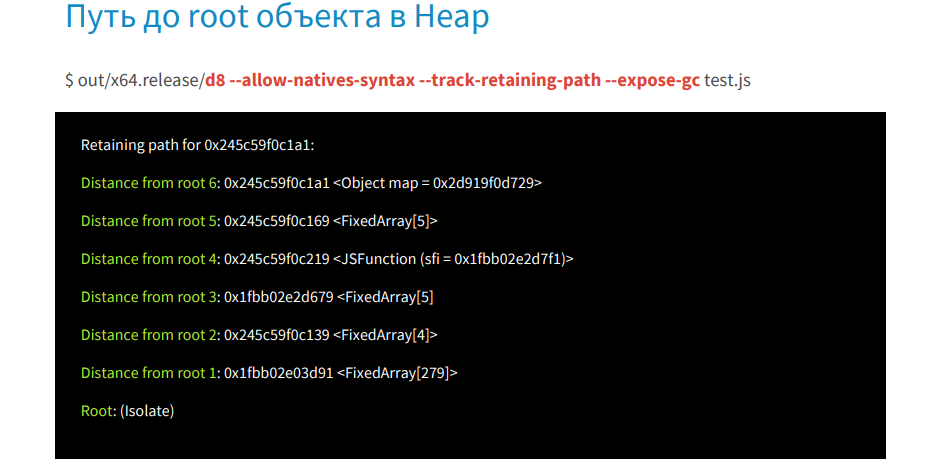
We run debug8 with the --allow-natives-syntax, --track-retaining-path, --expose-gc flags and the test.js file. In the listing, we get step by step who and what holds the object up to root.
Thus, we disassembled the search for memory leaks in production.
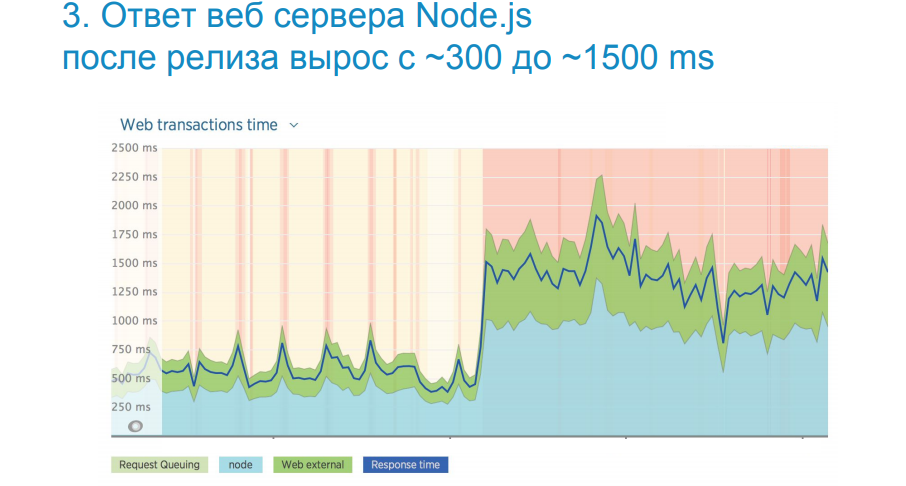
In the image above, you see a real-life example, when, after the next release, we lost five times the performance. The upload time of the Web UI application has increased dramatically.
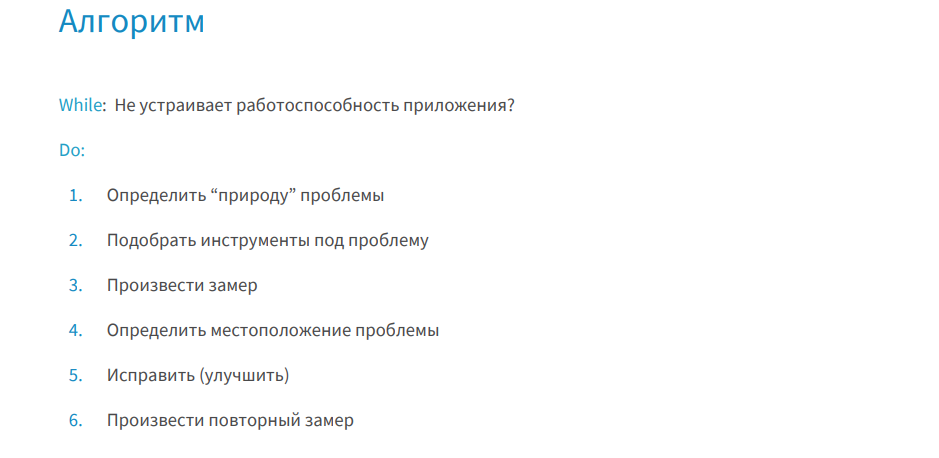
For such cases there is a simple and effective algorithm of actions, which is demonstrated below.
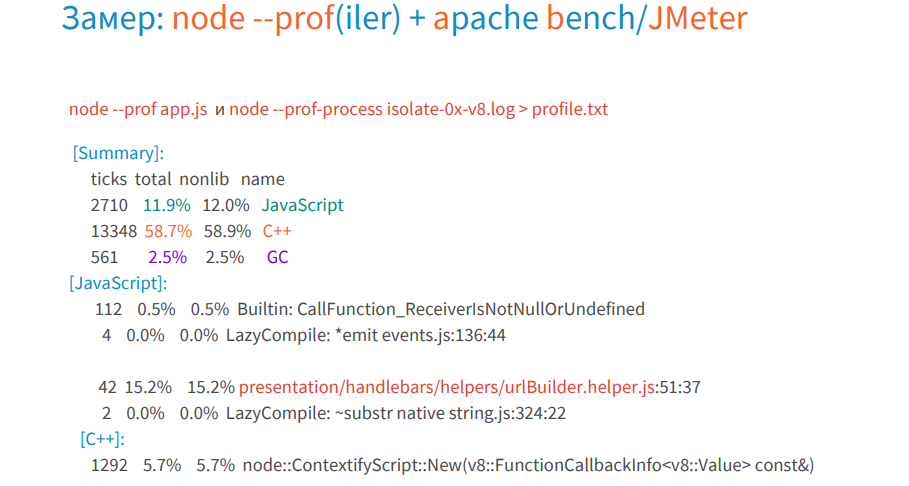
Although a profiler was added to Node.js in 2013, the tick-processor (a tool that processes V8 logs and reports) appeared only last year. Before that, we used either the V8 profiler, which had a tick-processor in it, or we had to download the V8 itself, build it, and activate the processor there in the tools.
The profiler gives you information at a high level, he will help determine the nature of the problem and see which functions have been performed the longest.
There is a convenient presentation of this log data in graphical form, and it is called flame graph. Designed it in 2013 by Brendan Gregg.
Who remembers, in 2015 the receipt of the graph was a real headache, but now it is created by one team using 0x.
Now let's figure out how to work with him.
To select the profile of our application, remove all unnecessary with the bottom buttons. As a result, we see that the work of the application takes only a small part of the total execution time.
The stack trace of the function call sequence is finite and fits on the screen. What then takes a long time? If we turn on the highlight of the work of npm packages, we will see that they run nine times longer than the application itself. This is a lot.
If we highlight the optimized functions, we will see that there are very few of them. About 90% of calls were not optimized.
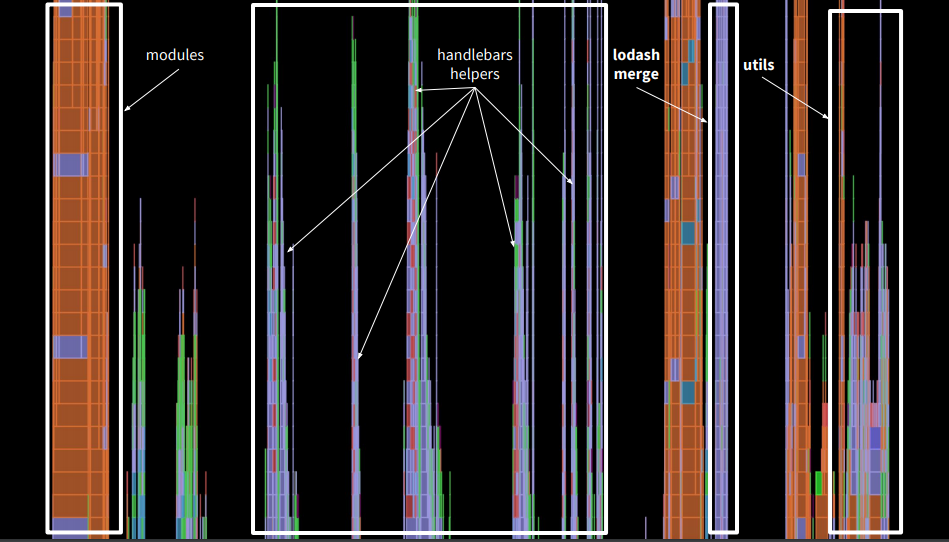
If we look at the tops of the calls, we will see that in our application a lot of the stack was in the handlebars, in addition we had lodash merge, which did merge objects, we had third-party utilities, which also took time.
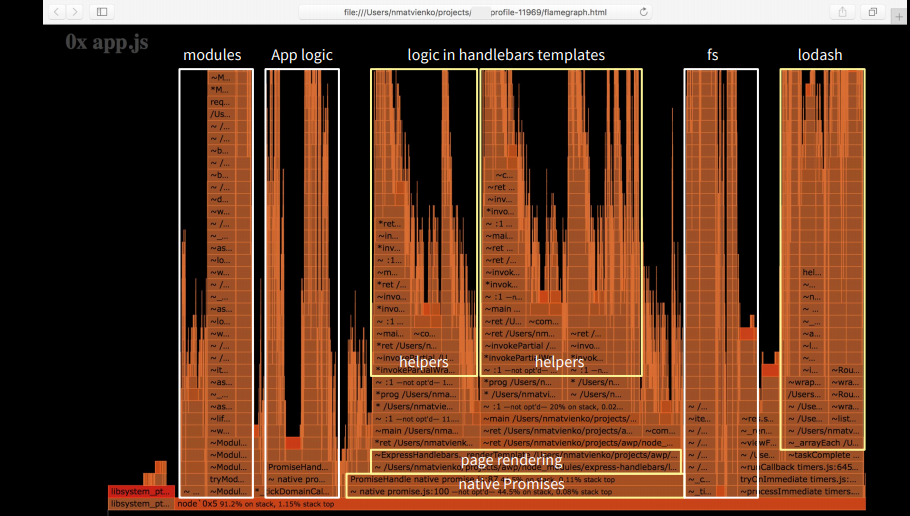
If we analyze the same graph of our application, we will see that the foundation is based on native promis, which took a long time to complete before Turbofan. But most of all, it takes page rendering. Our application as a percentage is one-tenth of all logic.
What have we fixed?
Below is a graph that we see after the corrections.

Here you should pay attention to the right side, where the handlebars helpers. Previously, the view view took up more than half of the graph, and now it is one tenth. We optimized everything fairly well, and now the work of the application itself takes about half of the total time. This does not mean that it began to work longer - all other processes began to work less in time.
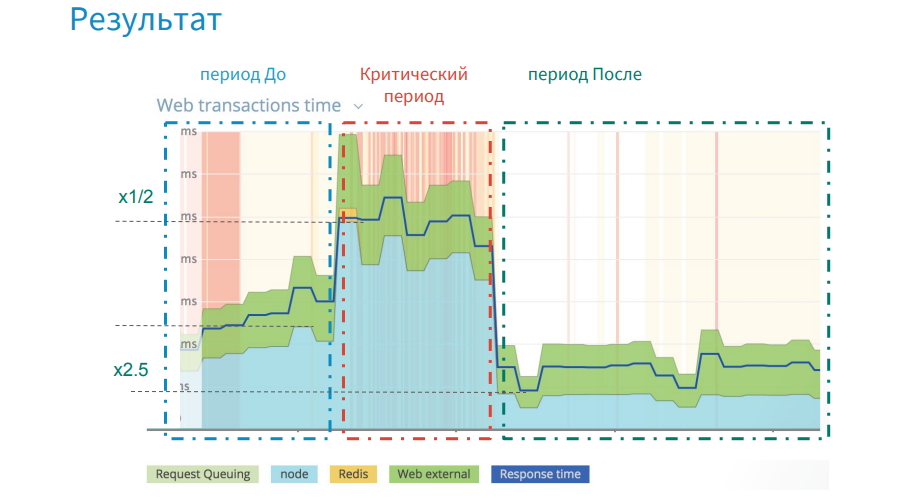
The image above shows that at the stage before the release of the critical release, the graph grew, and we gradually lost in productivity. Then there was a sharp jump. In the critical period, we were 3.5 weeks and searched for shortcomings, made changes.
The essence of the problem was that the error (parsing JSON lines) was laid in the application long before this release, and only fired at a certain moment. In the end, after all the fixes and optimizations, we won in performance twice, if we take the initial level as a starting point.
Resources used in the report
We hope you find the experience of Nikolai useful. By the way, this Saturday HolyJS 2018 Piter starts , where Nikolay will tell about the decomposition of the Main Thread in Node.js to increase throughput . And if you like the wrong side of JS, you might also be interested in the following reports:
The material is based on the interpretation of the report by Nikolai Matvienko from Grid Dynamics from our December conference HolyJS 2017 Moscow.
To understand at what stage of the evolution of diagnostic tools we are now, I propose to turn to history. On the timeline, I depicted the most significant moments.
')
First, such tools as DTrace, Instruments, perf were published - these are system profilers that appeared long before Node.js, and they are still used today. With the advent of Node.js, Node-oriented tools come to us - here we should highlight node inspector, node-heapdump, node-memwatch. I marked this period gray and conditionally call it a troubled time. You remember that there was a split in the community: at that time, io.js separated from Node.js, and the community did not have a common understanding of where to go and whom to choose. But in 2015, io.js and Node.js merged, and we saw Node.js v4 Argon. The community has a clear development vector, and Node.js in production began to use such large companies as Amazon, Netflix, Alibaba.
And here, effective tools that are ready to work in production become popular.
Since 2017, I conditionally single out the third stage.
From this point on, Node.js has been developing qualitatively. It is worth noting the full transition to Turbofan and the development of Async Hooks.
In 2015, we launched the release on the Node.js 0.12 version and gradually updated first to the fourth version and subsequently to the sixth one. Now we are planning to move to the eighth version.
In the release year, we used tools from the first stage, which were low-functional for work in production. We have a good experience with the tools of the second stage, and now we use the tools of the third stage. But with the transition to new versions of Node.js, we are faced with the fact that we are losing the support of useful tools. In fact, we had a choice. Either we are switching to a new version of Node.js, which is more optimized and faster than the previous one, but we do not have the tools, and we cannot diagnose it. Either we stay on the old version of Node.js, which is slower, but we have the tools for it, and we know its weak points. Or there is a third option, when new tools appear, and they support, for example, Node v4 and higher, and the previous ones do not.
Our application is a large e-commerce project where Node.js applications (these are Web UI backend and Node.js microservices) occupy a central place in the enterprise architecture.
The problem in this place can come from any side. In the days of high loads, such as Black Friday, when a company earns 60% of its annual profit over several days, it is especially important to maintain high throughput. If some kind of malfunction happens, a local consultation is held, where all the heads of the systems are present, including me from Node.js. If the problem is on the side of Node.js, you need to quickly select a strategy, pick up the tools for it and fix the problem, because the company is losing thousands of dollars a minute.
Below, I would like to use concrete examples to show how we in production act in cases of errors, memory leaks and a drop in performance.
Debugging Production Applications
There are several prompts for debugging in production.
Consider a simple example: a service for backing up products. The controller uses service, which sends a collection of products to the REST API, returns data, and an error is thrown to the controller.
In the picture you see the listing of ProductController. In the reserve method we get the profile from cookies, also take a rewards account where bonus points, id and other useful information are stored, also from cookies. And this cookie is missing - undefined. In the case when id is taken from rewards, the error falls. Locally, we would set a breakpoint (red dot), get the status of all objects and find out the reason why the code falls.
I'll show you how it works under the hood so that you understand what a stack track is. If you write the% DebugTrace () command, the native V8 command, and run Node.js with the --allow-natives-syntax option, that is, enable the native syntax in V8, you will get a big message from Stack Trace.
At the very top in the second frame we will have the reserve function before the controller method, and we will see there a link to the ProductController context - this, the request, response parameters, we will get local variables, some of which are stored on the stack, and the other in Heap (managed heap ). We also have the source code, and it would be nice to have something similar in production when debugging to get the state of the objects.
This support was implemented in 2015 from version 0.12. If we run Node with the --abort-on-uncaught-exception flag, a core dump will be created - this is the memory snapshot of the whole process, which contains the Stack Trace and Heap Dump.
For those who have forgotten, I remind you: the memory conditionally consists of Call Stack and Heap.
In Call Stack, yellow bricks are frames. They contain functions, and the function contains input parameters, local variables, and a return address. And all objects except small integer (SMI) are stored in a managed heap, for which there are addresses.
We figured out what the core dump consists of, now let's move on to the process of its creation.
Everything is simple: the process of your application is executed, an error occurs, the process crashes, a core dump is created, then the application is restarted. Then you connect to production remotely or pull this core dump to your local computer, debug it, make a hot-fix and publish it. Now that we understand what this process looks like, we need to know which debuggers can be used.
They all appeared before the Node.js. In order to read the JS Stack Trace, several plug-ins have been written to them at different times. Most of them are already outdated and not supported by the latest version of Node.js. I tried almost everything and in this report I want to highlight llnode. It is cross-platform (except for Windows), it works with the latest versions of Node.js, starting with the fourth. I will show how you can use this debugger to debug errors in production.
Consider the example described above - product reservations.
Set up the environment, set the possibility of creating a core dump, and launch our Node application with the --abort-on-uncaught-flag flag. Next, we get the process pid, we make a request to the user who does not have cookies reward, and we receive a message that the error appeared in the ProductController in the reserve method.
Next, we get the message that the core dump was created - a memory cast. Having received a core dump or access to it, we check its availability - it weighs 1.3 GB. A lot.
Run this core dump with a debugger using the llnode command, we can get the Stack Trace using the bt command.
The image shows (above and below - in more detail) that there is no information in frames 4 through 20.
The fact is that this is JS Stack Trace, which C ++ debuggers cannot read. In order to read it, just use the plugin.
By running the V8 bt command, we get the JS Stack Trace, where in the sixth frame we will see the reserve function. In the frame there is a link to the context of this ProductController, parameters: IncomingMessage - Request, ServerResponse and blue is the address of the function in memory. At this address, we can get its source code from core dump.
Next, we write the command v8 inspect --print-source [address] and get the source code of our function from memory.
Let's go back to the Stack Trace, there were the request and response parameters, and find out what was in the request.
In the image we see the v8 inspect command with the address. After it is executed, we get the status of the request object. Here we are interested in the cookies property, url, POST method and body. Find out what products were transferred to the server.
Let's write the command v8 inspect [address of the body].
We get an object in which the array consists of three elements in the products property. We take its address, we inspect and we receive an array from id.
There is no problem here. Let's see what was in the req.cookies object.
This is an object of two properties: profile and rewards - undefined. Find out which user has no rewards account.
Let's write the v8 inspect command [profile address] and get its id and storeid. Thus, we managed to get the source code in production without source code and restore the user session.
Here was a very convenient case, and if you use a framework that contains ErrorHandler Middleware, then unlike the previous example, where we had links from Stack Trace to the context of this, request, response, if ErrorHandler is not rewritten, then you in Stack Trace there will be the last calls of Express itself and it will not work with anything. You will not have links.
I will give an example of how this happens.
The same example with the reserve method, but the error already falls deep in the service, which operates in asynchronous mode. In order to catch it, let's subscribe to the events of the unhadledRejection process, where we do process.abort () to create a core dump.
Below is what the backtrace looks like in this case.
There is no information about ProductController, about reserve. There is a process.on call in this frame and nothing more useful. Such cases happen in production when the error was not intercepted and there is no information in Stack Trace. Next, I will show how, by working only with a managed heap without Stack Trace, to find all the objects.
We can get all instances of an object by type IncomingMessage. This will be a large list of all requests that have been submitted, but we need to find the one that caused the process to fail.
In this case, we will need logs and we need to get the id request in them - this is the X-Transaction-ID.
In llnode there is a possibility in memory by the value of a string to find links that refer to it. If we write the v8 findrefs --string [string value] command, we will find an object that has the X-Transaction-ID property, and it refers to this string. Find out what kind of object.
We write the command v8 inspect [address], after which we get the headers object. Further we learn that refers to this object, and we receive object IncommingMessage. Thus, without having Stack Trace and addresses, we were able to restore the user session.
Let's dive into a more complex example when you need to get local variables - they are in services. Suppose that the error has fallen somewhere deep and the data received are few. In this case, the REST API is used. Objects are taken from the database, and all of them are assigned to some local variable called someLocalValue. And we don't have an object that refers to someLocalValue. How, then, to get a local variable from memory? You can find this object, for example, by the value of id, if you received it from the logs, but you can also get objects from the memory by the name of its properties, i.e. With the v8 findrefs name command, we can find objects that have a userAccount property, preferredStore, and in this way we will get the local variables we need!
So, we will undertake a real case - errors in production.
For every error we create a core dump. But what is wrong here? There are a lot of errors - 3620 per minute, and the core dump weighs 1.3 GB, and the time it takes to create and merge it onto the system is about 15-20 seconds. There is clearly not enough logic to select the creation of core dump.
For example, your application is running and an error occurs, or you catch an error that is difficult for you to reproduce. Then the process goes to ErrorHandler, where you have logic - is it necessary to do process.abort for this error in order to create a core dump, or we continue the execution of the program.
If the error is unique and needs to be processed, a report is created using node-report, then process.abort is called and a core dump is created, and the process is restarted. Your server works again, serves the traffic, and later you get access to the report, core dump and logs, then debug with the help of the debugger, make a hotfix and publish.
The image below shows an example of logic that makes selection. I call it the registry of errors. It restricts the creation of core dump.
This is some class that uses In-Memory Databases, and when you find an error, check if it is registered in the registry or not. If not, see if you need to register it. If yes, then reset the process, create a core dump. In this case, you will not create a core dump for errors that repeat. You will select them. This will speed up the debugging process.
I believe that the debugging process in production is a kind of detective investigation, where a node-report will tell you what happened, where and under what circumstances a crime was committed against your JS Stack Trace process. Logs will give you clues, evidence, valuable information. The debugger will allow you to find objects that took place at the time of the crime, that is, in these functions.
This is how we work in production and debug errors.
Memory leak detection
Let's look for a memory leak.
There are many ways to detect memory leaks (some are mentioned in the image above).
For example, in the graphs of CPU and memory load, you can notice a certain correlation. And in situations where you have a memory leak, the garbage collector is loaded, which takes up more CPU time.
Consider an example of a leak.
The image above shows the work schedule of the garbage collector. Scavenge - works in the space of young objects. MarkSweep - in the space of old objects. The graph shows that the number of garbage collections is growing, which means that the memory is leaking and more frequent garbage collection is needed. To understand where and in which space it is leaking, we use the tracing of the garbage collector.
In the image above, a list of memory areas is visible, which displays their states at each iteration of the garbage collection. There is old space, new space and others. When we got the source code from the core dump, we took it from the code space.
From experience, I can say that if memory leaks in the space of new objects, then expensive cloning operations, merge, and so on are to blame for this. If the memory is flowing in a large space of old objects, then these are the missing circuits, timers. And if the memory leaks in large space, where the garbage collector does not work, then this is serialization / deserialization of large JSON.
The image below shows an example of Scavenge tracing, which works in the field of young objects. There is no memory leak.
How can you find out? We have two bars in bold green text. This memory, which was allocated to your process before assembly and after assembly. Values are equal, and this suggests that the allocated memory did not increase after garbage collection. The blue font indicates the time spent on garbage collection. The documentation states that this requires 1 millisecond by default. In our project it is about 3 seconds, and we consider this the norm. In the upper image below you can see three lines, this is also a garbage collection, but already iterative, that is, you have not all memory scanned and cleared, but in pieces. It also shows the number of iterations.
The image below shows an example of a memory leak in the same space. In the purple columns, it is clear that the amount of memory occupied increases, that is, after garbage collection, it increases every time.
How are things in the space of old objects?
Here we see that the process takes longer: 90ms, 110ms, etc. This is a lot. Moreover, it is executed still iteratively, which also takes time in the background thread.
Under the hood, Node.js has several threads. One for profiling, several for garbage collection, and a thread for executing the application itself.
Consider the example below to figure out how to detect memory leaks.
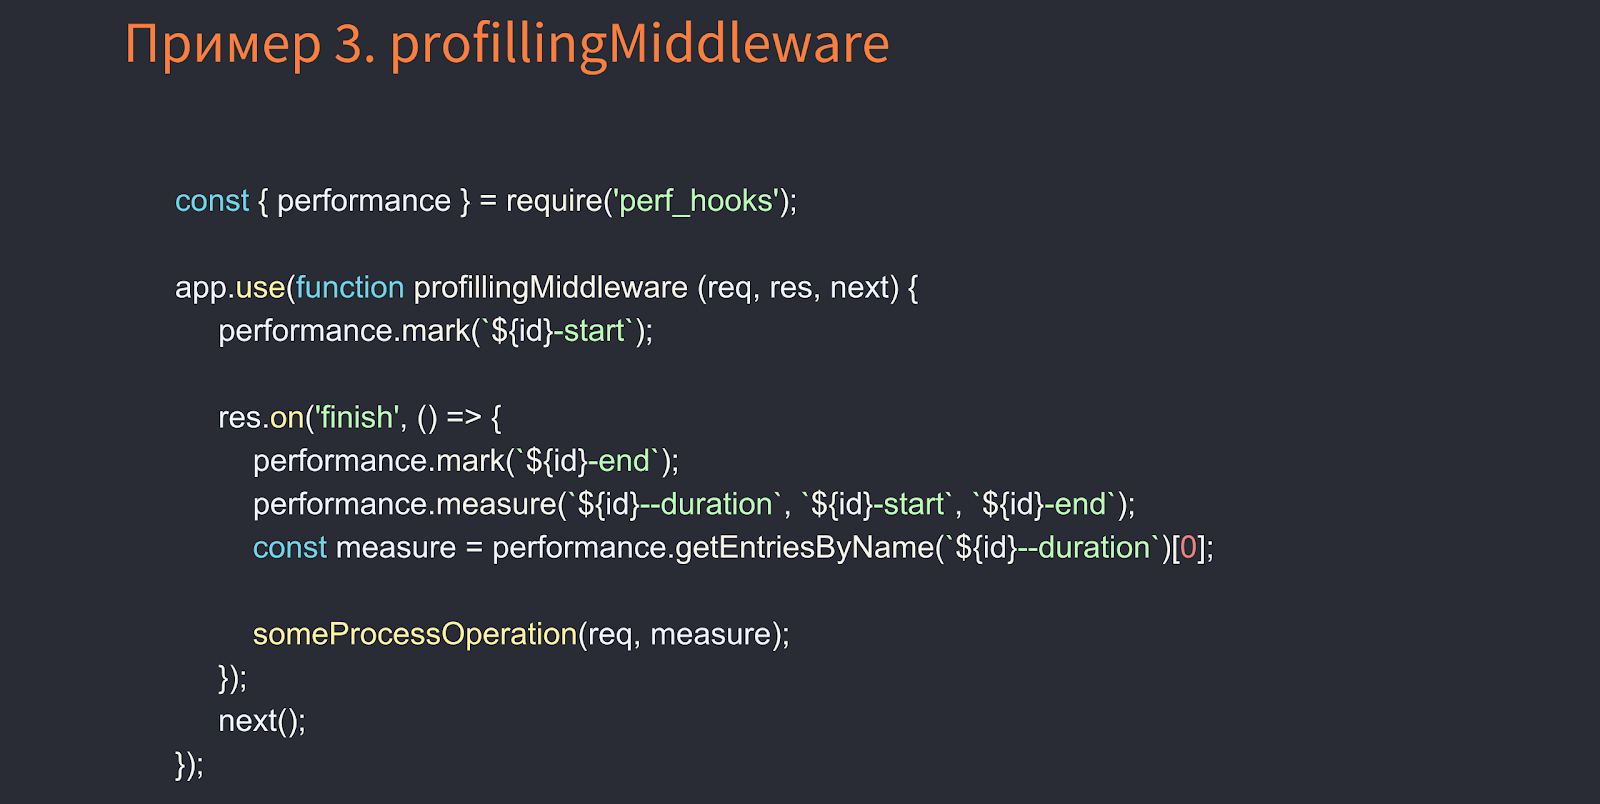
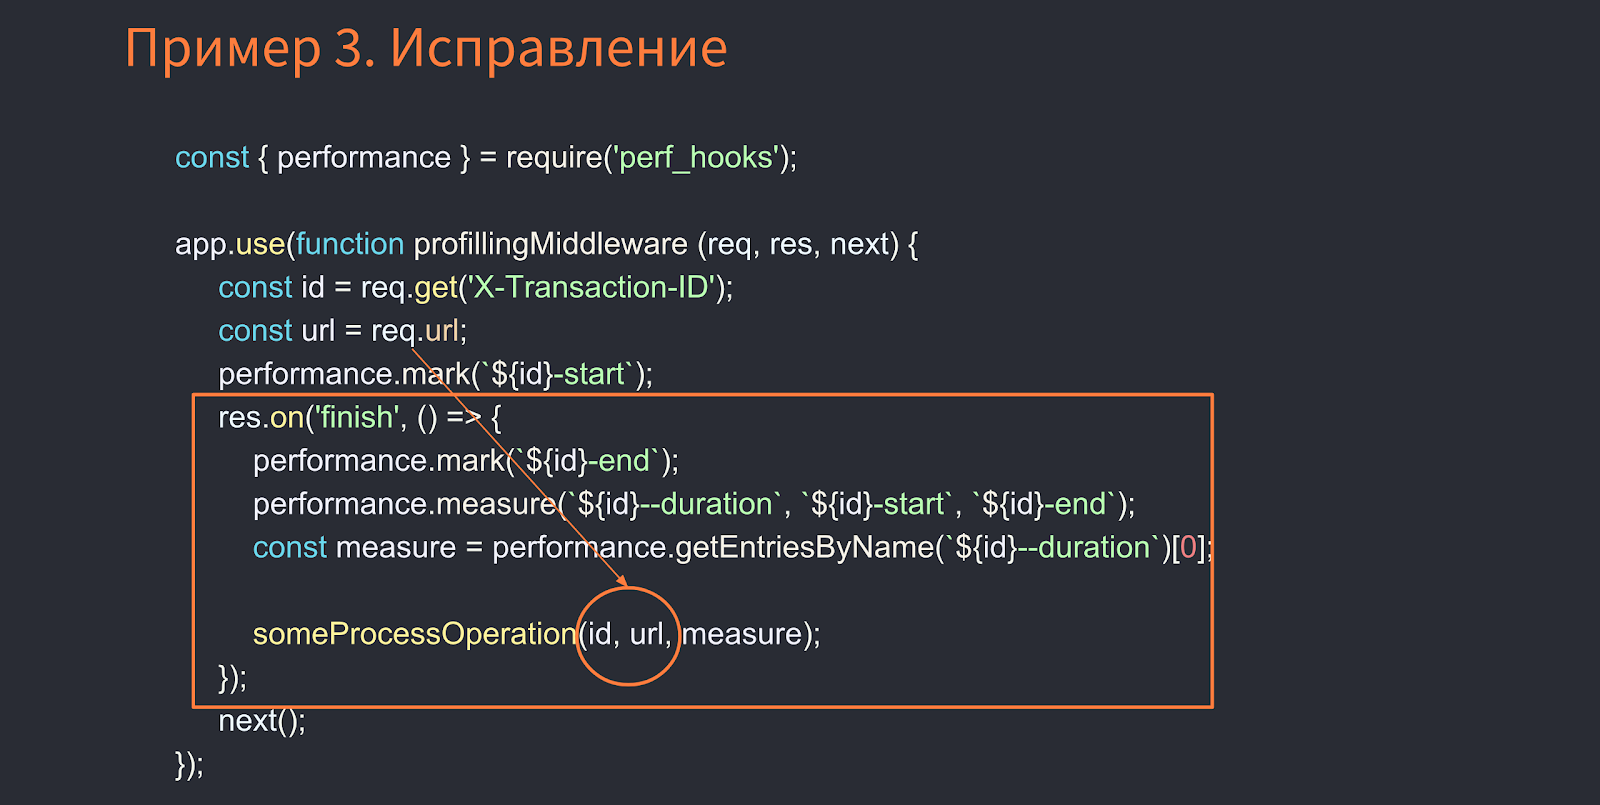
Notice that the Middleware, which processes the request, records the start time of the execution at the beginning, and when the request has ended, it records the time after the execution, where some function for its processing is called — someProcessOperation. In this function, we pass the request. There is a closure here. The request object is retained after it is sent. And there may be other links to it, which draws many objects. What to do in this case? We do not need the entire request object. We can transfer only its id and url. This way we avoid memory leaks.
How can you find out?
I'll show you how we do it with the llnode debugger (in the case of Fatall Error, when after the crash of the application due to lack of memory, Node.js will create coredump). In the previous case, we received a core dump, when we had an exception and the process ended. This time, of course, we did not call process.abort () on a running application to get a core dump, but armed with the gcore tool, which allows you to query the process id at the infrastructure level and get a core dump on demand. However, here we are faced with an infrastructural constraint, which is why we had to look for other options.
A month ago, a library called gen-core was published. This tool allows you to fork your process, kill it without harming your main process, and get a core dump.
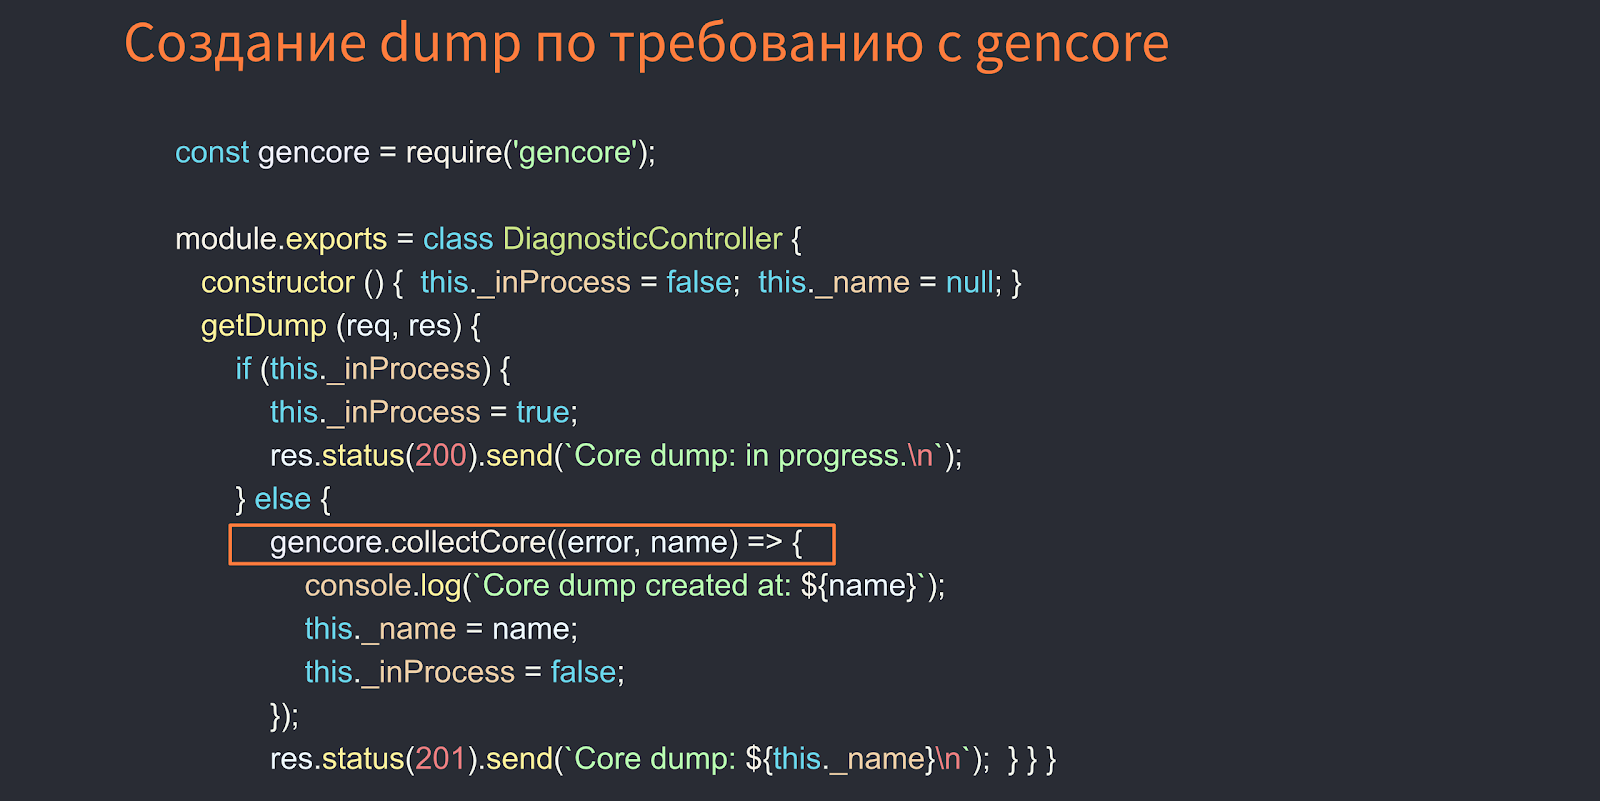
The image below shows an example of gen-core operation.
Here, the DiagnosticController by REST API can make a core dump.
How to find memory leaks using llnode
We have the findjsobjects command, with which we can scan the entire heap and group them by type, get a report on the number of instances of each type of object, their size in memory, etc. The image above shows that there are a lot of ServerResponse and IncomingMessage instances, there are also Timeout and String objects. The strings themselves are very large and take up a lot of memory. Often they are in the large space where the garbage collector does not work.
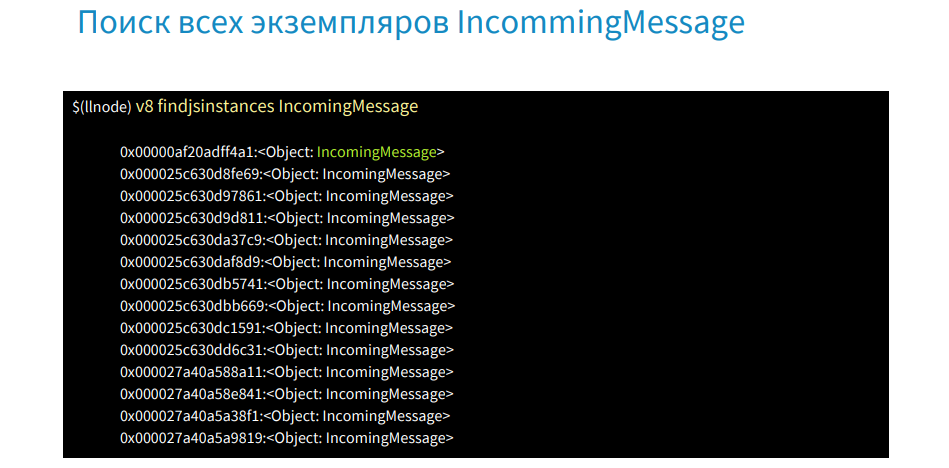
Let's find out why we have a lot of request objects. Remember that the request object was held in Middleware.
There is a command findjsinstances [type], and with its help we get a list of request objects.
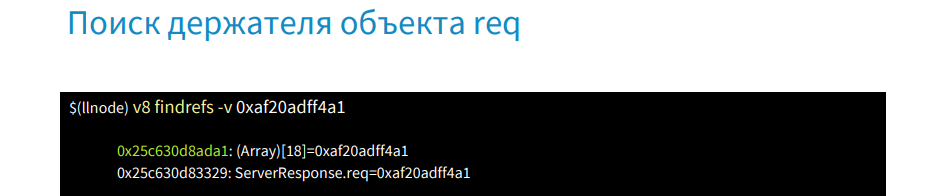
We take the address of the first object and with the help of the v8 command findrefs -v we look for an object in memory that has a link to it.
These are two objects. The first is an array of 18 elements, and the second is the request object. We find out what this array is and why it holds our request objects.
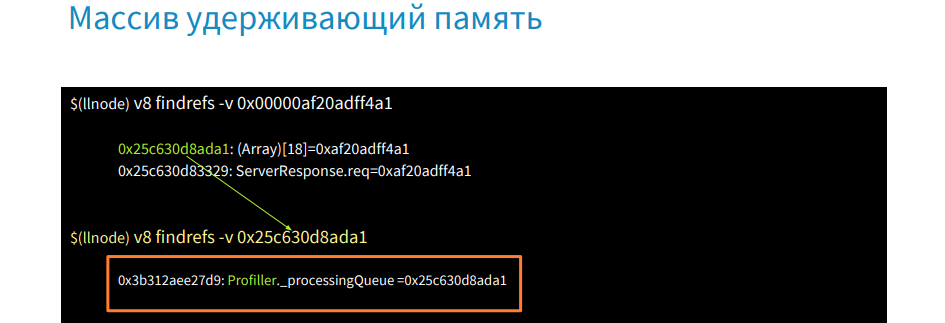
Use the v8 command findrefs -v [address of this array] and find that this array is in an object of type Profiller and the property processingQueue. In this way, we were able to find out where our request objects hold in memory. Next we go to the source code or get it from there and see where the processingQueue is called.
We use the command findjsinstances [type Timeout], get a list of all timeouts and then we will look for where they are used.
With the help of the command v8 i we get the first timeout.
In the onTimeout property, we can see that the setInterval function is called and the address where the file is located. In this way, we quickly learned where the forgotten timer is and why it is executed.
How to detect memory leak at the design stage of the application
If you use the% DebugTrackRetainingPath (x) command, which was added recently to V8 (Node.js does not yet have its support), download the V8 sources, compile and use the V8 debugger, and run the above in the JS image, we will get any links variable to the root object. Do not forget to call the garbage collector. In the example, this is a call to gc ().
We run debug8 with the --allow-natives-syntax, --track-retaining-path, --expose-gc flags and the test.js file. In the listing, we get step by step who and what holds the object up to root.
Thus, we disassembled the search for memory leaks in production.
Application performance profiling
In the image above, you see a real-life example, when, after the next release, we lost five times the performance. The upload time of the Web UI application has increased dramatically.
For such cases there is a simple and effective algorithm of actions, which is demonstrated below.
Although a profiler was added to Node.js in 2013, the tick-processor (a tool that processes V8 logs and reports) appeared only last year. Before that, we used either the V8 profiler, which had a tick-processor in it, or we had to download the V8 itself, build it, and activate the processor there in the tools.
The profiler gives you information at a high level, he will help determine the nature of the problem and see which functions have been performed the longest.
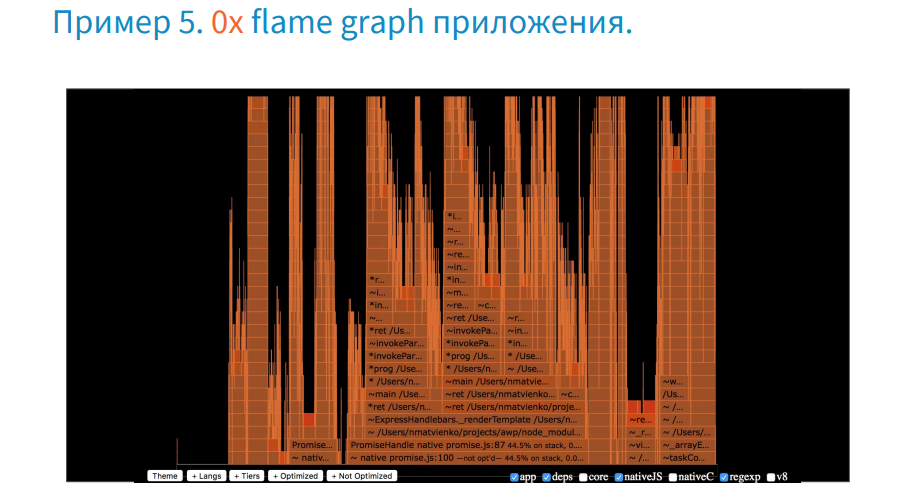
There is a convenient presentation of this log data in graphical form, and it is called flame graph. Designed it in 2013 by Brendan Gregg.
Who remembers, in 2015 the receipt of the graph was a real headache, but now it is created by one team using 0x.
Now let's figure out how to work with him.
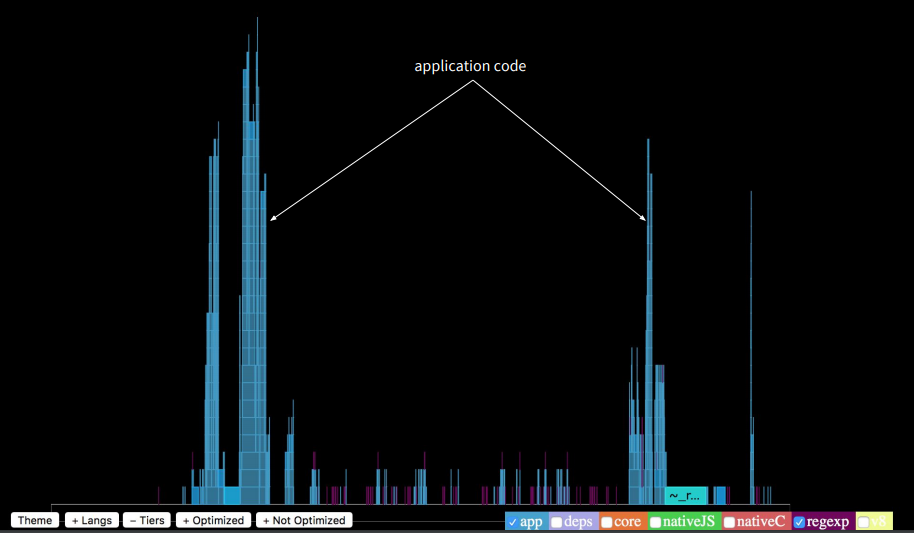
To select the profile of our application, remove all unnecessary with the bottom buttons. As a result, we see that the work of the application takes only a small part of the total execution time.
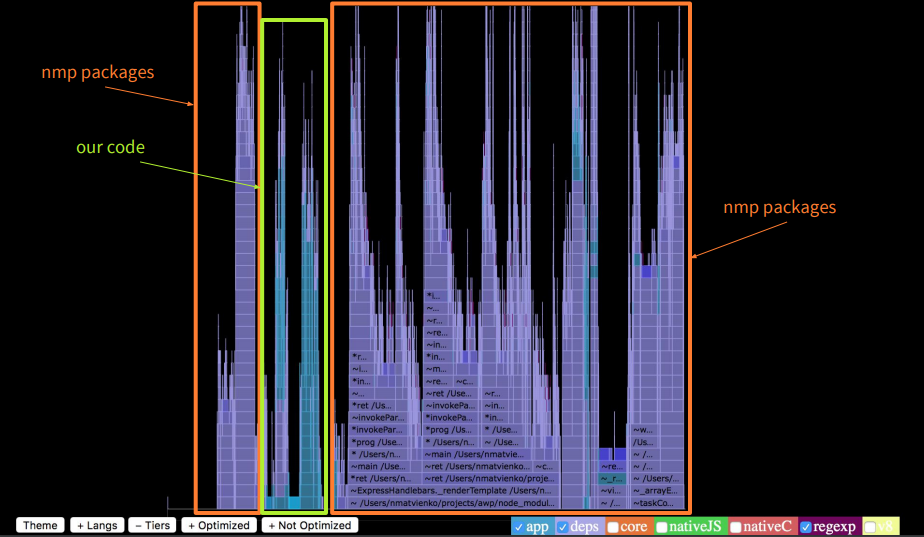
The stack trace of the function call sequence is finite and fits on the screen. What then takes a long time? If we turn on the highlight of the work of npm packages, we will see that they run nine times longer than the application itself. This is a lot.
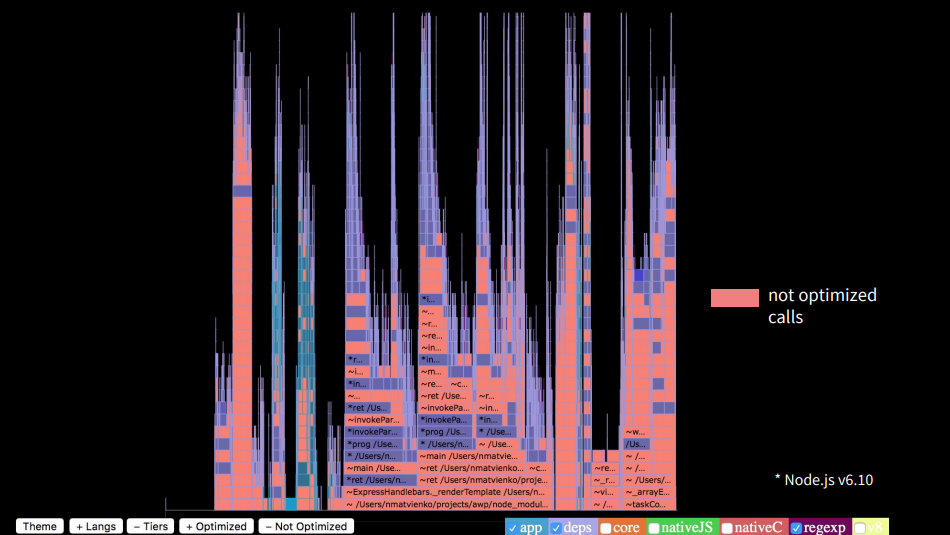
If we highlight the optimized functions, we will see that there are very few of them. About 90% of calls were not optimized.
If we look at the tops of the calls, we will see that in our application a lot of the stack was in the handlebars, in addition we had lodash merge, which did merge objects, we had third-party utilities, which also took time.
If we analyze the same graph of our application, we will see that the foundation is based on native promis, which took a long time to complete before Turbofan. But most of all, it takes page rendering. Our application as a percentage is one-tenth of all logic.
What have we fixed?
- Reducing CPU costly operations: merge, JSON, string parse
- Removing logic from view templates
- Review npm dependencies and update packages
- Node.js update (V8 optimization killers bypass) - in progress
Below is a graph that we see after the corrections.
Here you should pay attention to the right side, where the handlebars helpers. Previously, the view view took up more than half of the graph, and now it is one tenth. We optimized everything fairly well, and now the work of the application itself takes about half of the total time. This does not mean that it began to work longer - all other processes began to work less in time.
The image above shows that at the stage before the release of the critical release, the graph grew, and we gradually lost in productivity. Then there was a sharp jump. In the critical period, we were 3.5 weeks and searched for shortcomings, made changes.
The essence of the problem was that the error (parsing JSON lines) was laid in the application long before this release, and only fired at a certain moment. In the end, after all the fixes and optimizations, we won in performance twice, if we take the initial level as a starting point.
Conclusion
- Performance must be part of the requirements
- Need to make measurements when implementing third-party libraries
- Measurement should be done on staging / pre-production environments
- Need to collect archive of measurement results
Resources used in the report
We hope you find the experience of Nikolai useful. By the way, this Saturday HolyJS 2018 Piter starts , where Nikolay will tell about the decomposition of the Main Thread in Node.js to increase throughput . And if you like the wrong side of JS, you might also be interested in the following reports:
- RxJS: performance and memory leaks in a large application (Evgeny Pozdnyakov, Exadel)
- New adventures in frontend, Season 2 (Vitaly Friedman, Smashing Magazine)
- Meinim crypt in the browser: WebWorkers, GPU, WebAssembly and other good things (Denis Radin, Evolution Gaming)
- Debugging JS on the example of Chrome DevTools (Alexey Kozyatinsky, Google)
Source: https://habr.com/ru/post/358680/
All Articles