Monitoring Elasticsearch without pain and suffering
"And it does magic there"
Someone from those whom I remotely advised on Elastic.
I always say that I believe in three things: monitoring, logs and backups.
The topic of how we collect and store logs was fully disclosed in previous articles , the topic of backups in Elasticsearch is a completely separate story, so in this, perhaps final, article of the cycle I will tell you how my favorite cluster is being monitored. This is not very difficult (and does not require the use of additional plug-ins and third-party services) - because the REST API provided by Elasticsearch itself is simple, understandable and easy to use. All you have to do is to go a little deeper into its internal structure, understand what all these metrics mean, thread pools, the weight of the distribution of shards across the nodes, the queue settings - and there will be no questions about what the elastic is doing for “magic” right now.
')

At the recent Highload ++ 2017 conference, I talked about how I built the cluster of my dreams, and said that it is not enough just to build a service. It is critical at any time to know what state it is in, and the control must be multi-level. Wake me up in the middle of the night (hello to the monitoring department!) - and in two minutes I will know the state of the cluster. And one minute of two will go to connect to the corporate VPN and login to Zabbix.
The lower level of monitoring is hardware and basic metrics, which are collected from any server, but some, in the case of the Elasticsearch cluster, require special attention. Namely:
I specifically highlighted network errors — elastic is extremely sensitive to problems with the network. By default, the current active master pings the rest of the nodes once a second, and the nodes, in turn, check for the presence of the quorum of the master node. If at some stage the node did not respond to ping within 30 seconds, then it is marked as inaccessible, with consequences in the form of cluster rebalance and long integrity checks. And this is not at all what a properly designed cluster should be busy in the middle of the working day.
The level is higher, but monitoring is still the same standard:
If any of the metrics has fallen to zero, this means that the application has fallen or is stuck, and an alert for the disaster level is immediately called.
From this moment begins the most interesting. Since Elasticsearch is written in java, the service runs as a regular jvm application and at first I used Jolokia agent to monitor it, which became the de facto standard for monitoring java applications in our company.
Jolokia, as stated on the developer’s website , is “JMX on capsaicin,” which, in essence, is a JMX-HTTP gate. Runs with the application as a javaagent, listens to the port, accepts http requests, returns JMX metrics wrapped in JSON, and does it quickly, unlike the slow JMX agent of the same Zabbix. Able to authorization, firewall-friendly, allows the separation of access to the level of individual mbeans. In short, a great service for monitoring java-applications, which turned out to be in the case of Elasticsearch ... completely useless.
The fact is that Elasticsearch provides a great API that completely covers all monitoring needs - including the same metrics about the state of the java-machine as Jolokia. Accepts http requests, returns JSON - what could be better?
Let's go through the API in more detail, from simple to complex:
General cluster state metrics. The most important ones are:
Based on these metrics, the following graph is built up with information:
Here and further on click will open larger
In perfect condition, all its metrics should be zero. Alarms on these metrics rise if:
The rest of the metrics do not have a critical impact on the work of the cluster, therefore no alarms have been set for them, but they are collected and graphs are built on them for monitoring and periodic analysis.
Extended statistics on the cluster, from which we collect only a few metrics:
Despite the fact that nodes perform different tasks, the API for getting statistics is called the same way and returns the same set of metrics, regardless of the role of the node in the cluster. And already our task, when creating a template in Zabbix, is the selection of metrics depending on the role of the node. In this API, there are several hundred metrics, most of which are useful only for in-depth analytics of cluster work, and the following are monitored and alerts:
jvm.mem.heap_max_in_bytes - allocated memory in bytes, jvm.mem.heap_used_in_bytes - used memory in bytes, jvm.mem.heap_used_percent - used memory, as a percentage of allocated Xmx.
A very important parameter, and here's why: Elasticsearch stores in the RAM of each data node the index part of each shard belonging to this node for searching. Garbage Collector comes regularly and clears unused memory pools. After some time, if there is a lot of data on the node and it no longer fits into memory, the collector performs longer and longer cleaning, trying to find something that can be cleaned up to the full stop the world.
And due to the fact that the Elasticsearch cluster is running at the speed of the slowest data node, the entire cluster starts to stick. There is another reason to follow the memory - in my experience, after 4-5 hours in a state of jvm.mem.heap_used_percent> 95% drop in the process becomes inevitable.
The graph of memory usage during the day usually looks something like this and this is a completely normal picture. Hot Zone:
Warm zone, here the picture looks calmer, although less balanced:

Reducing the value of http.total_rps metrics from all nodes into one graph allows us to assess the adequacy of load balancing on nodes and see the distortions as soon as they appear. As you can see on the chart below - they are minimal:

throttle_time_in_millis is a very interesting metric that exists in several sections on each node. What section to collect it depends on the role of the node. The metric shows the time to wait for the operation to complete in milliseconds, ideally should not differ from zero:
There are no specific ranges of upper values that throttle_times should fit into, it depends on the specific installation and is calculated empirically. Ideally, of course, should be zero.
search is a section containing metrics for queries executed on the node. It has nonzero values only on data nodes. Of the ten metrics in this section, two are particularly useful:
Based on these two metrics, a graph is plotted of the average time spent on executing one search query for each data node of the cluster:
As you can see - the perfect schedule is even throughout the day, without sharp bursts. There is also a sharp difference in search speed between the “hot” (servers with SSD) and “warm” zones.
It should be noted that when performing a search, Elasticsearch performs it on all the nodes where the index shards are located (both primary and replica). Accordingly, the resulting search time will be approximately equal to the time spent on the search on the slowest node, plus the time to aggregate the data found. And if your users suddenly start complaining that the search has become slow, the analysis of this graph will allow you to find the node that is causing it.
thread_pool is a group of metrics describing queue pools where operations get to be executed. There are many queues, a detailed description of their purpose is in the official documentation , but the set of returned metrics for each queue is the same: threads, queue, active, rejected, largest, completed. The main queues that must be monitored are generic, bulk, refresh and search.
But on these metrics, in my opinion, you need to pay special attention:
The growth of this indicator is a very bad sign, which shows that the elastic does not have enough resources to receive new data. To fight, without adding iron to the cluster, is difficult. You can, of course, add the number of processor processors and increase the size of the bulk queues, but the developers do not recommend this. The right decision is to increase the capacity of iron, add new nodes to the cluster, split up the load. The second unpleasant moment is that the data delivery service before elastic should be able to handle failures and “boost” the data later to avoid data loss.
The failure metric should be monitored for each queue, and an alarm should be attached to it, depending on the node's purpose. It makes no sense to monitor the bulk queue on nodes that do not work on receiving data. Also, the information on loading pools is very useful for optimizing cluster operation. For example, comparing the load of the search pool in different zones of the cluster, you can build an analyst with a reasonable period of data storage on hot nodes before transferring them to slow nodes for long-term storage. However, analytics and fine tuning of the cluster is a separate volume topic and, probably, not for this article.
Well, more or less understood the metrics, it remains to consider the last question - how to receive them and send them to monitoring. Using Zabbix or any other is not important, the principle is the same.
Options, as always, several. You can perform curl queries directly in the API, right up to the desired metric. The pros are simple, the minuses are slow and irrational. You can make a request for the entire API, get a big JSON with all metrics and parse it. Once I did just that, but then I switched to the elasticsearch module in python. In essence, this is a wrapper over the urllib library, which translates functions into the same requests to the Elasticsearch API and provides a more convenient interface to them. The source code of the script and a description of its work can traditionally be viewed on GitHub . Templates and screenshots in Zabbix, unfortunately I can not provide, for obvious reasons.

There are many (several hundred) metrics in the Elasticsearch API and listing them all is beyond the scope of one article, so I described only the most significant of those that we collect and what we need to pay close attention to when monitoring them. I hope that after reading the article, you have no doubt that elastic does not do any “magic” inside - only the normal work of a good, reliable service. Peculiar, not without cockroaches, but nevertheless, beautiful.
If something remains unclear, any questions have arisen or some places require more detailed consideration - write in the comment, we will discuss.
Someone from those whom I remotely advised on Elastic.
I always say that I believe in three things: monitoring, logs and backups.
The topic of how we collect and store logs was fully disclosed in previous articles , the topic of backups in Elasticsearch is a completely separate story, so in this, perhaps final, article of the cycle I will tell you how my favorite cluster is being monitored. This is not very difficult (and does not require the use of additional plug-ins and third-party services) - because the REST API provided by Elasticsearch itself is simple, understandable and easy to use. All you have to do is to go a little deeper into its internal structure, understand what all these metrics mean, thread pools, the weight of the distribution of shards across the nodes, the queue settings - and there will be no questions about what the elastic is doing for “magic” right now.
')
At the recent Highload ++ 2017 conference, I talked about how I built the cluster of my dreams, and said that it is not enough just to build a service. It is critical at any time to know what state it is in, and the control must be multi-level. Wake me up in the middle of the night (hello to the monitoring department!) - and in two minutes I will know the state of the cluster. And one minute of two will go to connect to the corporate VPN and login to Zabbix.
Disclaimer: The described structure consists of the Elasticsearch 5.xx cluster, with dedicated master, data, and client nodes. The cluster is divided into “hot” and “warm” segments (hot / warm cluster architecture). Screenshots are given on the monitoring system Zabbix. But the general principles of ES monitoring can be applied to a cluster of almost any configuration and version.So, the levels of monitoring from the bottom up:
Server level
The lower level of monitoring is hardware and basic metrics, which are collected from any server, but some, in the case of the Elasticsearch cluster, require special attention. Namely:
- Loading processor cores and total LA;
- Memory usage;
- Ping to server and response time;
- i / o on the disk subsystem;
- The remaining free space on the disks (the watermark.low setting by default prohibits the elastic to create new indices in the presence of less than 85% free space);
- The use of the network and, especially, collisions and errors on the interfaces.
I specifically highlighted network errors — elastic is extremely sensitive to problems with the network. By default, the current active master pings the rest of the nodes once a second, and the nodes, in turn, check for the presence of the quorum of the master node. If at some stage the node did not respond to ping within 30 seconds, then it is marked as inaccessible, with consequences in the form of cluster rebalance and long integrity checks. And this is not at all what a properly designed cluster should be busy in the middle of the working day.
Service level
The level is higher, but monitoring is still the same standard:
- The number of running processes of the elasticsearch service;
- Memory used by the service;
- Ping to the application port (standard ports elasticsearch / kibana - 9200/9300/5601).
If any of the metrics has fallen to zero, this means that the application has fallen or is stuck, and an alert for the disaster level is immediately called.
Application level
From this moment begins the most interesting. Since Elasticsearch is written in java, the service runs as a regular jvm application and at first I used Jolokia agent to monitor it, which became the de facto standard for monitoring java applications in our company.
Jolokia, as stated on the developer’s website , is “JMX on capsaicin,” which, in essence, is a JMX-HTTP gate. Runs with the application as a javaagent, listens to the port, accepts http requests, returns JMX metrics wrapped in JSON, and does it quickly, unlike the slow JMX agent of the same Zabbix. Able to authorization, firewall-friendly, allows the separation of access to the level of individual mbeans. In short, a great service for monitoring java-applications, which turned out to be in the case of Elasticsearch ... completely useless.
The fact is that Elasticsearch provides a great API that completely covers all monitoring needs - including the same metrics about the state of the java-machine as Jolokia. Accepts http requests, returns JSON - what could be better?
Let's go through the API in more detail, from simple to complex:
Cluster Level
_cluster / health
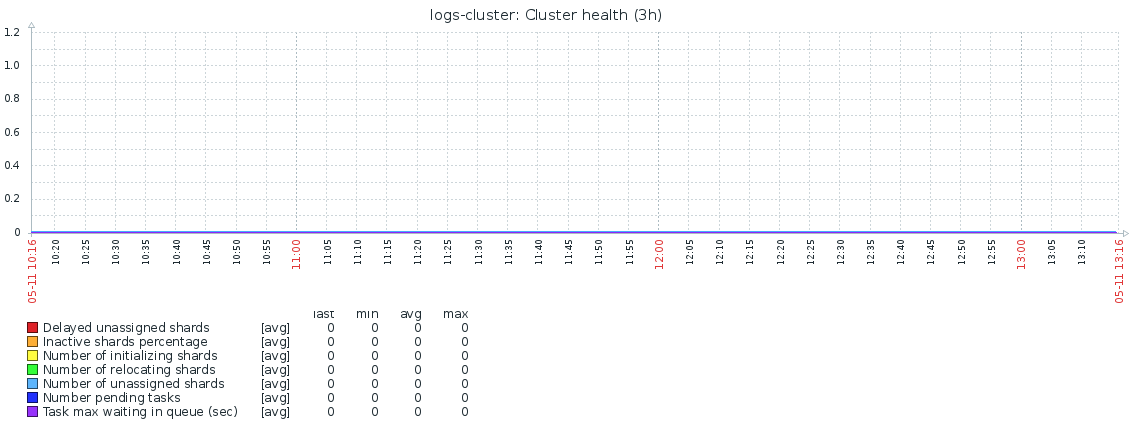
General cluster state metrics. The most important ones are:
- status - takes one of the values: green / yellow / red. Everything is clear: green - everything is good; yellow - some shards are missing / initialized, but the rest of the cluster is enough to get into a consistent state; red - everything is bad, some indexes lack shards up to 100% integrity, trouble, tragedy, wake the admin (but the cluster nevertheless accepts new data).
- number_of_nodes / number_of_data_nodes - the total number of nodes in the cluster, the number of date-nodes. It is useful to monitor their change, because sometimes (extremely rarely) there are situations when one of the nodes is stuck under load and falls out of the cluster, but consumes resources and keeps the port open. This behavior is not detected by standard service monitoring (the level is lower), but the integrity of the cluster is also affected by how.
- relocating_shards - shards that are in the process of rebalance, move from one data node to another.
- initializing_shards - initializing shards. The metric differs from zero only at the moments when new indices are created and the elastic distributes their shards to the nodes. The situation is quite normal, but only if this process does not last longer than some time. Time is calculated empirically, on my cluster is set to ± 10 minutes. If longer - something is wrong, alert.
- unassigned_shards - the number of unassigned shards. The value of the metric is not equal to zero - this is a very bad sign. Either the node fell out of the cluster, or there is not enough space for placement, or some other reason and you need to immediately understand.
- number_of_pending_tasks - the number of tasks in the queue for execution. If it is not zero, we lose realtime, the cluster does not have time.
- task_max_waiting_in_queue_millis - the average time the task waits in the queue for execution (in ms). Similar to the previous metric, it must be zero. For "there is nothing worse than catching up and waiting."
- active_shards_percent_as_number - the number of active shards in percent. Active shards are all but those that are in the unassigned / initializing state. In normal condition - 100%. For convenience of displaying on charts, I use the inverse metric calculated as inactive_shards_percent_as_number = 100 - active_shards_percent_as_number.
Based on these metrics, the following graph is built up with information:
Here and further on click will open larger
In perfect condition, all its metrics should be zero. Alarms on these metrics rise if:
- status = red - immediately, yellow - after 10 minutes;
- the number of nodes is less than the fixed number;
- the number of shards in the initializing status is greater than 0 for more than 10 minutes;
- the number of shard in the status of unassigned is not equal to 0 - immediately.
The rest of the metrics do not have a critical impact on the work of the cluster, therefore no alarms have been set for them, but they are collected and graphs are built on them for monitoring and periodic analysis.
_cluster / stats
Extended statistics on the cluster, from which we collect only a few metrics:
- docs.count - the number of indexed records in the cluster as of the current time. The number of new entries per second is calculated from this metric using a simple formula: rps = (docs.count (t) - docs.count (t-1)) / t. And if suddenly rps fell to zero - alarm.
- indices.count - we use Elasticsearch for storing and online access to application logs. Every day, a new index is created for the logs of each application, and every day indexes older than 21 days are removed from the cluster. Thus, the same number of indices is created and deleted every day. The increase in the total number of indices means that either the admins have placed the logs of the new application under elastic, or the cleaning script of the old indices has broken. Not critical, but you need to glance.
- fs.free_in_bytes, fs.total_in_bytes, fs.available_in_bytes - information about the file system, stores data about the total amount of space available to the entire cluster.
Node level
_nodes / stats
Despite the fact that nodes perform different tasks, the API for getting statistics is called the same way and returns the same set of metrics, regardless of the role of the node in the cluster. And already our task, when creating a template in Zabbix, is the selection of metrics depending on the role of the node. In this API, there are several hundred metrics, most of which are useful only for in-depth analytics of cluster work, and the following are monitored and alerts:
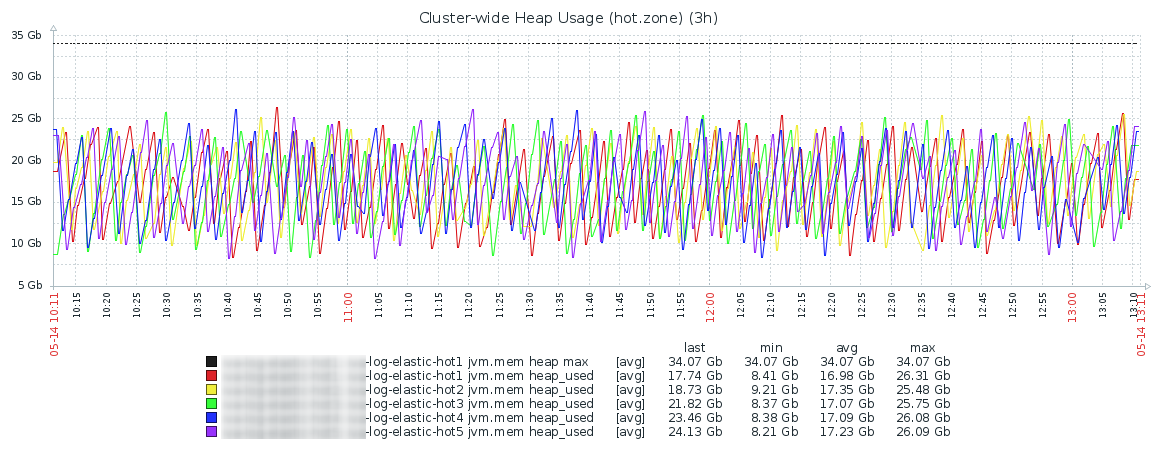
Metrics on process memory elastic
jvm.mem.heap_max_in_bytes - allocated memory in bytes, jvm.mem.heap_used_in_bytes - used memory in bytes, jvm.mem.heap_used_percent - used memory, as a percentage of allocated Xmx.
A very important parameter, and here's why: Elasticsearch stores in the RAM of each data node the index part of each shard belonging to this node for searching. Garbage Collector comes regularly and clears unused memory pools. After some time, if there is a lot of data on the node and it no longer fits into memory, the collector performs longer and longer cleaning, trying to find something that can be cleaned up to the full stop the world.
And due to the fact that the Elasticsearch cluster is running at the speed of the slowest data node, the entire cluster starts to stick. There is another reason to follow the memory - in my experience, after 4-5 hours in a state of jvm.mem.heap_used_percent> 95% drop in the process becomes inevitable.
The graph of memory usage during the day usually looks something like this and this is a completely normal picture. Hot Zone:
Warm zone, here the picture looks calmer, although less balanced:
- fs.total.total_in_bytes, fs.total.free_in_bytes, fs.total.available_in_bytes - metrics on the disk space available to each node. If the value approaches watermark.low - alarm.
- http.current_open, http.total_opened - the number of open http connections to the nodes — at the time of the survey and the total, cumulative counter since the start of the node, from which rps is easily calculated.
Reducing the value of http.total_rps metrics from all nodes into one graph allows us to assess the adequacy of load balancing on nodes and see the distortions as soon as they appear. As you can see on the chart below - they are minimal:
throttle_time_in_millis is a very interesting metric that exists in several sections on each node. What section to collect it depends on the role of the node. The metric shows the time to wait for the operation to complete in milliseconds, ideally should not differ from zero:
- indexing.throttle_time_in_millis - the time that the cluster spent waiting for new data to be indexed. It makes sense only on nodes that accept data.
- store.throttle_time_in_millis is the time taken by the cluster to wait when writing new data to disk. Similar to the metric above - it makes sense only on the nodes where the new data is received.
- recovery.throttle_time_in_millis - includes not only the waiting time when restoring a shard (for example, after failures), but also the waiting time when moving a shard from a node to a node (for example, when rebalancing or migrating a shard between hot / warm zones). The metric is especially relevant on nodes where data is stored for a long time.
- merges.total_throttled_time_in_millis is the total time spent by the cluster waiting for the merging of segments on this node. Accumulative counter.
There are no specific ranges of upper values that throttle_times should fit into, it depends on the specific installation and is calculated empirically. Ideally, of course, should be zero.
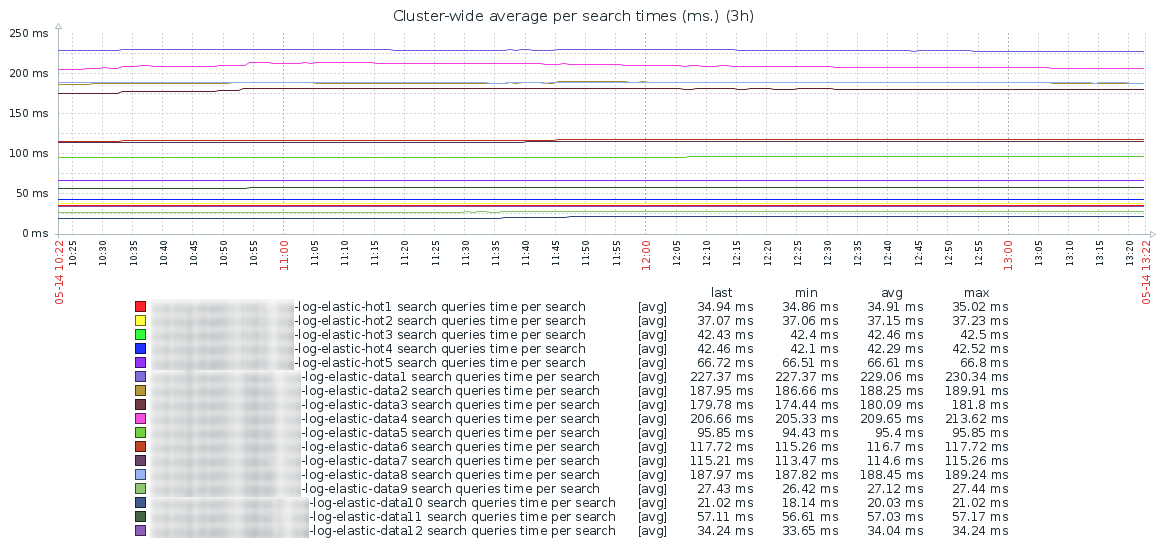
search is a section containing metrics for queries executed on the node. It has nonzero values only on data nodes. Of the ten metrics in this section, two are particularly useful:
- search.query_total - all search requests made on the node since it was restarted. From this metric we calculate the average number of requests per second.
- search.query_time_in_millis is the time in milliseconds spent on all search operations since the node was restarted.
Based on these two metrics, a graph is plotted of the average time spent on executing one search query for each data node of the cluster:
As you can see - the perfect schedule is even throughout the day, without sharp bursts. There is also a sharp difference in search speed between the “hot” (servers with SSD) and “warm” zones.
It should be noted that when performing a search, Elasticsearch performs it on all the nodes where the index shards are located (both primary and replica). Accordingly, the resulting search time will be approximately equal to the time spent on the search on the slowest node, plus the time to aggregate the data found. And if your users suddenly start complaining that the search has become slow, the analysis of this graph will allow you to find the node that is causing it.
thread_pool is a group of metrics describing queue pools where operations get to be executed. There are many queues, a detailed description of their purpose is in the official documentation , but the set of returned metrics for each queue is the same: threads, queue, active, rejected, largest, completed. The main queues that must be monitored are generic, bulk, refresh and search.
But on these metrics, in my opinion, you need to pay special attention:
- thread_pool.bulk.completed - a counter storing the number of operations performed for batch (bulk) writing data to the cluster since the node was restarted. From it rps is calculated by the record.
- thread_pool.bulk.active - the number of tasks in the queue to add data at the time of the survey, shows the cluster load on the record at the current time. If this parameter goes beyond the set queue size, the next counter starts to grow.
- thread_pool.bulk.rejected - count the number of failures for requests to add data. It makes sense only on the nodes that receive data. It is summarized by a cumulative result, separately by nodes, reset to zero at the time of full reboot of the node.
The growth of this indicator is a very bad sign, which shows that the elastic does not have enough resources to receive new data. To fight, without adding iron to the cluster, is difficult. You can, of course, add the number of processor processors and increase the size of the bulk queues, but the developers do not recommend this. The right decision is to increase the capacity of iron, add new nodes to the cluster, split up the load. The second unpleasant moment is that the data delivery service before elastic should be able to handle failures and “boost” the data later to avoid data loss.
The failure metric should be monitored for each queue, and an alarm should be attached to it, depending on the node's purpose. It makes no sense to monitor the bulk queue on nodes that do not work on receiving data. Also, the information on loading pools is very useful for optimizing cluster operation. For example, comparing the load of the search pool in different zones of the cluster, you can build an analyst with a reasonable period of data storage on hot nodes before transferring them to slow nodes for long-term storage. However, analytics and fine tuning of the cluster is a separate volume topic and, probably, not for this article.
Data acquisition
Well, more or less understood the metrics, it remains to consider the last question - how to receive them and send them to monitoring. Using Zabbix or any other is not important, the principle is the same.
Options, as always, several. You can perform curl queries directly in the API, right up to the desired metric. The pros are simple, the minuses are slow and irrational. You can make a request for the entire API, get a big JSON with all metrics and parse it. Once I did just that, but then I switched to the elasticsearch module in python. In essence, this is a wrapper over the urllib library, which translates functions into the same requests to the Elasticsearch API and provides a more convenient interface to them. The source code of the script and a description of its work can traditionally be viewed on GitHub . Templates and screenshots in Zabbix, unfortunately I can not provide, for obvious reasons.
Conclusion
There are many (several hundred) metrics in the Elasticsearch API and listing them all is beyond the scope of one article, so I described only the most significant of those that we collect and what we need to pay close attention to when monitoring them. I hope that after reading the article, you have no doubt that elastic does not do any “magic” inside - only the normal work of a good, reliable service. Peculiar, not without cockroaches, but nevertheless, beautiful.
If something remains unclear, any questions have arisen or some places require more detailed consideration - write in the comment, we will discuss.
Source: https://habr.com/ru/post/358550/
All Articles