Java and Linux - features of operation
Java is a very common platform, they write very different things on it, starting from Big Data, ending with microservices, monoliths, enterprise and so on. And, as a rule, all this is deployed on Linux servers. At the same time, accordingly, those people who write in Java often do it on completely different operating systems. They are there:
The fact that it works, there is no special magic. But this leads to the fact that such developers "suck up" a bit in their world of cross-platform and do not really want to understand, but how it actually works in a real operating system .

')
On the other hand, there are those who administer servers, install JVMs on their servers, send jar and war files, and from the point of view of the Linux world, all this:
The purpose of the report by Alexey Ragozin on Highload ++ , the decoding of which goes further, was to tell Java features for Linux users and, accordingly, Linux to Java developers .
The report will not be debriefing, because there are a lot of problems, they are all interesting, and the projectile twice does not get into the same funnel. Therefore, plugging the already known "holes" is a defeatist position. Instead, let's talk about:
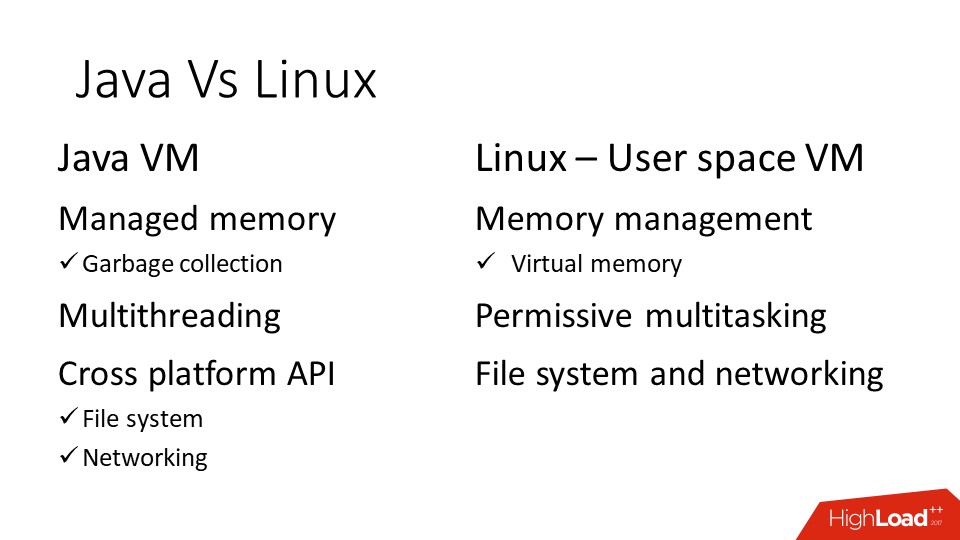
Java has a virtual machine, and Linux, like any other modern operating system, in fact, is also a virtual machine. Both Java and Linux have memory management , threads , APIs .
Words are similar, but in fact completely different things are often hidden under them. Actually, on these points we will go through, paying the most attention to the memory.
Java memory
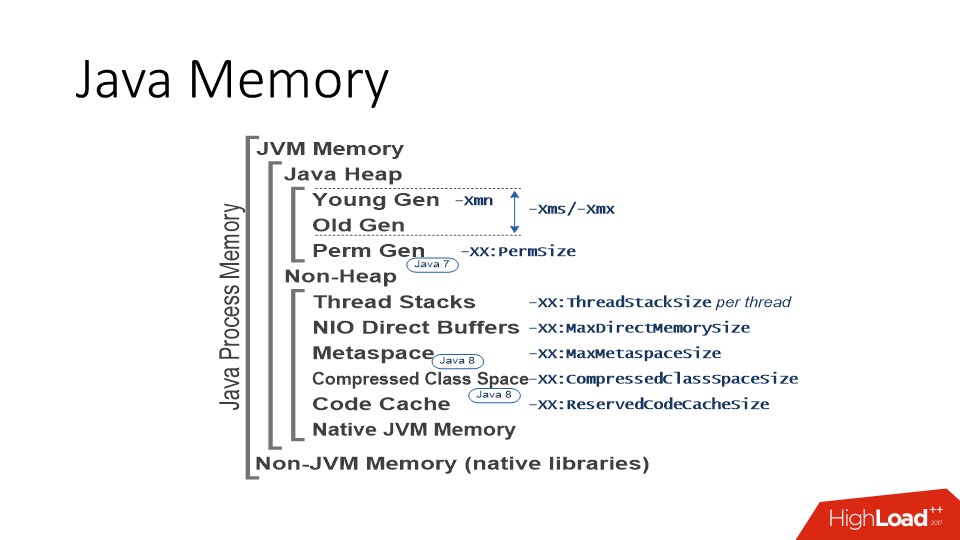
I’ll immediately note that I’ll only talk about the implementation of the JVM HotSpot, this is the Open JDK and Oracle JDK. That is, for sure IBM J9 has some features of its own, but unfortunately I don’t know about them. If we are talking about HotSpot JVM, then the picture of the world is as follows. First of all, in Java there is an area where java-objects live - the so-called Heap or, in Russian, a bunch of where the garbage collector works. This memory area usually takes up most of the process space. The heap is in turn divided into a young and old space (Young Gen / Old Gen). Without going into the JVM Siding Derby, the important thing is that the JVM has a “-Xmx” parameter that defines the maximum size to which the heap space can grow.
And then there are many options:
There are too many details - it is important that there is a limit. And, in principle, this is a general approach to all areas that use the JVM. That is, almost all areas listed in the picture above have a certain limit. The JVM immediately reserves the address space , based on the limit, and then as necessary, asks for real memory resources in this range. It is important to understand.
In addition to the heap, there are other memory consumers. The most important of these are the memory areas for the stacks of threads. Threads in Java are regular linux threads, they have a stack for which a certain amount of memory is reserved. The more threads you have, the more stacks are allocated in the process memory. Since the number of threads in Java can be measured in hundreds and thousands, sometimes this figure can become quite significant, especially if you have some kind of stateless microservice, in which a heap of 200 MB and a ThreadPool of 50-100 threads.
In addition, there are still so-called NIO Direct Buffers - these are special objects in Java that allow you to work with memory outside the heap . They are usually used to work with I / O, because it is a memory that can be directly accessed by both C and Java code. Accordingly, this area is accessible through the API, and it also has a maximum limit.
The rest is metadata, some kind of generated code, the memory for them usually does not grow to large values, but it exists.
In addition to these special areas, we must not forget that the JVM is written in C ++, respectively, there is
And this memory is not classified according to our scheme, but is simply a memory allocated by standard C Runtime tools. C, too, sometimes there are problems, and on a fairly level ground.
For example, here we have java code distributed in the jar form. Jar is a zip-archive, zlib library is used to work with it. In order to unzip something, zlib must allocate a buffer that will be used for decompression and, of course, it requires memory. All anything, but now there is a fashion for the so-called uber-jar, when one hefty jar is created, and there are nuances.
When attempting to start from such a jar file, too many zlib threads are opened at the same time for unpacking. And from the point of view of Java, everything is fine: the heap is small, all areas are small, but the memory consumption of the process is growing. This is, of course, a “clinical” case, but such needs of the JVM must be taken into account. For example, if you set -Xmx to 1 GB, put Java in the Docker container and set the memory limit on the container to 1 GB too, then the JVM will not fit in it . We still need to throw a little bit, but how much exactly - depends on many factors, including the number of threads and exactly what your code does.
So this is how the JVM works with memory.
Now, so to speak, for another part of the audience.
Linux Memory
There is no garbage collector in Linux. His work in terms of memory is completely different. He has a physical memory that is paginated ; There are processes that have their own address space . It needs the resources of this memory in the form of pages to be somehow divided between processes, so that they work in their virtual address space and do their work.
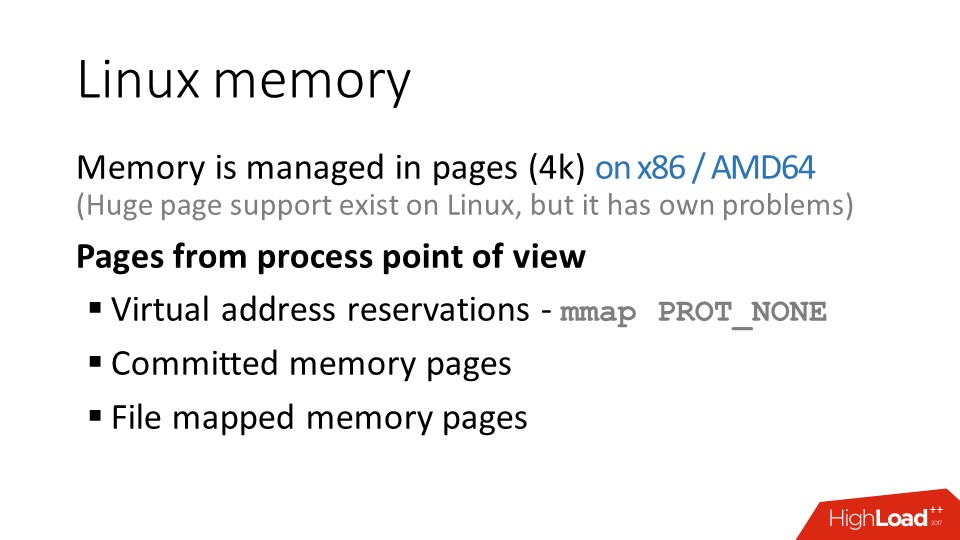
The page size is usually 4 kilobytes. In fact, this is not the case; in x86 architecture, there is support for large pages for a very long time. In Linux, it appeared relatively recently, and with it a little bit incomprehensible situation. When support for large pages (Transparent Huge Tables) appeared in Linux, many people stepped on the rake related to performance degradation due to some of the nuances of serving large pages in Linux. And soon the Internet was filled with recommendations to turn them off out of harm's way. After that, some bugs related to the work of large pages in Linux were repaired, but the sediment remained.
But at the moment there is no clear understanding, for example, from which version support for large pages can be enabled by default and do not worry.
So from the kernel’s point of view, Linux has many pages to manage. From a process point of view, there is an address space in which it reserves address ranges. The reserved address space is nothing, not a resource, there is nothing in it . If you contact this address, you will receive a segfault, because there is nothing there.
In order for a page to appear in the address space, a slightly different syscall is needed, and then the process says to the operating system: "I need 1 GB of memory in these addresses." But even in this case, the memory appears there, too, not immediately and with his tricks.
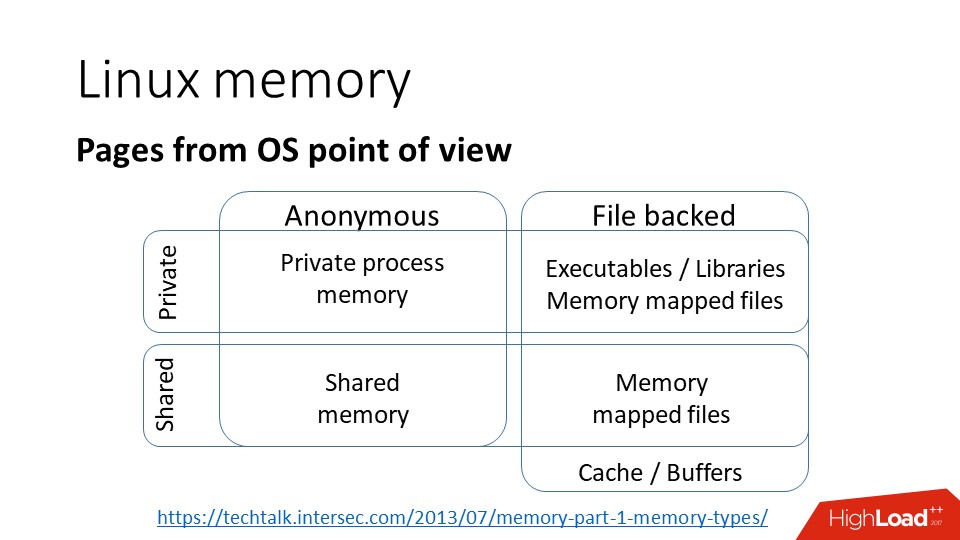
From the point of view of the kernel, the classification of pages looks like this, there are pages:
a) private , that is, it means that they belong to one process and are available in the address space of only one process;
b) anonymous - this is ordinary memory, not bound in files;
c) memory mapped files - mapping files to memory;
d) shared , which may be either:
In general, from the point of view of the operating system kernel, everything is quite simple.
Simple, but not quite.
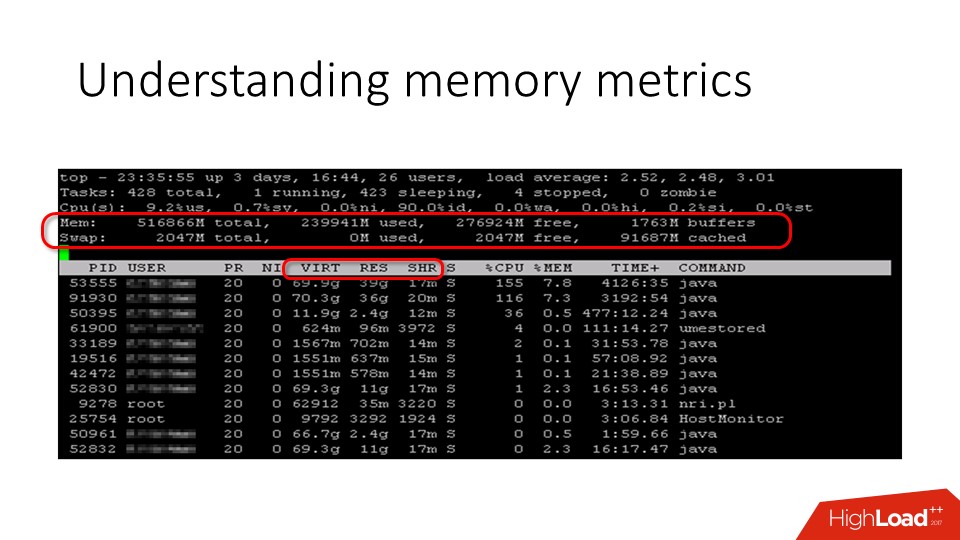
When we want to understand what is happening on the server in terms of memory, we go to the top and see some numbers there. In particular, there is used memory and free memory . There are different opinions about how much free memory should be on the server. Someone thinks that this is 5%, but, in fact, 0% of physical memory is also the norm , because what we see as a free memory counter is not really all free memory. It is actually much more, but it is usually hidden in the page cache.
In terms of the process, top shows three interesting columns:
The last memory in the list is just those pages that are shared. But with resident memory, everything is a little trickier. Let us dwell in more detail on these metrics.
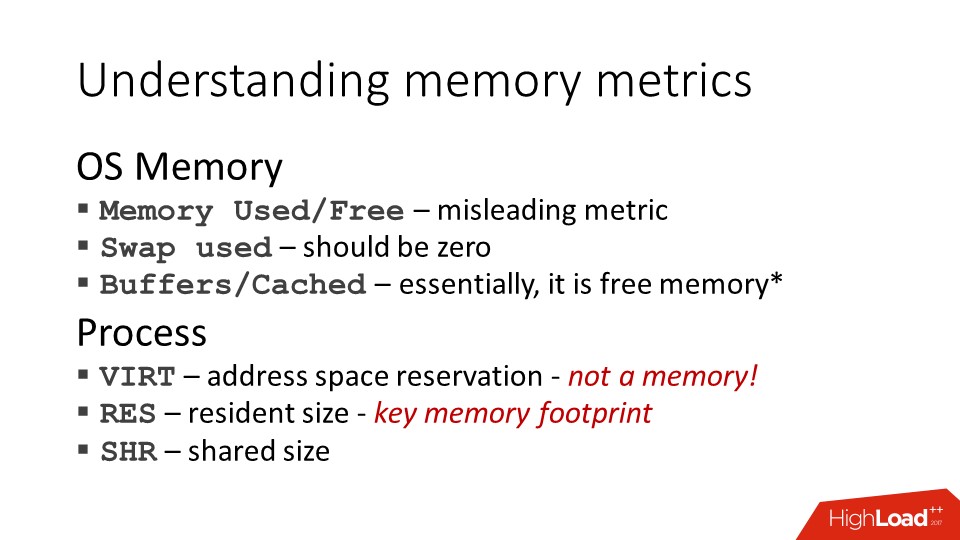
As I have already said, used and free memory are quite useless metrics. The server still has memory, which has never been used, because the operating system has a file cache , and all modern OSs use all free memory for it, since the file cache page can always be cleared and used for more important tasks. Therefore, all free memory gradually goes to the cache and does not come back .
The virtual memory metric is not a resource at all in terms of the operating system. You can easily allocate 100 terabytes of address space, that's all. We have done this and can be proud that space from the address X to the address Y is reserved, but no more. Therefore, to look at it as a resource and, for example, to set an alert that the virtual size of the process has exceeded a certain threshold, rather pointless.
Back to Java, it reserves all of its special areas in advance, because the JVM code expects these areas to be contiguous in terms of address space. So the address must be staked in advance. In this regard, by starting the process with a 256 MB heap, you can suddenly see that it has more than two gigabytes of virtual size. Not because these gigabytes are needed and that the JVM is capable of ever recycling them, but simply defaulting. From him neither cold nor hot, at least so thought those who wrote the JVM. This, however, does not always correspond to the opinion of those who then engaged in server support.
Residence size - the metric closest to reality - is the number of memory pages used by a process that is in memory, not in a swap. But it is also a little peculiar.
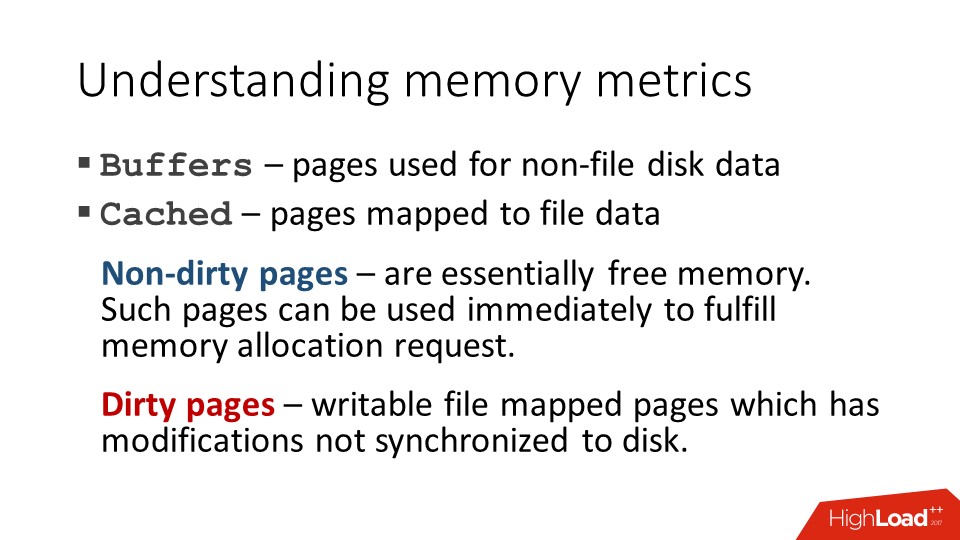
Cache
Returning to the cache. As I said, the cache is, in principle, free memory , but sometimes there are exceptions. Because the pages in the cache are clean and dirty (containing not saved changes). If the page in the cache is modified, then before it can be used for another purpose, it must first be written to disk. And this is another story. For example, the JVM writes a big-big heap dump. She does it slowly, the process is as follows:
If the size of this dump is comparable to the size of the server's physical memory, a situation may arise that there will simply not be free memory for all other processes.
That is, we, for example, open a new ssh session - to start the shell process, you need to allocate memory. The process follows memory, and the core tells him: “Wait, please, now I will find something.” Finds, but before it manages to give this page to SSHD, Java manages to “blot out” a few more pages, because it also “hangs” in Page Fault and, as soon as a free page appears, it quickly manages to grab this memory sooner than what other processes. In practice, such a situation led, for example, to the fact that the monitoring system simply decided that this server was not “live” once it was impossible to access it via ssh. But this, of course, an extreme case.
Another process in Linux, in addition to virtual size and resident size, has a committed size — this is the memory that the process is actually going to use, that is, the address space, when accessing which you do not get a segfault, and when accessing which, the kernel must provide you with a physical memory page. .
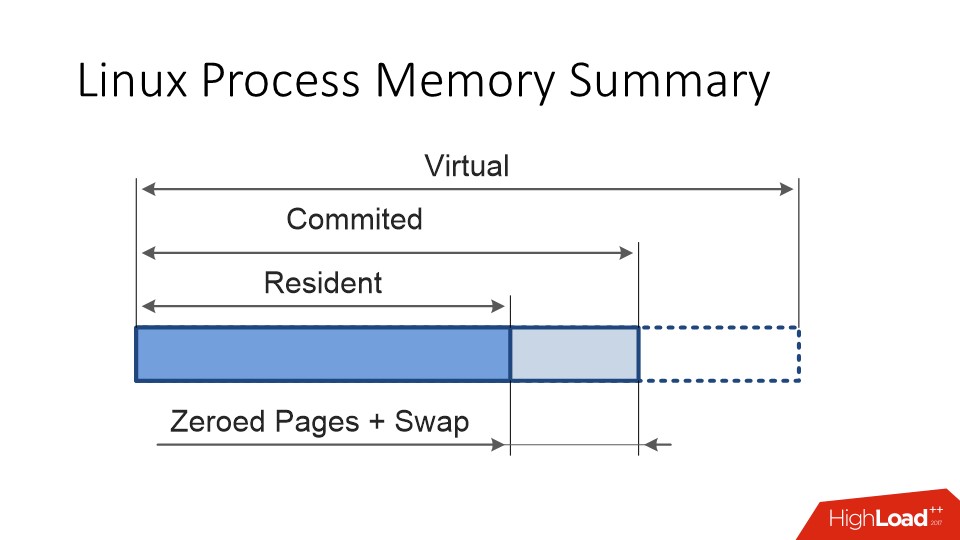
In an ideal situation, committed and re sident should have been the same . But, first, the pages can "swap."
Secondly, Linux memory is always lazy.
Then it turns out that there are only 16 physical memories, and he distributed everything to 10. And it starts “who took the first one, that and slippers, and who was not lucky, OMKiller will come after that”. These are Linux memory management features.
JVM Important Facts
First, the JVM really dislikes swapping . If I complain that the java-application for some reason slows down, then the first thing that I do is look at whether there is a swap on the server. Because there are two factors that make Java very intolerant to swapping:
There is a safe-point mechanism that is used in JVM for all black magic like recompiling code on the fly, garbage collection, and so on. If one thread hit the Page Fault and waits, then the JVM cannot normally enter the safe-point state, because it does not receive confirmation from the stream that is waiting for the memory page to “arrive”. And all the other streams have already stopped and are also waiting. All stand, waiting for this one unfortunate stream. Therefore, as soon as your paging starts, a very significant degradation of performance can begin.
Second, Java never gives away memory to the operating system . She will use as much as you have allowed, even if she doesn’t really need these resources now, she will not give them back. There are garbage collectors who are technically able to do this, but do not expect that they will do it.
The garbage collector has this logic: it either uses more
CPU, or more memory. If you allowed him to use 10 GB, then he reasonably assumes that you can save CPU resources, and wait 10 GB with garbage, while the CPU is doing something useful, instead of cleaning the memory, which does not go beyond the limit.
Otherwise, everything that is in this container will suffer.
When memory runs out
This is another of those situations that are perceived very differently by “javistami” and “linuxoids”.
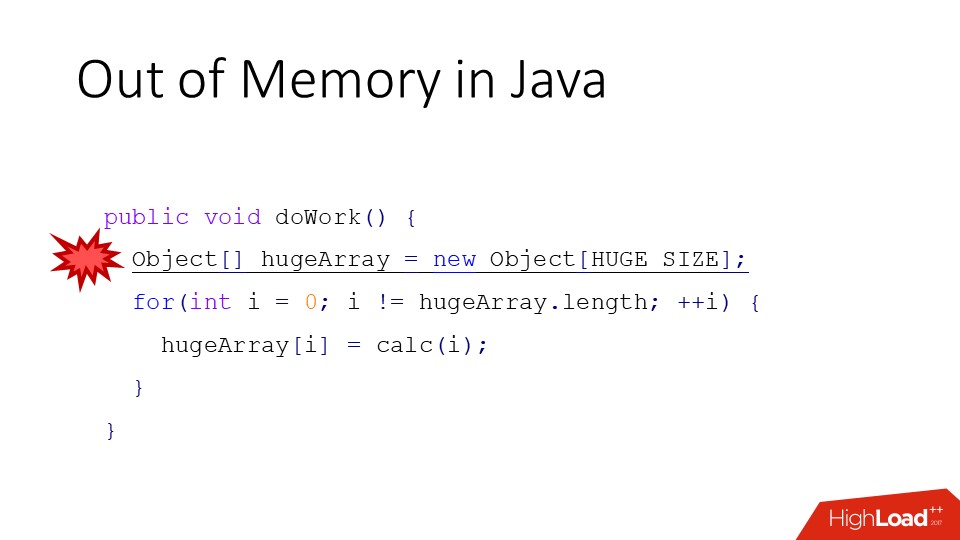
In Java, this happens as follows: there is a new operator that allocates an object (on the slide this is a large array), if there is not enough space on the heap to allocate memory for this large array, we get Out of Memory error.
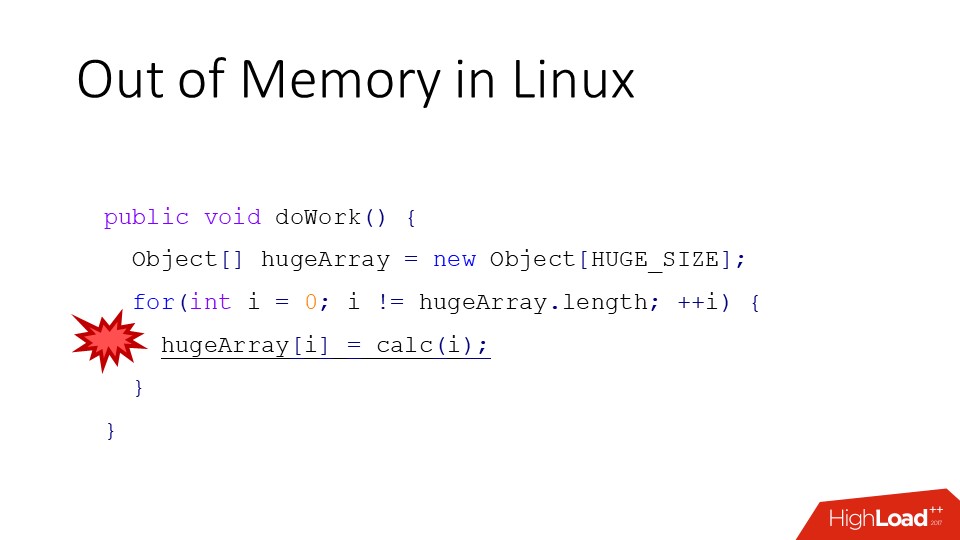
Linux is different. As we remember, Linux can easily promise more memory than it actually is, and you start working with it (the above conditional code). And unlike JVM, you will receive not an error, but the crash of the process chosen by OMKiller or the death of the entire container if it is a question of exceeding the cgroups quota.
When memory runs out in JVM
Now, we will understand a little more. In Java, we have a so-called area of young objects and an area of old ones. When we call the new operator, an object is allocated in the space of young objects. If the space in the space of young objects is over, either young or complete garbage collection occurs , if the young assembly is not enough. The bottom line is that, firstly, if we do not have enough memory, garbage collection occurs. And before the Out of Memory error occurs, at least one complete build will take place, i.e. Such a slow through all our ten-gigabyte heap. In some cases, it will also be in one thread, because full GC is a special case.
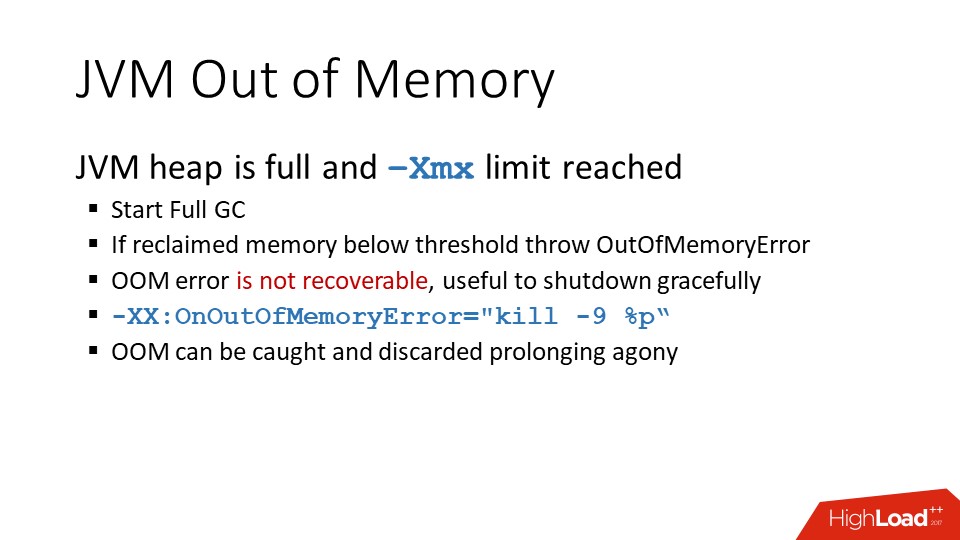
At the same time, the garbage collector will probably scrap something. But if this is anything less than 5% of the heap size , an error will still be thrown out, because this is already “not life, but sheer torture”. But if this Out of Memory error occurs in a stream, the author of the code of which decided that his stream should work, regardless of any errors, he can prolong this agony by intercepting exceptions.
In general, after shooting Out of Memory error, the JVM can no longer be considered alive. The internal state may already be destroyed, and there is such an option (
There may be another situation, it is possible that the heap is not yet the maximum size (less than -Xmx), but the garbage collection did not collect enough memory, and the JVM decided that it was necessary to increase the heap . Went to the operating system, says: "give me more memory," and the OS says: "no." True, as I said, Linux does not say that, but other systems say so. Any error in allocating the operating system memory from the point of view of the JVM is a crash, no questions, no exceptions, no logs, just a standard crash dump, and the process is terminated immediately.
There is also a second type of Out of Memory, which is associated with the so-called direct memory buffers. These are special objects in Java that reference off-heap memory. Accordingly, they also allocate it, manage the life cycle of this memory, that is, there is still a certain collection of garbage there. To prevent such buffers from taking up an infinitely large amount of memory, they have a limit that the JVM exposes to itself. Sometimes it becomes necessary to correct it, for which, naturally, there is a magic -XX option, for example,
As I said, the JVM at the start is important to know how much you allow it to use memory, because based on this, all the garbage collector heuristics are built.
How much to allocate memory "in grams" is a difficult question, but here are the main points:
In addition to the heap, there are also direct buffers, some kind of reserve of the JVM, which must also be determined empirically.
Moving on, in Linux there is such a thing as ulimit - this is such a strange construction, in my opinion, javista. For a process, there is a set of quotas that the operating system specifies. There are different quotas for the number of open files, which is logical, and for some other things.
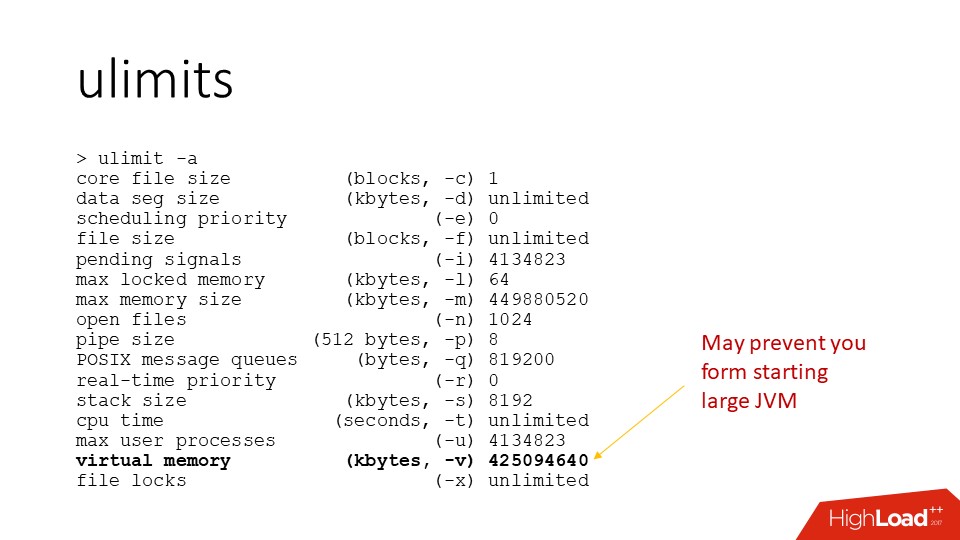
It is for managing the resources that the ulimits do not work very well - in order to limit the resource of the container, another tool is used. In ulimits there is a maximum memory size that does not work on Linux, but there is also a maximum virtual memory size. This is such an interesting thing, because, as I said, virtual memory is not a resource. In principle, from the fact that I reserve 100 TB of address space, the operating system is neither cold nor hot. But the OS most likely will not let me do this until I have become the corresponding ulimit for my process.
By default, this limit is there and may prevent your JVM from running , especially again if the size of the JVM is comparable to the physical memory, because the default value is often considered just the size of the physical memory. This causes some confusion when, for example, I have 500 GB on my server, I try to launch a 400 GB JVM, and it just crashes at the start with some kind of incomprehensible errors. Then it turns out that at the start, the JVM allocates all these address spaces to itself, and at some point the OS says: “No, you break a lot of address space, I feel sorry.” And, as I said, in this case, the JVM simply "dies." Therefore, sometimes this parameters need not forget to configure.
There are other clinical situations where, for some reason, people decide that if they have 20 GB allocated for the JVM on the server, then the size of the virtual address space should also be set to 20 GB. This is a problem, because some of the memory that the JVM reserves will never be used, and there are quite a lot of them. Thus, you are much more limited memory resources of this process than you might think.
That is, not about Docker itself, but about resource management in the container. In Docker, resource management for containers works through the cgroups mechanism. This is a kernel mechanism that allows the process tree to limit all kinds of resources, such as CPU and memory. Including memory, you can limit the size of the resident memory occupied by the entire container, the number of swap, the number of pages, etc. These limits, in contrast to the ulimits, are normal limits on the entire container; if a process forks some child processes, then they fall into the same group of resource limits.
What is important:
If it just started, it still does not mean anything, because resources are really lazy.
About threads in Java, it is important to know that they are normal threads of the operating system . Sometime in the first JVM, the so-called green threads were implemented - green threads, when in fact the java-stream stack somehow lived its own life, and one thread of the operating system executed one java-stream, then another. This all developed until normal multithreading appeared in the operating systems. After that, everyone forgot the “green” streams as a bad dream, because the code works better with native streams.
This means that the stack trace on the floor of a thousand frames really lies in the stack space allocated by the operating system. If you call some native Java code, this code will use the same stack as the java code. This means that you can use the diagnostic toolkit, which is in Linux, to work with java-streams as well.
How to find java - streams
If we use the ps command for the JVM, we will see such an incomprehensible picture, because all the threads are called the same. But in practice, there are going in turn:
but it is at random.
In fact? if you remove the thread dump from the JVM with the jstack command , there will be a hexadecimal number “TID” - this is the real Linux flow identifier . That is, you can understand which java-threads correspond to which threads of the operating system and decrypt ps.
The only thing is, if you already see how to write a perl script that will do this, do not call jstack in a loop , rather vice versa. Because every time you call jstack, you cause a global pause for all the threads of the JVM. Under normal circumstances, this is fast, less than half a millisecond, but if you do this 20 times per second, then this may already have a noticeable effect on performance.
You can also pull this information out of the JVM itself, which has its own diagnostic interface. In particular, you can use my tool , which pulls out this information from there and just prints the top by stream for the JVM . In addition to CPU usa ge, he also knows how to print the intensity of allocations of heap memory in Java streams.
Total flows
Java threads are normal operating system threads. In modern versions of the JVM, there is a
There is also a project on GitHub that allows you to export symbols for compiled java-code "on the fly", and using the same perf to get a quite readable stack of calls.
And a small reminder that we still have garbage collector threads.
On the other hand, while the garbage collector is running, all other threads do nothing. Therefore, you can allocate 100% of the container resources that you are going to allocate for Java as a garbage collector.
IO and Networking
Linux network stack needs tuning . Those who deal with front-end servers, for example, with Nginx, remember this very well, but it would be nice to do the same thing on application and back-end servers - they sometimes forget about it. And everything works fine until your system becomes geo-distributed and data transfer across the Atlantic begins. And, it turns out, it was necessary to increase the limit on buffers.
If you use UDP communication, this also requires separate configuration at the operating system level. There are options that the code itself must expose via the API on sockets, but they must be enabled at the operating system's limit level. Otherwise they simply do not work.
The second interesting point is related to the peculiarities of working with resources in the JVM .
We have a limited resource - a limit on the number of files, where sockets, etc., fall in for the process. If we have this limit exceeded, we can not:
In Java, all of these objects have methods for explicitly closing them and, accordingly, freeing Linux descriptors.
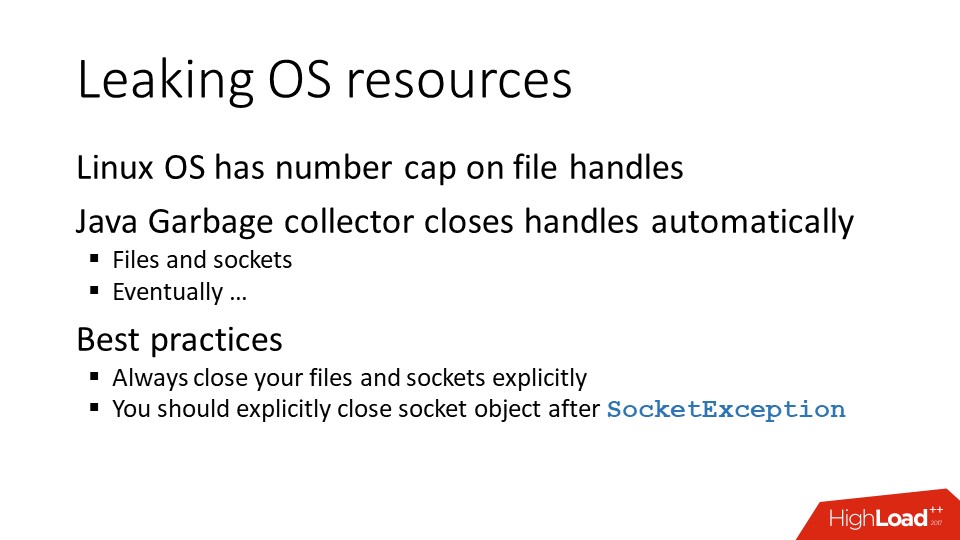
But if a lazy javist did not do this, then the garbage collector will come and still close everything for him. And everything would be fine if this garbage collector arrived on a schedule, but it comes when it sees fit. If you have a whole heap crammed with unclosed sockets, then from the heap point of view it is a penny, because there are only the metadata of this socket and the descriptor number from the operating system. Therefore, if you have such a combination of external resources that are referenced by java-code, then the garbage collector can sometimes behave not very adequately in this regard.
Even if you have an error on the socket, it’s all the same, after you catch an exception, you need to close the socket. Because from the point of view of the operating system, the fact that it returned the error code to you, and you received an exception in Java, does not mean that the socket is closed. From the point of view of the operating system, it will continue to be considered open , and the operating system will honestly be ready to return the error code again when checking the next call to it. Accordingly, if we have incorrectly configured something, and the sockets are not closed properly, after some time the limit on the files will end, and the application will become very bad.
There are a couple of resources in the JVM that cannot be explicitly released:
Therefore, we must work with them carefully, and it is advisable not to throw it away, but to reuse it. In terms of diagnostics, we have a heap dump from which all this information can be pulled out.
And, finally, last parting words.
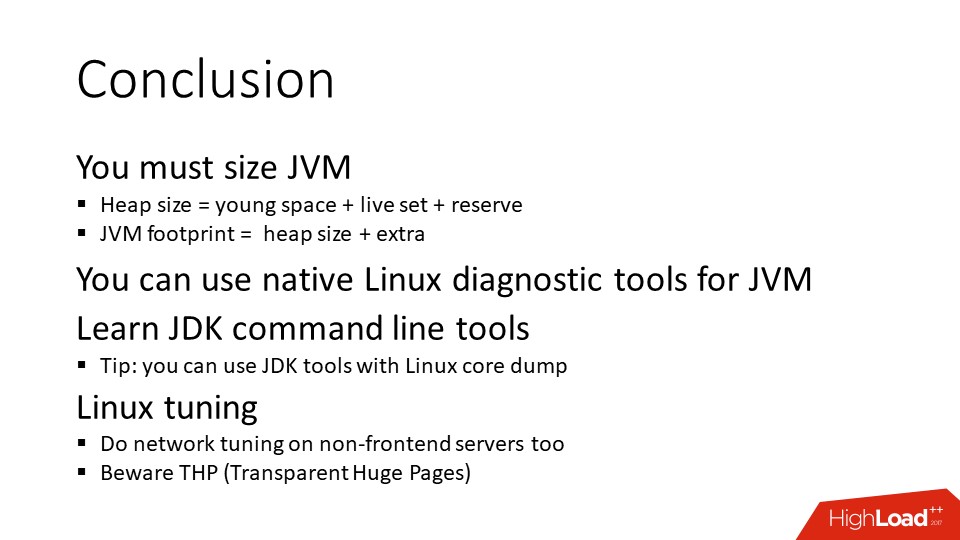
Expose the correct JVM size. The JVM itself does not know how much memory it needs to take.
Learn to use tools, in Linux there are tools that work quite well with Java, in the JDK there are tools that allow you to get a lot of information through the command line. Java has JMX (Java Management Extensions) diagnostic interface, but in order to work with it, you need another java-process, which is not always convenient.
In particular, do not forget about the combination of tools. For example, if you have a Linux core dump JVM, then you can use the JDK tools to pull the heap dump for Java out of it and see it as a normal Java analyzer instead of doing this heap dump directly from the live process.
And finally, several links to various topics.
Java Memory Tuning and Diagnostic:
Linux Transparent Huge Pages reading:
Profiling and performance monitoring:
Contacts:
If you have any questions, you can skip to the appropriate part.
report, maybe someone has already clarified.
- write code;
- debug, test;
- then packaged in a jar;
- send to linux and it works.
The fact that it works, there is no special magic. But this leads to the fact that such developers "suck up" a bit in their world of cross-platform and do not really want to understand, but how it actually works in a real operating system .
')
On the other hand, there are those who administer servers, install JVMs on their servers, send jar and war files, and from the point of view of the Linux world, all this:
- alien;
- proprietary;
- not going from source;
- supplied by some jar archives;
- "Eats away" all the memory on the server;
- in general, does not behave humanly.
The purpose of the report by Alexey Ragozin on Highload ++ , the decoding of which goes further, was to tell Java features for Linux users and, accordingly, Linux to Java developers .
The report will not be debriefing, because there are a lot of problems, they are all interesting, and the projectile twice does not get into the same funnel. Therefore, plugging the already known "holes" is a defeatist position. Instead, let's talk about:
- JVM implementation features
- Linux implementation features:
- how can they not dock.
Java has a virtual machine, and Linux, like any other modern operating system, in fact, is also a virtual machine. Both Java and Linux have memory management , threads , APIs .
Words are similar, but in fact completely different things are often hidden under them. Actually, on these points we will go through, paying the most attention to the memory.
Java memory
I’ll immediately note that I’ll only talk about the implementation of the JVM HotSpot, this is the Open JDK and Oracle JDK. That is, for sure IBM J9 has some features of its own, but unfortunately I don’t know about them. If we are talking about HotSpot JVM, then the picture of the world is as follows. First of all, in Java there is an area where java-objects live - the so-called Heap or, in Russian, a bunch of where the garbage collector works. This memory area usually takes up most of the process space. The heap is in turn divided into a young and old space (Young Gen / Old Gen). Without going into the JVM Siding Derby, the important thing is that the JVM has a “-Xmx” parameter that defines the maximum size to which the heap space can grow.
And then there are many options:
- you can control the size of the young space separately;
- you can immediately set the maximum heap size;
- or allow it to grow gradually.
There are too many details - it is important that there is a limit. And, in principle, this is a general approach to all areas that use the JVM. That is, almost all areas listed in the picture above have a certain limit. The JVM immediately reserves the address space , based on the limit, and then as necessary, asks for real memory resources in this range. It is important to understand.
In addition to the heap, there are other memory consumers. The most important of these are the memory areas for the stacks of threads. Threads in Java are regular linux threads, they have a stack for which a certain amount of memory is reserved. The more threads you have, the more stacks are allocated in the process memory. Since the number of threads in Java can be measured in hundreds and thousands, sometimes this figure can become quite significant, especially if you have some kind of stateless microservice, in which a heap of 200 MB and a ThreadPool of 50-100 threads.
In addition, there are still so-called NIO Direct Buffers - these are special objects in Java that allow you to work with memory outside the heap . They are usually used to work with I / O, because it is a memory that can be directly accessed by both C and Java code. Accordingly, this area is accessible through the API, and it also has a maximum limit.
The rest is metadata, some kind of generated code, the memory for them usually does not grow to large values, but it exists.
In addition to these special areas, we must not forget that the JVM is written in C ++, respectively, there is
- malloc and normal memory allocation;
- libraries that are loaded into the JVM (statically or dynamically linked, which can also use memory).
And this memory is not classified according to our scheme, but is simply a memory allocated by standard C Runtime tools. C, too, sometimes there are problems, and on a fairly level ground.
For example, here we have java code distributed in the jar form. Jar is a zip-archive, zlib library is used to work with it. In order to unzip something, zlib must allocate a buffer that will be used for decompression and, of course, it requires memory. All anything, but now there is a fashion for the so-called uber-jar, when one hefty jar is created, and there are nuances.
When attempting to start from such a jar file, too many zlib threads are opened at the same time for unpacking. And from the point of view of Java, everything is fine: the heap is small, all areas are small, but the memory consumption of the process is growing. This is, of course, a “clinical” case, but such needs of the JVM must be taken into account. For example, if you set -Xmx to 1 GB, put Java in the Docker container and set the memory limit on the container to 1 GB too, then the JVM will not fit in it . We still need to throw a little bit, but how much exactly - depends on many factors, including the number of threads and exactly what your code does.
So this is how the JVM works with memory.
Now, so to speak, for another part of the audience.
Linux Memory
There is no garbage collector in Linux. His work in terms of memory is completely different. He has a physical memory that is paginated ; There are processes that have their own address space . It needs the resources of this memory in the form of pages to be somehow divided between processes, so that they work in their virtual address space and do their work.
The page size is usually 4 kilobytes. In fact, this is not the case; in x86 architecture, there is support for large pages for a very long time. In Linux, it appeared relatively recently, and with it a little bit incomprehensible situation. When support for large pages (Transparent Huge Tables) appeared in Linux, many people stepped on the rake related to performance degradation due to some of the nuances of serving large pages in Linux. And soon the Internet was filled with recommendations to turn them off out of harm's way. After that, some bugs related to the work of large pages in Linux were repaired, but the sediment remained.
But at the moment there is no clear understanding, for example, from which version support for large pages can be enabled by default and do not worry.
So be careful. If suddenly on your Linux server suddenly out of the blue will increase the consumption of resources by the kernel, then the problem may be that you have large pages included, and now they are included by default in most distributions.
So from the kernel’s point of view, Linux has many pages to manage. From a process point of view, there is an address space in which it reserves address ranges. The reserved address space is nothing, not a resource, there is nothing in it . If you contact this address, you will receive a segfault, because there is nothing there.
In order for a page to appear in the address space, a slightly different syscall is needed, and then the process says to the operating system: "I need 1 GB of memory in these addresses." But even in this case, the memory appears there, too, not immediately and with his tricks.
From the point of view of the kernel, the classification of pages looks like this, there are pages:
a) private , that is, it means that they belong to one process and are available in the address space of only one process;
b) anonymous - this is ordinary memory, not bound in files;
c) memory mapped files - mapping files to memory;
d) shared , which may be either:
- Copy-On-Write , that is, when a process is branching out, the memory becomes available to both processes until it is written and the pages become private;
- through the Shared file, i.e., if several processes map the same file into memory, then the pages can be shared.
In general, from the point of view of the operating system kernel, everything is quite simple.
Simple, but not quite.
When we want to understand what is happening on the server in terms of memory, we go to the top and see some numbers there. In particular, there is used memory and free memory . There are different opinions about how much free memory should be on the server. Someone thinks that this is 5%, but, in fact, 0% of physical memory is also the norm , because what we see as a free memory counter is not really all free memory. It is actually much more, but it is usually hidden in the page cache.
In terms of the process, top shows three interesting columns:
- virtual memory ;
- resident memory ;
- shared memory .
The last memory in the list is just those pages that are shared. But with resident memory, everything is a little trickier. Let us dwell in more detail on these metrics.
As I have already said, used and free memory are quite useless metrics. The server still has memory, which has never been used, because the operating system has a file cache , and all modern OSs use all free memory for it, since the file cache page can always be cleared and used for more important tasks. Therefore, all free memory gradually goes to the cache and does not come back .
The virtual memory metric is not a resource at all in terms of the operating system. You can easily allocate 100 terabytes of address space, that's all. We have done this and can be proud that space from the address X to the address Y is reserved, but no more. Therefore, to look at it as a resource and, for example, to set an alert that the virtual size of the process has exceeded a certain threshold, rather pointless.
Back to Java, it reserves all of its special areas in advance, because the JVM code expects these areas to be contiguous in terms of address space. So the address must be staked in advance. In this regard, by starting the process with a 256 MB heap, you can suddenly see that it has more than two gigabytes of virtual size. Not because these gigabytes are needed and that the JVM is capable of ever recycling them, but simply defaulting. From him neither cold nor hot, at least so thought those who wrote the JVM. This, however, does not always correspond to the opinion of those who then engaged in server support.
Residence size - the metric closest to reality - is the number of memory pages used by a process that is in memory, not in a swap. But it is also a little peculiar.
Cache
Returning to the cache. As I said, the cache is, in principle, free memory , but sometimes there are exceptions. Because the pages in the cache are clean and dirty (containing not saved changes). If the page in the cache is modified, then before it can be used for another purpose, it must first be written to disk. And this is another story. For example, the JVM writes a big-big heap dump. She does it slowly, the process is as follows:
- JVM quickly writes in memory;
- the operating system gives it all the free memory that it has, under write behind cache, all this memory is “dirty”;
- There is a slow write to the disk.
If the size of this dump is comparable to the size of the server's physical memory, a situation may arise that there will simply not be free memory for all other processes.
That is, we, for example, open a new ssh session - to start the shell process, you need to allocate memory. The process follows memory, and the core tells him: “Wait, please, now I will find something.” Finds, but before it manages to give this page to SSHD, Java manages to “blot out” a few more pages, because it also “hangs” in Page Fault and, as soon as a free page appears, it quickly manages to grab this memory sooner than what other processes. In practice, such a situation led, for example, to the fact that the monitoring system simply decided that this server was not “live” once it was impossible to access it via ssh. But this, of course, an extreme case.
Another process in Linux, in addition to virtual size and resident size, has a committed size — this is the memory that the process is actually going to use, that is, the address space, when accessing which you do not get a segfault, and when accessing which, the kernel must provide you with a physical memory page. .
In an ideal situation, committed and re sident should have been the same . But, first, the pages can "swap."
Secondly, Linux memory is always lazy.
- You say to him: "Give me, please, 10 GB." He says: "Take it please."
- Another process: “Give me 10 GB too” - “Take it please”.
- The third process: “Give me 10 GB too” - “Take it please”.
Then it turns out that there are only 16 physical memories, and he distributed everything to 10. And it starts “who took the first one, that and slippers, and who was not lucky, OMKiller will come after that”. These are Linux memory management features.
JVM Important Facts
First, the JVM really dislikes swapping . If I complain that the java-application for some reason slows down, then the first thing that I do is look at whether there is a swap on the server. Because there are two factors that make Java very intolerant to swapping:
- Garbage collection in Java constantly runs through the pages, and if it “misses” past the resident pages, it causes page shifting from disk to memory and back.
- If the JVM has at least one stream “stepped on” a page that does not exist in memory, then this can freeze all the threads of this JVM.
There is a safe-point mechanism that is used in JVM for all black magic like recompiling code on the fly, garbage collection, and so on. If one thread hit the Page Fault and waits, then the JVM cannot normally enter the safe-point state, because it does not receive confirmation from the stream that is waiting for the memory page to “arrive”. And all the other streams have already stopped and are also waiting. All stand, waiting for this one unfortunate stream. Therefore, as soon as your paging starts, a very significant degradation of performance can begin.
Second, Java never gives away memory to the operating system . She will use as much as you have allowed, even if she doesn’t really need these resources now, she will not give them back. There are garbage collectors who are technically able to do this, but do not expect that they will do it.
The garbage collector has this logic: it either uses more
CPU, or more memory. If you allowed him to use 10 GB, then he reasonably assumes that you can save CPU resources, and wait 10 GB with garbage, while the CPU is doing something useful, instead of cleaning the memory, which does not go beyond the limit.
In this regard, it is important to correctly and reasonably set the size of the JVM . And if you have several processes within the same container, it is reasonable to allocate memory resources between them.
Otherwise, everything that is in this container will suffer.
When memory runs out
This is another of those situations that are perceived very differently by “javistami” and “linuxoids”.
In Java, this happens as follows: there is a new operator that allocates an object (on the slide this is a large array), if there is not enough space on the heap to allocate memory for this large array, we get Out of Memory error.
Linux is different. As we remember, Linux can easily promise more memory than it actually is, and you start working with it (the above conditional code). And unlike JVM, you will receive not an error, but the crash of the process chosen by OMKiller or the death of the entire container if it is a question of exceeding the cgroups quota.
When memory runs out in JVM
Now, we will understand a little more. In Java, we have a so-called area of young objects and an area of old ones. When we call the new operator, an object is allocated in the space of young objects. If the space in the space of young objects is over, either young or complete garbage collection occurs , if the young assembly is not enough. The bottom line is that, firstly, if we do not have enough memory, garbage collection occurs. And before the Out of Memory error occurs, at least one complete build will take place, i.e. Such a slow through all our ten-gigabyte heap. In some cases, it will also be in one thread, because full GC is a special case.
At the same time, the garbage collector will probably scrap something. But if this is anything less than 5% of the heap size , an error will still be thrown out, because this is already “not life, but sheer torture”. But if this Out of Memory error occurs in a stream, the author of the code of which decided that his stream should work, regardless of any errors, he can prolong this agony by intercepting exceptions.
In general, after shooting Out of Memory error, the JVM can no longer be considered alive. The internal state may already be destroyed, and there is such an option (
-XX:OnOutOfMemoryError="kill -9 %p" ), which allows you to immediately kill this process. Again, there are nuances. If your JVM size is comparable to the size of physical memory of a box, then when you call this command, you will have a fork, which. will cause the JVM image to be duplicated. Accordingly, from the point of view of Linux, the memory for the JVM may slightly exceed the limit of the maximum memory that it is ready to allocate and this command will not work. Such a problem is typical for Hadoop servers, for example, when a large node tries to start Python through the shell. Naturally, this child process does not need as much memory, just fork makes a copy of everything, and only then frees unnecessary memory. Only “later” does not always occur.There may be another situation, it is possible that the heap is not yet the maximum size (less than -Xmx), but the garbage collection did not collect enough memory, and the JVM decided that it was necessary to increase the heap . Went to the operating system, says: "give me more memory," and the OS says: "no." True, as I said, Linux does not say that, but other systems say so. Any error in allocating the operating system memory from the point of view of the JVM is a crash, no questions, no exceptions, no logs, just a standard crash dump, and the process is terminated immediately.
There is also a second type of Out of Memory, which is associated with the so-called direct memory buffers. These are special objects in Java that reference off-heap memory. Accordingly, they also allocate it, manage the life cycle of this memory, that is, there is still a certain collection of garbage there. To prevent such buffers from taking up an infinitely large amount of memory, they have a limit that the JVM exposes to itself. Sometimes it becomes necessary to correct it, for which, naturally, there is a magic -XX option, for example,
-XX:MaxDirectMemorySize=16g . Unlike the normal Out of Memory, this Out of Memory is recoverable, because it occurs in a certain place and can be distinguished from another type of error.Allocate memory in java
As I said, the JVM at the start is important to know how much you allow it to use memory, because based on this, all the garbage collector heuristics are built.
How much to allocate memory "in grams" is a difficult question, but here are the main points:
- You must understand how many useful objects must be permanently in memory ( Live set ). It is more correct to measure empirically, that is, it is necessary:
- produce tests;
- do heap dump;
- see what the heap is made of and how it will grow as the number of requests or the amount of data increases.
- The younger generation is either taken as a default as a percentage of the heap, or is dynamically set. For example, the feature of the G1 collector is that he himself is able to correctly choose the size of the young space. For the rest of the garbage collectors, it is better to place them in the hands, again on the basis of empirical considerations.
- The garbage collector necessarily needs a reserve , because in order to collect garbage, it must be somewhere in memory. The more memory you have for garbage, the less CPU will be spent on 1 GB of free memory. This balance can never "unscrew to zero." The size of the reserve depends on the characteristics of your application and the garbage collector used, as a rule, it is 30-50%.
- Total, the total size of your heap (-Xmx) consists of:
- the size of a young generation;
- live set size;
- reserve.
- the size of a young generation;
In addition to the heap, there are also direct buffers, some kind of reserve of the JVM, which must also be determined empirically.
Thus, the footprint of the process as a whole will always be more than -Xmx, and this is not just a percentage, but a combination of various factors like the number of threads.
Allocate memory in linux
Moving on, in Linux there is such a thing as ulimit - this is such a strange construction, in my opinion, javista. For a process, there is a set of quotas that the operating system specifies. There are different quotas for the number of open files, which is logical, and for some other things.
It is for managing the resources that the ulimits do not work very well - in order to limit the resource of the container, another tool is used. In ulimits there is a maximum memory size that does not work on Linux, but there is also a maximum virtual memory size. This is such an interesting thing, because, as I said, virtual memory is not a resource. In principle, from the fact that I reserve 100 TB of address space, the operating system is neither cold nor hot. But the OS most likely will not let me do this until I have become the corresponding ulimit for my process.
By default, this limit is there and may prevent your JVM from running , especially again if the size of the JVM is comparable to the physical memory, because the default value is often considered just the size of the physical memory. This causes some confusion when, for example, I have 500 GB on my server, I try to launch a 400 GB JVM, and it just crashes at the start with some kind of incomprehensible errors. Then it turns out that at the start, the JVM allocates all these address spaces to itself, and at some point the OS says: “No, you break a lot of address space, I feel sorry.” And, as I said, in this case, the JVM simply "dies." Therefore, sometimes this parameters need not forget to configure.
There are other clinical situations where, for some reason, people decide that if they have 20 GB allocated for the JVM on the server, then the size of the virtual address space should also be set to 20 GB. This is a problem, because some of the memory that the JVM reserves will never be used, and there are quite a lot of them. Thus, you are much more limited memory resources of this process than you might think.
Therefore, I appeal to linuksoidam, please do not do so, have pity on your javista.
A few words about Docker
That is, not about Docker itself, but about resource management in the container. In Docker, resource management for containers works through the cgroups mechanism. This is a kernel mechanism that allows the process tree to limit all kinds of resources, such as CPU and memory. Including memory, you can limit the size of the resident memory occupied by the entire container, the number of swap, the number of pages, etc. These limits, in contrast to the ulimits, are normal limits on the entire container; if a process forks some child processes, then they fall into the same group of resource limits.
What is important:
- If you run Java in the docker container, it looks at how much physical memory is on the host, and based on how much physical memory is actually on the host, and not in the container, it considers the default constraints. And she dies very quickly, because she is not given so much. Therefore -Xmx is necessary - without this, it will not take off.
- Always under the container you need to give a little more memory than under the JVM . Suppose you make a 2 GB container, start the JVM with the
-Xmx2048mparameter, it somehow starts to work, because the memory is allocated lazily. But little by little, all these pages somehow start to be used, and at first your container starts to go to a local swap, and then just dies. And he dies in the best traditions - just disappears .
If it just started, it still does not mean anything, because resources are really lazy.
Streams in java
About threads in Java, it is important to know that they are normal threads of the operating system . Sometime in the first JVM, the so-called green threads were implemented - green threads, when in fact the java-stream stack somehow lived its own life, and one thread of the operating system executed one java-stream, then another. This all developed until normal multithreading appeared in the operating systems. After that, everyone forgot the “green” streams as a bad dream, because the code works better with native streams.
This means that the stack trace on the floor of a thousand frames really lies in the stack space allocated by the operating system. If you call some native Java code, this code will use the same stack as the java code. This means that you can use the diagnostic toolkit, which is in Linux, to work with java-streams as well.
How to find java - streams
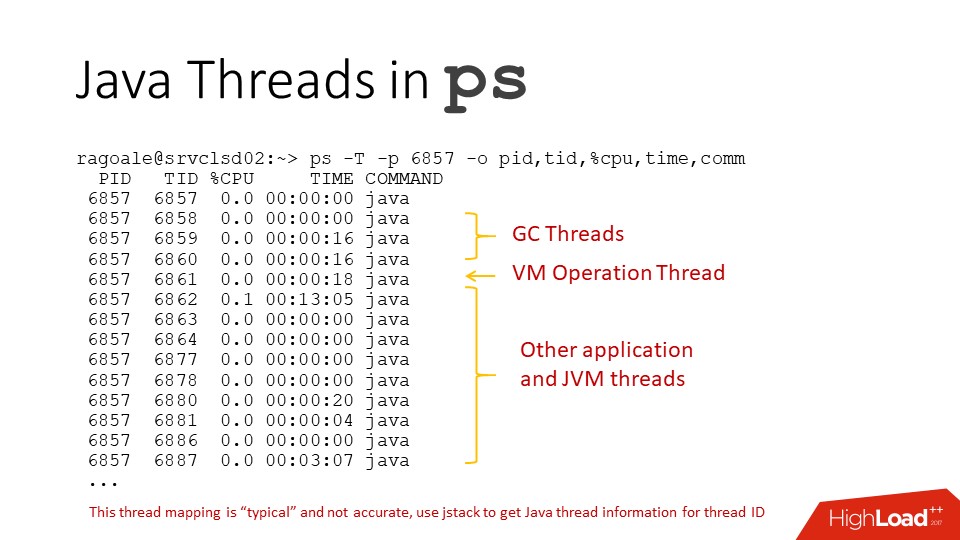
If we use the ps command for the JVM, we will see such an incomprehensible picture, because all the threads are called the same. But in practice, there are going in turn:
- garbage collector streams;
- the so-called operational thread JVM;
- application flows
but it is at random.
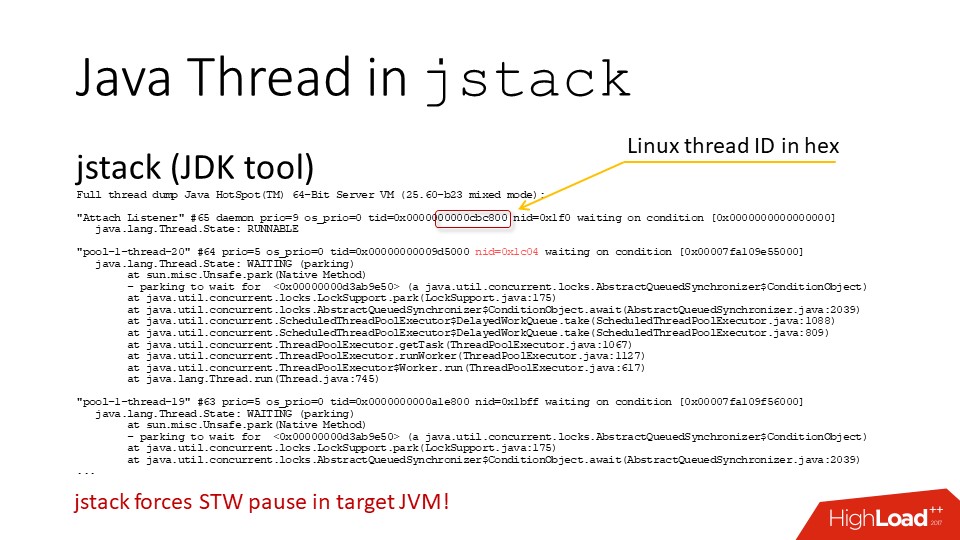
In fact? if you remove the thread dump from the JVM with the jstack command , there will be a hexadecimal number “TID” - this is the real Linux flow identifier . That is, you can understand which java-threads correspond to which threads of the operating system and decrypt ps.
The only thing is, if you already see how to write a perl script that will do this, do not call jstack in a loop , rather vice versa. Because every time you call jstack, you cause a global pause for all the threads of the JVM. Under normal circumstances, this is fast, less than half a millisecond, but if you do this 20 times per second, then this may already have a noticeable effect on performance.
You can also pull this information out of the JVM itself, which has its own diagnostic interface. In particular, you can use my tool , which pulls out this information from there and just prints the top by stream for the JVM . In addition to CPU usa ge, he also knows how to print the intensity of allocations of heap memory in Java streams.
Total flows
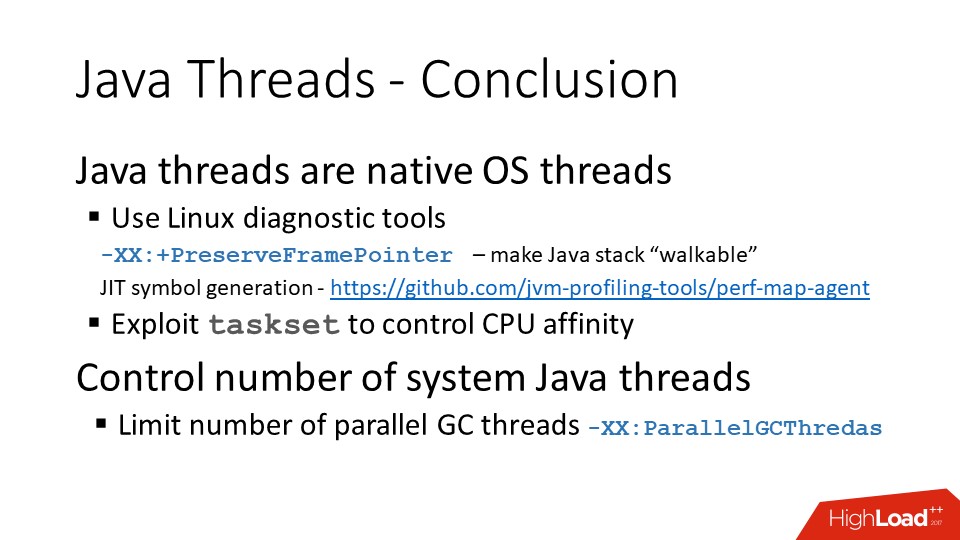
Java threads are normal operating system threads. In modern versions of the JVM, there is a
PreserveFramePointer key, which is a JIT compiler option that allows perf-type tools to correctly parse the stack of Java threads.There is also a project on GitHub that allows you to export symbols for compiled java-code "on the fly", and using the same perf to get a quite readable stack of calls.
And a small reminder that we still have garbage collector threads.
If you have a container in which you have allocated two CPUs, then the number of parallel threads of the garbage collector should also be made two, because by default there will be more of them, and they will only interfere with each other.
On the other hand, while the garbage collector is running, all other threads do nothing. Therefore, you can allocate 100% of the container resources that you are going to allocate for Java as a garbage collector.
IO and Networking
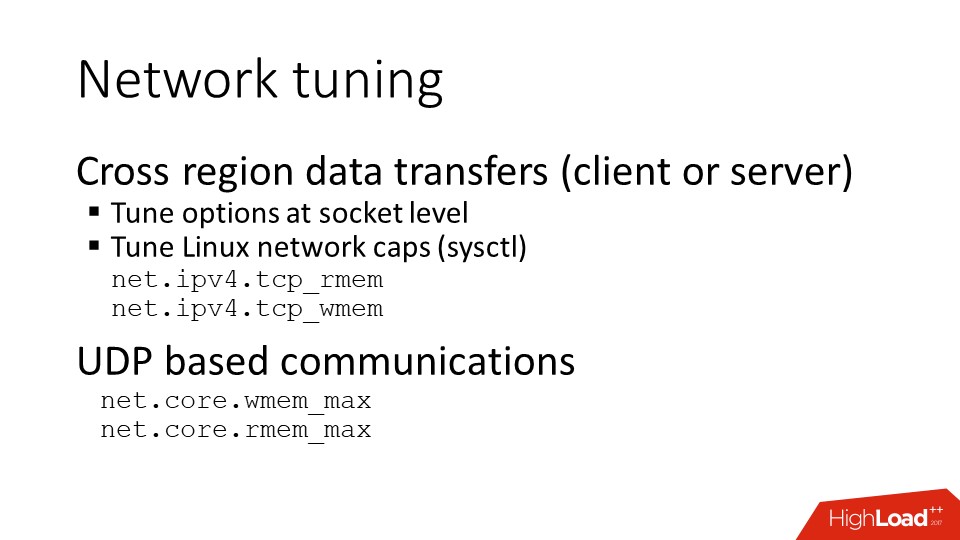
Linux network stack needs tuning . Those who deal with front-end servers, for example, with Nginx, remember this very well, but it would be nice to do the same thing on application and back-end servers - they sometimes forget about it. And everything works fine until your system becomes geo-distributed and data transfer across the Atlantic begins. And, it turns out, it was necessary to increase the limit on buffers.
If you use UDP communication, this also requires separate configuration at the operating system level. There are options that the code itself must expose via the API on sockets, but they must be enabled at the operating system's limit level. Otherwise they simply do not work.
The second interesting point is related to the peculiarities of working with resources in the JVM .
We have a limited resource - a limit on the number of files, where sockets, etc., fall in for the process. If we have this limit exceeded, we can not:
- open connection;
- open files;
- accept connections, etc.
In Java, all of these objects have methods for explicitly closing them and, accordingly, freeing Linux descriptors.
But if a lazy javist did not do this, then the garbage collector will come and still close everything for him. And everything would be fine if this garbage collector arrived on a schedule, but it comes when it sees fit. If you have a whole heap crammed with unclosed sockets, then from the heap point of view it is a penny, because there are only the metadata of this socket and the descriptor number from the operating system. Therefore, if you have such a combination of external resources that are referenced by java-code, then the garbage collector can sometimes behave not very adequately in this regard.
Connections and files should always be closed by hand.
Even if you have an error on the socket, it’s all the same, after you catch an exception, you need to close the socket. Because from the point of view of the operating system, the fact that it returned the error code to you, and you received an exception in Java, does not mean that the socket is closed. From the point of view of the operating system, it will continue to be considered open , and the operating system will honestly be ready to return the error code again when checking the next call to it. Accordingly, if we have incorrectly configured something, and the sockets are not closed properly, after some time the limit on the files will end, and the application will become very bad.
There are a couple of resources in the JVM that cannot be explicitly released:
- memory map files;
- NIO direct buffers.
Therefore, we must work with them carefully, and it is advisable not to throw it away, but to reuse it. In terms of diagnostics, we have a heap dump from which all this information can be pulled out.
And, finally, last parting words.
Expose the correct JVM size. The JVM itself does not know how much memory it needs to take.
Learn to use tools, in Linux there are tools that work quite well with Java, in the JDK there are tools that allow you to get a lot of information through the command line. Java has JMX (Java Management Extensions) diagnostic interface, but in order to work with it, you need another java-process, which is not always convenient.
In particular, do not forget about the combination of tools. For example, if you have a Linux core dump JVM, then you can use the JDK tools to pull the heap dump for Java out of it and see it as a normal Java analyzer instead of doing this heap dump directly from the live process.
And finally, several links to various topics.
Java Memory Tuning and Diagnostic:
- http://blog.ragozin.info/2016/10/hotspot-jvm-garbage-collection-options.html
- https://docs.oracle.com/javase/8/docs/technotes/guides/troubleshoot/tooldescr007.html
- Using JDK tools with Linux core dumps
https://docs.oracle.com/javase/8/docs/technotes/guides/troubleshoot/bugreports004.html#CHDHDCJD
Linux Transparent Huge Pages reading:
- https://www.perforce.com/blog/tales-field-taming-transparent-huge-pages-linux
- https://tobert.imtqy.com/tldr/cassandra-java-huge-pages.html
- https://alexandrnikitin.imtqy.com/blog/transparent-hugepages-measuring-the-performance-impact/
Profiling and performance monitoring:
Contacts:
If you have any questions, you can skip to the appropriate part.
report, maybe someone has already clarified.
Short epilogue
RIT ++ is already on May 28 and 29, the schedule is here, and this is a direct link to purchase tickets.
Before Highload ++ Siberia a little more time, it will take place on June 25 and 26. But the program is already being actively formed, you can subscribe to the newsletter and be aware of updates.
Source: https://habr.com/ru/post/358520/
All Articles