Applying trigonometry rules to create high-quality animation.
The author of the material, the translation of which we are publishing today, Nash Vale, says that he was recently engaged in research on landing pages. During the work, he came across one site. It was a great, useful resource. However, in the course of working with him, Nash noticed something unpleasant.
 Unnatural animation
When he saw how unnaturally the circles were moving, on the basis of which the animation was created, he decided to write this article. In particular, here he will talk about how to create a much more attractive version of this animation, using basic concepts of trigonometry. He says that, in fact, in order to make high-quality animation, you need surprisingly little code. In addition, this article is intended for a wide range of readers, even for those who do not understand mathematics and trigonometry. Here everything is revealed that is necessary in order to proceed to the conscious use of the principles of trigonometry in web animation.
As a matter of fact, this is what the boot animation looks like, to the creation of which this material is dedicated.
')
Smooth animation
The boot animation we are going to create consists of three circles, periodically moving up and down. In this case, due to the fact that each of them moves in its own way, it turns out a smooth wavy animation.
Let us analyze this animation in all details, starting with a consideration of how to make a separate circle make smooth periodic moves up and down. As we move through the material, we will delve into the details of what is happening.

This code allows you to draw a circle in the center of the

Circle in the center of the area for displaying graphic elements
Let us deal with what is happening here by comparing the code and its graphical representation.
So, the

The width and height of the SVG-rectangle
By default, SVG elements use the traditional coordinate system, which origin is in the upper left corner. In such a coordinate system, the values along the X and Y axes increase as you move along it to the right and down. In addition, each point in this coordinate system corresponds to one pixel. As a result, for example, the four corners of a rectangle have coordinates depending on the width and height given to it.

The coordinates of the corners of the SVG-rectangle
The next step, which is to place the circle in the center of the field, involves the use of mathematical principles that are learned in elementary school. Namely, the coordinates of the center of the figure are the result of dividing the width and height of the field by 2 (

Finding the center of the figure
Now our task is to organize the movement of the circle. However, we are not satisfied with some arbitrary movement. We need the circle to make periodic movements up and down.

The pattern of movement of the figure
Periodicity is a phenomenon that occurs at regular intervals. The simplest example of periodicity is the daily sunrise and sunset. Frequency is also peculiar to our time frame. Say, if it is 6:30 pm now, then after 24 hours it will again be 6:30 pm, and after another 24 hours - again 6:30 pm. In this case, before us is something regular, occurring at an interval of exactly 24 hours.
Suppose it is now noon, and the sun is at its highest point above the horizon. After 24 hours, it will come to this point again. Or, it is evening now, and the sun is low over the horizon, touching it, ready to disappear behind it. After 24 hours we will be able to observe the same picture. The cyclical movements of the sun are shown in the following figure.

Sunrise and Sunset Cycle
This is a very simple illustration of what is happening with the sun, one can even say that from a scientific point of view this view is wrong, but this picture helps to illustrate what we are interested in now, namely that the sun makes periodic movements.
If you draw a graph showing the change in the vertical position of the sun over time, then the frequency of what is happening becomes even more obvious.
In order to build a two-dimensional curve, we need two coordinates -

The cycle of sunrise and sunset, presented in the form of a graph
The vertical axis, or
Now, after we have studied the graph of the behavior of the sun, we can find out its position in the sky, even if we do not see the sky, for example, being in a cave where the sunlight does not penetrate. In order to do this, let's name our graphic, for example,
Now, mathematically speaking, it is enough for us to transfer the value of time to the function, and it will give us the position of the sun. Here's what it looks like.

Finding out the position of the sun using the graph function
Here we select the time point (
Probably, we have already taken from this example all that is possible, so leave the sun alone and move on to the usual charts. Here is how it all looks.

Periodic curve
This graph is a universal representation of a certain periodic process. The value (what was the vertical position of the sun in our example) repeats as another value changes (in our example these second value was time).
There are quite a few periodic functions in mathematics, we will focus on the simplest, widely known function, which we will use to create flawless animation. This is a sinusoidal function, described by the formula

Sine curve
Doesn't this remind you of anything? For example - the graph that we built, based on an analysis of the behavior of the sun?
We can substitute the
Perhaps now you are concerned about the question of what is a " sinusoidal function ." In fact, “sine” is nothing more than the name given to some function, just as we, in our experiment, gave the name of the function
In the equation
In addition, it is worth paying attention to the fact that the maximum value reached by
This is only a feature of the sinusoidal function. The values
This range, by the way, is easy to change. That is what we will soon do. However, first, let's gather everything that we have already dealt with and make it so that the circle in the SVG element starts moving.
So, inside the element
In this code, we get a reference to the circle and store it in the variable
The most important thing to know about the
Consider these provisions in practice by analyzing the following code fragment.
Here, in comparison with the previous fragment, 4 new lines are added. If you run this code, you can see slow periodic circle oscillations around the center point.

Circle movements
That's what's going on here. After we have the coordinates of the center of the circle,
And, secondly, we will periodically add the same numbers to

Changing the y coordinate of the circle center
The
The variable
The

Then we add what we got to

As we already know, the function

Vertical movement of the shape specified in the code
Now we would like to expand the range of movement of the circle. That is, it is necessary that it deviates vertically from the original value by a distance greater than 1 pixel. How to do it? Maybe we need a new feature? Fortunately, we already have everything we need.
Recall that at the end of section 2.1. it was about the features of the sinusoidal function. In order to expand the range of movement of the figure, you need to multiply what the
The operation of multiplying a function by a constant is called scaling. Notice how the shape of the graph has changed, and how the multiplication affected the maximum and minimum values of the function.

Scaling graphics
Now, after we figured it out, make changes to the code.
But how will the circle behave now.

Circle movements
As a result, you can see how the circle smoothly moves up and down. Well done, right?
We have just increased the amplitude of the sinusoidal function by multiplying it by a number. Now we want to add two more circles to our animation, one before the one that already exists, the second after it, and make them move in the same way as the original circle. In the code, the description of the new figures looks like this:
We made some changes to the code and organized it in a new way. For starters, notice the two lines in bold. They describe two new circles, one placed 30 pixels (
Earlier, we assigned a single circle identifier
If we now run our code, as a result we can see the following.

Three circles
So far, so good, but new circles are still. Fix it.
Several lines of code have been added here, where, first, we get links to new objects, and second, we apply the same animation rules to them as to the original ones. That's what it all gave us.

Animated circles
Now move and new circles. However, all this is not yet similar to the animation that we are striving to create.
Although the circles move periodically, the problem is that their movements are synchronized. And this is not what we need. We need each of the following laps to start moving with some delay. As a result, it will look as if a circle located to the right of the other follows it. For example, as shown below.

Animated circles
You noticed that the circles are now not moving synchronously, those that are located to the right of others, as if they are catching up. If you close, for example, two circles of three with your hand, you will notice that the visible circle performs exactly the same movements as when we were working with a single figure.
Now, in order to achieve the desired effect, we need to make very small changes to the code. However, understanding what these changes are and how they influence the result is very important. So let's deal with them.
If we represent the movement of circles as graphs of the dependence of their coordinates

Graphs of coordinates of figures depending on time
There is nothing surprising in these charts, as we know that all circles move in the same way. It is also clear that since we use a sinusoidal function to animate figures, all the graphs presented here are graphs of this function. Now, to disrupt the synchronization of these graphs, we need to understand the mathematical concept of shift / transfer graphs.
Shift is a parallel transfer of a graph that does not change the shape or size of the graph of a function. It only changes its location. Shift can be horizontal or vertical. In this case, we are interested in horizontal shifts in graphs. Notice how changing the value of

Transfer function graph (Desmos)
In order to understand how this works, let us return to the example with the sun. So, in that example, we used the
Now consider a function of the form
Take a closer look at her. If you pass some time stamp

Comparison of functions taking t and t-3
As a result, at
In other words, we moved the function graph to the right along the
Take a look at the following drawing. The old function at

Old schedule and shifted schedule
Similarly, if we add, rather than subtract 3, by getting the function
Knowing all that we have just dismantled, we can move the graphs that control the animation of the last two circles, bringing them to the following form.

Shift of graphs of the functions that define the animation of circles
In order to express this in code, you will need to make the following small change.
That's all! We moved the graphics responsible for the animation of the

Finished animation
As you can see, now the animation looks quite decent, the movements of objects are calculated with absolute mathematical precision. Of course, this simple example is quite amenable to improvement, but it provides a basis on which to build high-quality animation. To better understand how individual animation parameters affect the final result, experiment with the value of
Dear readers! How do you develop animations for your projects?

When he saw how unnaturally the circles were moving, on the basis of which the animation was created, he decided to write this article. In particular, here he will talk about how to create a much more attractive version of this animation, using basic concepts of trigonometry. He says that, in fact, in order to make high-quality animation, you need surprisingly little code. In addition, this article is intended for a wide range of readers, even for those who do not understand mathematics and trigonometry. Here everything is revealed that is necessary in order to proceed to the conscious use of the principles of trigonometry in web animation.
As a matter of fact, this is what the boot animation looks like, to the creation of which this material is dedicated.
')
Smooth animation
1. Positioning the circle
The boot animation we are going to create consists of three circles, periodically moving up and down. In this case, due to the fact that each of them moves in its own way, it turns out a smooth wavy animation.
Let us analyze this animation in all details, starting with a consideration of how to make a separate circle make smooth periodic moves up and down. As we move through the material, we will delve into the details of what is happening.
This code allows you to draw a circle in the center of the
<svg> element. The following figure shows such a circle, even more like a ball. It should be noted that its appearance does not correspond to the above code, but we are not interested in external effects, but in the fact that there is a circle in the center of some area intended for displaying graphic elements.Circle in the center of the area for displaying graphic elements
Let us deal with what is happening here by comparing the code and its graphical representation.
So, the
width and height properties specified in the code represent, respectively, the width and height of a rectangular SVG element.The width and height of the SVG-rectangle
By default, SVG elements use the traditional coordinate system, which origin is in the upper left corner. In such a coordinate system, the values along the X and Y axes increase as you move along it to the right and down. In addition, each point in this coordinate system corresponds to one pixel. As a result, for example, the four corners of a rectangle have coordinates depending on the width and height given to it.
The coordinates of the corners of the SVG-rectangle
The next step, which is to place the circle in the center of the field, involves the use of mathematical principles that are learned in elementary school. Namely, the coordinates of the center of the figure are the result of dividing the width and height of the field by 2 (
width/2 , height/2 ), which gives us (150, 75). We assign these values to the cx and cy properties, which makes it possible to place a circle in the center of the field.Finding the center of the figure
2. Moving a circle
Now our task is to organize the movement of the circle. However, we are not satisfied with some arbitrary movement. We need the circle to make periodic movements up and down.
The pattern of movement of the figure
▍2.1. Mathematical Principles of Periodic Motion
Periodicity is a phenomenon that occurs at regular intervals. The simplest example of periodicity is the daily sunrise and sunset. Frequency is also peculiar to our time frame. Say, if it is 6:30 pm now, then after 24 hours it will again be 6:30 pm, and after another 24 hours - again 6:30 pm. In this case, before us is something regular, occurring at an interval of exactly 24 hours.
Suppose it is now noon, and the sun is at its highest point above the horizon. After 24 hours, it will come to this point again. Or, it is evening now, and the sun is low over the horizon, touching it, ready to disappear behind it. After 24 hours we will be able to observe the same picture. The cyclical movements of the sun are shown in the following figure.
Sunrise and Sunset Cycle
This is a very simple illustration of what is happening with the sun, one can even say that from a scientific point of view this view is wrong, but this picture helps to illustrate what we are interested in now, namely that the sun makes periodic movements.
If you draw a graph showing the change in the vertical position of the sun over time, then the frequency of what is happening becomes even more obvious.
In order to build a two-dimensional curve, we need two coordinates -
x and y . In our case, this is the time coordinate representing the time of day, and the positionOfTheSun coordinate corresponding to the position of the sun.The cycle of sunrise and sunset, presented in the form of a graph
The vertical axis, or
Y axis, is the vertical position of the sun in the sky, and the horizontal axis, or X axis, is time. Over time, the position of the sun changes, and this process is reproduced every 24 hours.Now, after we have studied the graph of the behavior of the sun, we can find out its position in the sky, even if we do not see the sky, for example, being in a cave where the sunlight does not penetrate. In order to do this, let's name our graphic, for example,
sunsVerticalPositionAt . Now we can build the following equation: verticalPositionInTheSky = sunsVerticalPositionAt( [time] ) Now, mathematically speaking, it is enough for us to transfer the value of time to the function, and it will give us the position of the sun. Here's what it looks like.
Finding out the position of the sun using the graph function
Here we select the time point (
t1 ) to which we need to know the position of the sun, then draw a vertical line in our coordinate system, and at the point where it crosses the graph, draw a horizontal line, and find the coordinate of its intersection with the y axis. This coordinate gives us the position of the sun in the sky at a given point in time.Probably, we have already taken from this example all that is possible, so leave the sun alone and move on to the usual charts. Here is how it all looks.
Periodic curve
This graph is a universal representation of a certain periodic process. The value (what was the vertical position of the sun in our example) repeats as another value changes (in our example these second value was time).
There are quite a few periodic functions in mathematics, we will focus on the simplest, widely known function, which we will use to create flawless animation. This is a sinusoidal function, described by the formula
y = sin(x) . Here is her schedule.Sine curve
Doesn't this remind you of anything? For example - the graph that we built, based on an analysis of the behavior of the sun?
We can substitute the
y = sin(x) values in the y = sin(x) formula and get the y values. Strictly speaking, it looks the same as finding out the position of the sun according to the corresponding schedule.Perhaps now you are concerned about the question of what is a " sinusoidal function ." In fact, “sine” is nothing more than the name given to some function, just as we, in our experiment, gave the name of the function
sunsVerticalPositionAt , with which we determined the position of the sun.In the equation
y = sin(x) , you should pay attention to y and x , to how the value of y changes as the value of x changes (it is easy to see that the behavior of y similar to what we have already seen in the example with the sun).In addition, it is worth paying attention to the fact that the maximum value reached by
y is 1, and the minimum is represented by -1.This is only a feature of the sinusoidal function. The values
y = sin(x) yields are in the range of -1 to +1.This range, by the way, is easy to change. That is what we will soon do. However, first, let's gather everything that we have already dealt with and make it so that the circle in the SVG element starts moving.
▍2.2. Transition from mathematics to programming
So, inside the element
... there is a circle with the identifier c . Here's how to access this circle from javascript. After that we will be able to move it. let c = document.getElementbyId('c'); animate(); function animate() { requestAnimationFrame(animate); } In this code, we get a reference to the circle and store it in the variable
c . Also here is a mechanism for performing animation. Namely, here we use the requestAnimationFrame function, which we pass to the animate function. This function recursively calls itself using requestAnimationFrame , which allows you to execute any code inside the animate function at intervals of up to 60 times per second. This makes it possible to perform animations at up to 60 FPS (frames per second). Details about requestAnimationFrame can be read here .The most important thing to know about the
animate function is that the code inside it, each time it is called, describes one frame of the animation. The next recursive call to this function makes a small change, reflected in the next frame of the animation. This happens again and again, at a very high speed (up to 60 FPS), and the result is what looks like an animation.Consider these provisions in practice by analyzing the following code fragment.
let c = document.getElementById('c'); let currentAnimationTime = 0; const centreY = 75; animate(); function animate() { c.setAttribute('cy', centreY + (Math.sin(currentAnimationTime))); currentAnimationTime += 0.15; requestAnimationFrame(animate); } Here, in comparison with the previous fragment, 4 new lines are added. If you run this code, you can see slow periodic circle oscillations around the center point.
Circle movements
That's what's going on here. After we have the coordinates of the center of the circle,
cx and cy , we can say that we are half ready to animate it. Now, first, let's not touch cx , since we do not need the circle to change its horizontal position.And, secondly, we will periodically add the same numbers to
cy or subtract them from this coordinate, which will allow us to move the circle up and down. This process describes our code.Changing the y coordinate of the circle center
The
centreY stores the y coordinate of the center of the circle (75), which allows, to change the vertical position of the shape, add some values to this constant or subtract them from it.The variable
currentAnimationTime , which is initially set to 0, is used to control the speed of the animation. The more we increase it with each call, the faster the circle will move. Here, experimentally, the value of 0.15 is chosen. As it turned out, it gives quite acceptable looking movement of the figure.The
currentAnimationTime is x in the equation y = sin(x) . Performing the calculations necessary to prepare the next frame of the animation, we pass the Math.sin function (this is the standard JavaScript function) to the currentAnimationTime value, increased in the previous step, and add the number that this function produces to the centreY constant.Then we add what we got to
cy , using the setAttribute method.As we already know, the function
y = sin(x) , for any value of x , returns values in the range from -1 to 1 . As a result, the values that we assign cy will be in the range from centreY - 1 to centreY + 1 . This causes the circle to move vertically within 1 pixel.Vertical movement of the shape specified in the code
Now we would like to expand the range of movement of the circle. That is, it is necessary that it deviates vertically from the original value by a distance greater than 1 pixel. How to do it? Maybe we need a new feature? Fortunately, we already have everything we need.
Recall that at the end of section 2.1. it was about the features of the sinusoidal function. In order to expand the range of movement of the figure, you need to multiply what the
Math.sin function produces, by a certain number, which will become a representation of the upper and lower limits of movement.The operation of multiplying a function by a constant is called scaling. Notice how the shape of the graph has changed, and how the multiplication affected the maximum and minimum values of the function.
Scaling graphics
Now, after we figured it out, make changes to the code.
let c = document.getElementById('c'); let currentAnimationTime = 0; const centreY = 75; animate(); function animate() { c.setAttribute('cy', centreY + (20 *(Math.sin(currentAnimationTime)))); currentAnimationTime += 0.15; requestAnimationFrame(animate); } But how will the circle behave now.
Circle movements
As a result, you can see how the circle smoothly moves up and down. Well done, right?
We have just increased the amplitude of the sinusoidal function by multiplying it by a number. Now we want to add two more circles to our animation, one before the one that already exists, the second after it, and make them move in the same way as the original circle. In the code, the description of the new figures looks like this:
<svg width="300" height="150"> <circle id="cLeft" cx="120" cy="75" r="10" /> <circle id="cCentre" cx="150" cy="75" r="10" /> <circle id="cRight" cx="180" cy="75" r="10" /> </svg> We made some changes to the code and organized it in a new way. For starters, notice the two lines in bold. They describe two new circles, one placed 30 pixels (
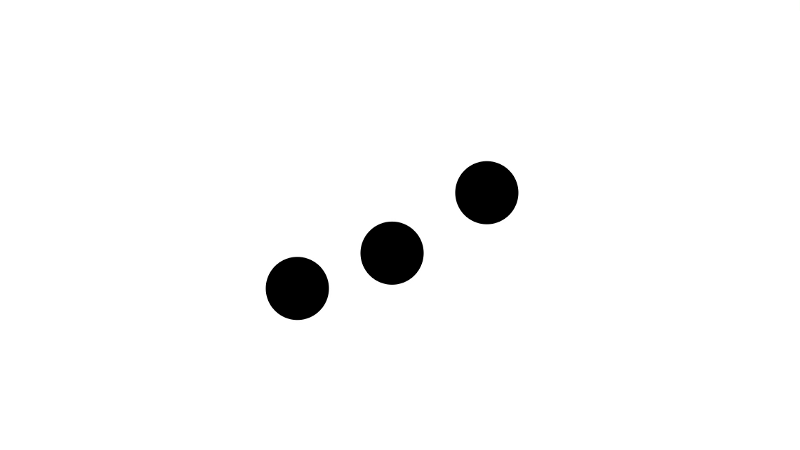
150 - 30 = 120 ) to the left of the original, the second 30 pixels to the right ( 150 + 30 = 180 ).Earlier, we assigned a single circle identifier
c . The circle was one, and it didn’t stop working with him. But now, since we have three circles, it will be useful for them to assign clearer identifiers. That is what is done here. Now, if we consider the circles from left to right, they have the identifiers cLeft , cCentre and cRight . Source circle identifier, c , changed to cCentre .If we now run our code, as a result we can see the following.
Three circles
So far, so good, but new circles are still. Fix it.
let cLeft= document.getElementById('cLeft'), cCenter = document.getElementById('cCenter'), cRight = document.getElementById('cRight'); let currentAnimationTime = 0; const centreY = 75; const amplitude = 20; animate(); function animate() { cLeft.setAttribute('cy', centreY + (amplitude *(Math.sin(currentAnimationTime)))); cCenter.setAttribute('cy', centreY + (amplitude * (Math.sin(currentAnimationTime)))); cRight.setAttribute('cy', centreY + (amplitude * (Math.sin(currentAnimationTime)))); currentAnimationTime += 0.15; requestAnimationFrame(animate); } Several lines of code have been added here, where, first, we get links to new objects, and second, we apply the same animation rules to them as to the original ones. That's what it all gave us.
Animated circles
Now move and new circles. However, all this is not yet similar to the animation that we are striving to create.
Although the circles move periodically, the problem is that their movements are synchronized. And this is not what we need. We need each of the following laps to start moving with some delay. As a result, it will look as if a circle located to the right of the other follows it. For example, as shown below.
Animated circles
You noticed that the circles are now not moving synchronously, those that are located to the right of others, as if they are catching up. If you close, for example, two circles of three with your hand, you will notice that the visible circle performs exactly the same movements as when we were working with a single figure.
Now, in order to achieve the desired effect, we need to make very small changes to the code. However, understanding what these changes are and how they influence the result is very important. So let's deal with them.
If we represent the movement of circles as graphs of the dependence of their coordinates
cy on currentAnimationTime , we get the following.Graphs of coordinates of figures depending on time
There is nothing surprising in these charts, as we know that all circles move in the same way. It is also clear that since we use a sinusoidal function to animate figures, all the graphs presented here are graphs of this function. Now, to disrupt the synchronization of these graphs, we need to understand the mathematical concept of shift / transfer graphs.
Shift is a parallel transfer of a graph that does not change the shape or size of the graph of a function. It only changes its location. Shift can be horizontal or vertical. In this case, we are interested in horizontal shifts in graphs. Notice how changing the value of
a in the following illustration leads to a horizontal movement of the graph of the function y=sin(x) .Transfer function graph (Desmos)
In order to understand how this works, let us return to the example with the sun. So, in that example, we used the
sunsVerticalPositionAt(t) function. This function can pass the time and find out the vertical position of the sun at a specified time. That is, for example, in order to find out the height of the sun above the horizon at 9 am, you can use the construction sunsVerticalPositionAt(9) .Now consider a function of the form
sunsVerticalPositionAt(t-3) .Take a closer look at her. If you pass some time stamp
t to it, it subtracts 3 from this value and returns the position of the sun 3 hours earlier than the specified time.Comparison of functions taking t and t-3
As a result, at
t=9 new function returns the same as the old one, at t=6 , at t=12 , the same function as the old at t=9 , and so on. We changed the function so that it returns the values that precede those values that we pass to it.In other words, we moved the function graph to the right along the
x axis.Take a look at the following drawing. The old function at
t=6 gives us the value B After shifting the graph, the same value is obtained at t=9 .Old schedule and shifted schedule
Similarly, if we add, rather than subtract 3, by getting the function
sunsVerticalPosition(t + 3) , the graph will move to the left, in other words, the function will give us values 3 hours later than the time passed to it.Knowing all that we have just dismantled, we can move the graphs that control the animation of the last two circles, bringing them to the following form.
Shift of graphs of the functions that define the animation of circles
In order to express this in code, you will need to make the following small change.
let cLeft= document.getElementById('cLeft'), cCenter = document.getElementById('cCenter'), cRight = document.getElementById('cRight'); let currentAnimationTime = 0; const centreY = 75; const amplitude = 20; animate(); function animate() { cLeft.setAttribute('cy', centreY + (amplitude *(Math.sin(currentAnimationTime)))); cCenter.setAttribute('cy', centreY + (amplitude * (Math.sin(currentAnimationTime - 1)))); cRight.setAttribute('cy', centreY + (amplitude * (Math.sin(currentAnimationTime - 2)))); currentAnimationTime += 0.15; requestAnimationFrame(animate); } That's all! We moved the graphics responsible for the animation of the
cCenter and cRight . Now the circles behave as we need.Finished animation
Results
As you can see, now the animation looks quite decent, the movements of objects are calculated with absolute mathematical precision. Of course, this simple example is quite amenable to improvement, but it provides a basis on which to build high-quality animation. To better understand how individual animation parameters affect the final result, experiment with the value of
currentAnimationFrame , which is responsible for the speed of the animation, and with the value of amplitude , which sets the amplitude of the motion, and with other values too. In fact, now you can make this kind of animation just the way you want it.Dear readers! How do you develop animations for your projects?
Source: https://habr.com/ru/post/358496/
All Articles