Writing your data source for Grafana
Usually, to display information from a web server, the data is loaded into the monitoring system, and then transmitted to Grafana . About how to do it directly and about some of the nuances on the way to the goal - under the cut.

Development of plug-ins for Grafana is conducted in JavaScript (es6) or TypeScript and involves the use of Node.js in conjunction with any assembler, for example. grunt .
First of all, create a project folder, where we add the files package.json , gruntfile.js and others.
')
After package.json is created, you can install all the dependencies needed for development and the builder by running in the project folder
As a result, the node_modules folder containing approximately 50mb of auxiliary files will be created, and the
Next, create a create folder src with the necessary structure. In the plugin.json file we set the project
It should be noted that the plugin can implement not only a data source or a new type of panel, but also a decision group. In this case, plugin.json will have excellent structure .
In the folder / src / partials add the file config.html , containing the block displayed when connecting to the source. Usually standard for http is enough.
In some plugins you can find query.options.html , which contains settings for metrics. Since version 4.5, these settings are read from plugin.json .
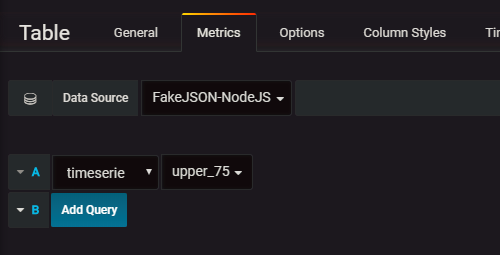
The next file, query.editor.html, implements how metrics (strings in the interface) will be defined. Usually they use drop-down lists, not just an input field. For an Angular, the list item associated with the variable
If the list of values contained in
Please note that
In addition to the
I will note that:
1. The last element with the class
2. You can add / hide elements in the metrics row depending on the panel type by means of the conditional display
The module.js and query_ctrl.js files are fairly simple, and can be written by analogy with other data sources, for example. Simple Json . The main logic is located in datasource.js .
The class described in this module must implement at least two methods
From the above example, it is easy to see that the data for all metrics are requested simultaneously. The main fields are the
The list of
For one metric, the answer may be several results, for example. several graphs. They can be added to a common array, which will then go to the final set for display, where it is no longer important for which metric a particular result was obtained.
The data format given to
In Simple Json, the choice of format is proposed to be solved by an additional attribute of the metric, which is not very good.
Because you can do this automatically, add a
The result of the
To request data, use the
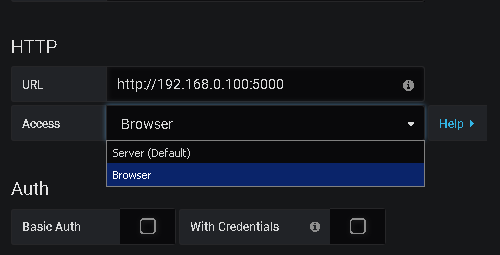
In the case of a browser, the polled web server must support CORS .
If you need to make several queries to the source to get the result for all metrics, you can use
In order for the data source to support variables, you need to implement the
Annotations require the implementation of
To install, just copy the plugin to the % GRAFANA_PATH% / data / plugins for Windows folder or / var / lib / grafana / plugins for other systems and restart Grafana .
If you want your plugin to be added to the list of available ones , then you need to pull the request into the plugin repository or contact the developers via the forum.
Disclaimer
Due to the author’s reluctance to go into the study of the outdated AngularJS used by Grafana for the interface, and the almost complete lack of documentation for plug-in development, this article may contain incorrect statements, traces of peanuts and other nuts.
Training
Development of plug-ins for Grafana is conducted in JavaScript (es6) or TypeScript and involves the use of Node.js in conjunction with any assembler, for example. grunt .
Typical contents of the project folder
/dist ... // . Grafana . /src /img logo.svg // , /partials // config.html // . , http. query.editor.html // . . datasource.js // module.js // plugin.json // - query_ctrl.js // , html- README.md // , Grafana gruntfile.js // LICENSE.txt // package.json // - Node.js , README.md // Node.js First of all, create a project folder, where we add the files package.json , gruntfile.js and others.
')
Sample package.json contents
{ "name": "-", "version": "0.1.0", "description": "--", "repository": { "type": "git", "url": "git+https://-github-" }, "author": "-", "license": "MIT", "devDependencies": { "babel": "~6.5.1", "grunt": "~0.4.5", "grunt-babel": "~6.0.0", "grunt-contrib-clean": "~0.6.0", "grunt-contrib-copy": "~0.8.2", "grunt-contrib-uglify": "~0.11.0", "grunt-contrib-watch": "^0.6.1", "grunt-execute": "~0.2.2", "grunt-sass": "^1.1.0", "grunt-systemjs-builder": "^0.2.5", "load-grunt-tasks": "~3.2.0", "babel-plugin-transform-es2015-for-of": "^6.6.0", "babel-plugin-transform-es2015-modules-systemjs": "^6.24.1", "babel-preset-es2015": "^6.24.1" }, "dependencies": {}, "homepage": "https://--" } Approximate gruntfile.js content
module.exports = function(grunt) { require('load-grunt-tasks')(grunt); grunt.loadNpmTasks('grunt-execute'); grunt.loadNpmTasks('grunt-contrib-clean'); grunt.loadNpmTasks('grunt-build-number'); grunt.initConfig({ clean: ["dist"], copy: { src_to_dist: { cwd: 'src', expand: true, src: [ '**/*', '!*.js', '!module.js', '!**/*.scss' ], dest: 'dist/' }, pluginDef: { expand: true, src: ['plugin.json'], dest: 'dist/', } }, watch: { rebuild_all: { files: ['src/**/*', 'plugin.json'], tasks: ['default'], options: {spawn: false} }, }, babel: { options: { sourceMap: true, presets: ["es2015"], plugins: ['transform-es2015-modules-systemjs', "transform-es2015-for-of"], }, dist: { files: [{ cwd: 'src', expand: true, src: [ '*.js', 'module.js', ], dest: 'dist/' }] }, }, sass: { options: { sourceMap: true }, dist: { files: { } } } }); grunt.registerTask('default', [ 'clean', 'copy:src_to_dist', 'copy:pluginDef', 'babel', 'sass' ]); } After package.json is created, you can install all the dependencies needed for development and the builder by running in the project folder
npm install --only=dev npm install grunt -g As a result, the node_modules folder containing approximately 50mb of auxiliary files will be created, and the
grunt command will be available to build the distributive into the dist folder.Next, create a create folder src with the necessary structure. In the plugin.json file we set the project
id as --datasource , as well as what information it will provide by setting the values of the metrics , alerting and annotations variables. Read more about plugin.json here .Sample plugin.json content
{ "name": "-", "id": "--", "type": "datasource", "metrics": true, "alerting": false, "annotations": false, "info": { "description": "-", "author": { "name": "-", "url": "-" }, "logos": { "small": "img/logo.svg", "large": "img/logo.svg" }, "links": [ { "name": "GitHub", "url": "https://-github-" }, { "name": "", "url": "https://---" } ], "version": "0.1.0", "updated": "2018-05-10" }, "dependencies": { "grafanaVersion": "5.x", "plugins": [] } } It should be noted that the plugin can implement not only a data source or a new type of panel, but also a decision group. In this case, plugin.json will have excellent structure .
html elements
In the folder / src / partials add the file config.html , containing the block displayed when connecting to the source. Usually standard for http is enough.
Content config.html
<datasource-http-settings current="ctrl.current"></datasource-http-settings> In some plugins you can find query.options.html , which contains settings for metrics. Since version 4.5, these settings are read from plugin.json .
The next file, query.editor.html, implements how metrics (strings in the interface) will be defined. Usually they use drop-down lists, not just an input field. For an Angular, the list item associated with the variable
ctrl.target.myprop looks like this <select ng-model="ctrl.target.myprop" ng-options="v.value as v.name for v in ctrl.myprops"> </select> If the list of values contained in
ctrl.myprops needs to be loaded asynchronously, then it will be necessary to create a controller . Grafana already has a component with the desired implementation. <gf-form-dropdown model="ctrl.target.myprop" class = "max-width-12" lookup-text="true" allow-custom = "false" get-options = "ctrl.getMyProps()" on-change = "ctrl.panelCtrl.refresh()" > </gf-form-dropdown> ctrl is an object of the class implemented in query_ctrl.js , associated with the current metric.ctrl.target contains metric properties that will be sent to the source in the request.ctrl.panelCtrl.refresh() causes the panel to request data again.lookup-text specifies whether a hint is available for the field by a drop-down list.allow-custom specifies that it is permissible to select items not from the drop-down list.get-options method for getting the elements of the dropdown list. The result of the method, returned as a value or promise, must be an array of elements of the form {text: "", value: ""} .Please note that
model , get-options and on-change are different from the original ng-model , ng-options and ng-change .In addition to the
gf-form-dropdown , there is also a metric-segment-model . Its use can be seen here . There are no documentation on components, so the list and capabilities can be found only by studying the source code .Possible contents of query.editor.html
<query-editor-row query-ctrl="ctrl" class="mydatasource-datasource-query-row"> <div class="gf-form-inline"> <div class="gf-form max-width-12"> <gf-form-dropdown model="ctrl.target.myprop" class = "max-width-12" lookup-text="true" custom = "false" get-options="ctrl.getMyProps()" on-change = "ctrl.updateMyParams()" > </gf-form-dropdown> </div> <div class="gf-form" ng-if = "ctrl.panel.type == 'graph'"> <label class="gf-form-label width-5">Name</label> <input type="text" ng-model="ctrl.target.label" class="gf-form-input width-12" spellcheck="false" > </div> <div class="gf-form" ng-if = "ctrl.target.myparams.length > 0"> <label class="gf-form-label width-5">Params</label> <input type="text" ng-repeat = "param in ctrl.target.myparams" ng-model="ctrl.target.myparams[param]" class="gf-form-input width-12" spellcheck="false" placeholder = "{{param}}" ng-change = "ctrl.panelCtrl.refresh();" > </div> <div class="gf-form gf-form--grow"> <div class="gf-form-label gf-form-label--grow"></div> </div> </div> </query-editor-row> I will note that:
1. The last element with the class
gf-form--grow needed to fill the unoccupied part of the line with the background.2. You can add / hide elements in the metrics row depending on the panel type by means of the conditional display
ng-if = "ctrl.panel.type == 'graph'" .Code writing
The module.js and query_ctrl.js files are fairly simple, and can be written by analogy with other data sources, for example. Simple Json . The main logic is located in datasource.js .
The class described in this module must implement at least two methods
testDatasource() and query(options) . The first is used to test the connection to the source during its registration (the “Save and Test” button), the second is called each time the panel requests data. I will dwell on it in more detail.Example options passed to the query method
{ "timezone":"browser", "panelId":6, "dashboardId":1, "range":{ "from":"2018-05-10T23:30:42.318Z", "to":"2018-05-10T23:47:11.566Z", "raw":{ "from":"2018-05-10T23:30:42.318Z", "to":"2018-05-10T23:47:11.566Z" } }, "rangeRaw":{ "from":"2018-05-10T23:30:42.318Z", "to":"2018-05-10T23:47:11.566Z" }, "interval":"2s", "intervalMs":2000, "targets":[ { "myprop":"value1", "myparams":{ "column":"val", "table":"t" }, "refId":"A", "$$hashKey":"object:174" }, { "refId":"B", "$$hashKey":"object:185", "myprop":"value2", "myparams":{ "column":"val2", "table":"t2" }, "datatype":"table" } ], "maxDataPoints":320, "scopedVars":{ "__interval":{ "text":"2s", "value":"2s" }, "__interval_ms":{ "text":2000, "value":2000 } } } From the above example, it is easy to see that the data for all metrics are requested simultaneously. The main fields are the
range containing the period for which information is required, and targets is a list of metrics, each of which corresponds to the target property of the class object defined in query_ctrl .The list of
targets must be filtered by the hide property in order not to request the results of “hidden” metrics, as well as to remove obviously “wrong” metrics, for example, with undefined parameters. Then, according to the received list, data is requested for each metric and the resulting one must be converted into a format supported by Grafana .For one metric, the answer may be several results, for example. several graphs. They can be added to a common array, which will then go to the final set for display, where it is no longer important for which metric a particular result was obtained.
The data format given to
query is different for different types of panels, so if the data is requested for a graph, the result needs to be converted to the form {target: -, datapoints: --[, ]} , and for a table, then {columns: --{text: -, type: --}, rows: } .In Simple Json, the choice of format is proposed to be solved by an additional attribute of the metric, which is not very good.
Because you can do this automatically, add a
type attribute to the target based on this.panel.type and convert the result based on it. It is somewhat strange that in options the panel type is not transmitted.The result of the
query method should be a promise that returns {data: -} .To request data, use the
backendSrv.datasourceRequest(options) method, which, depending on the type of data source selected, either forwards the data to Grafana or executes the request directly by the browser.In the case of a browser, the polled web server must support CORS .
If you need to make several queries to the source to get the result for all metrics, you can use
Promise.all var requests = this.targets.map((target) => ... ); var scope = requests.map((req) => this.backendSrv.datasourceRequest(req)); return Promise.all(scope).then(function (results) { // results data, ... return Promise.resolve({data}); }) In order for the data source to support variables, you need to implement the
metricFindQuery(options) method, which returns an array (possibly through a promise) with elements of the form {text: "", value: ""} . In addition, the query will need to go through the options.targets and for each element of this array for all its properties, where a variable can be substituted, perform the conversion target.myprop = this.templateSrv.replace(target.myprop, options.scopedVars, 'regex'); Annotations require the implementation of
annotationQuery(options) .Installation and Publishing
To install, just copy the plugin to the % GRAFANA_PATH% / data / plugins for Windows folder or / var / lib / grafana / plugins for other systems and restart Grafana .
If you want your plugin to be added to the list of available ones , then you need to pull the request into the plugin repository or contact the developers via the forum.
Links
- Brief official documentation for developers
- Official forum, section for developers
- Sources of other data sources
- Simple Json - the easiest to learn
- IBM APM - a slightly more complicated option.
- Grafana's Zabbix is the most functional and sophisticated benchmark.
- PRTG is a simplified plug-in analog for Zabbix.
- Httpsql - the author's data source for database queries.
Source: https://habr.com/ru/post/358404/
All Articles