Testing phones with Arduino
In 2016, Habré attracted a lot of attention to the post of Alexey Lavrenyuk “We measure battery consumption on mobile devices. Experiment in Yandex. A year later, at our conference, Heisenbug, Alexey, together with his colleague Timur Torubarov, presented the report “Testing phones with the help of Arduino”: some of this report coincided with the habrapost, but there was a lot of new information. And now the circle is closed: we made a text version of the report so that all this new information will appear on Habré.
How to measure the power consumption of the application? Why do 10,000 measurements per second instead of 500? Which smartphones are harder to drill? How to kill the iPhone in a completely unexpected way? In the text under the cut - all this and more. Also attach the video report:
Timur Torubarov:
I would like to start with a greeting greeting to the guys from Badoo: we listened to your report yesterday, it was very cool. Who has not heard - we recommend, the guys there talked about testing geolocation in Badoo and about power consumption during geolocation.
')
But, unlike them, firstly, we dug deeper into the topic of energy consumption, and secondly, during testing we suffered a lot of iPhones in the physical sense!
Alexey Lavrenyuk:
People are surprised “you and Timur are load testers, which is what you are drilling iPhones”. How did we get started? The developers came to us and said: “We here choose which library to use: write it yourself or buy a paid one. We need to compare the prototype and the free version of the external library on different parameters, in particular, on energy consumption. ” We were engaged in performance, so they came to us.
How to measure the power consumption of the application? A person takes two phones, on one puts one version of the application, on the other, puts both in his pockets. Badoo guys said yesterday that there is a difference between what pocket to put. In fact, there are still a lot of options, how the difference may appear: whether you downloaded the phone, put it on the table, phone revision, etc. In general, there are no two identical phones. Then you walk with these two phones for three days and see which one is faster discharged, that is, it takes you three days to do one test.
We then tested this case and chose to write our bicycle, but at the same time we realized that we need to learn how to measure energy consumption. And faster than three days. We walked around, asked who needed it, and realized that it was necessary to measure not only on Android, but also on the iPhone, on laptops, potentially on tablets, on anything up to the Apple Watch.
We do not want to spend human resources on this and walk for three days with laptops, but we want to do this automatically, preferably for each commit. And we also need to measure energy consumption with great frequency, that is, many, many times per second, I will tell you more about this in more detail.
Our report outline:
Let's start with the multimeters. How is this usually done? There are a lot of software metrics on the phones, maybe energy consumption can also be collected?
We thought so too. Here is the standard IPhone interface for the IPhone, which collects many different metrics and power consumption, too; the black arrow indicates power consumption:

The trick is that the CPU consumption graph shows that it changed during the test, but the power consumption for the entire test did not change at all 1/20.
Does anyone know what 1/20 is? And we did not know. 1/20 is not 1/20 mA, not 1/20 W / h or something physical, it means that the phone will work in this mode for another 20 hours. Such is the encrypted metric of the iPhone.
Android is better: it is Linux, there is / proc, you can conveniently read metrics programmatically. But there is a nuance.

On Nexus, for example, this metric changes every 20 seconds. And we, as already said, need many times a second. On some phones, this metric is in other places, or it shows something strange, we could not decipher, there is no documentation.
On some phones, this metric does not exist at all, we searched for it, then came across a branch of StackOverflow, where a person also searched for this metric for a specific phone model, and finally realized that there was simply no chip that measures current in the phone. And he realized that the only way is to take a multimeter and measure.
We need to test a lot of different devices, we will never find a universal way to collect metrics quickly. Therefore, we decided to build our multimeter.
Naturally, first looked at what is on the market.
Firstly, there are digital oscilloscopes: complex, expensive, powerful, with a bandwidth of several MHz, i.e. we can make millions of measurements per second. First, they stand like a wing of the Boeing. And we need to drive parallel tests, many, many tests for each release, for each application of Yandex, that is, all this needs to be multiplied by a couple of dozen or even more in the future, and we get an irresponsible amount. In addition, these devices are not designed for this. We just need to collect the metric, then analyze it separately. And these devices are able to display the metric on the screen, its frequency characteristics, that is, they are for detailed signal analysis.
Then we stumbled upon a project called Power Monitor - this is a device designed specifically for collecting metrics from phones. But it didn’t suit us either, because it is being sold as a black box: it’s impossible to climb into it, to correct something for our needs. The software works under Windows, and we have Linux everywhere, we need to push it into automation. In general, difficult.
After we began to develop our piece, we stumbled upon the batt0r project. They are very similar to us, these are guys from different institutions (including Stanford). They published a couple of articles, we gathered various useful information (I’ll refer to them a little), but then they went to work at Google, and after that we couldn’t contact them. And the articles are gone, the old links no longer open.
In general, we decided to build our multimeter, found a scheme on the Internet.

I have never built anything from electronics before, only programmed. The scheme is simple, includes a shunt - this is a resistor, the current through which the phone is powered, passes through it, and a potential difference is formed. This potential difference is small, not directly measured with Arduino (we decided to start using Arduino, because this is a simple, cheap start). To consider this Arduino, we need to increase this potential difference, this is done using an instrumental amplifier, it is also on the diagram.
We implemented this scheme, simply poke the wires into the breadboard. There you can see the Arduino, amplifier, shunt and the connected phone.

We measured first in the break of the USB cable, because it is simple: I cut the wire in half, put a shunt in there, and everything is measured. We had this proof of concept.

We got the first charts. Here we have the Power Monitor on the table, we compared the results with it - we understood that it works fine, we measure something, we must continue.
Next we need to get rid of the measurements in the USB break. Otherwise, the phone will charge the battery before you consume current, and you will not measure this process, and you will not see how much the phone consumes at this particular moment. Therefore, the only option is to pull out the battery, power the phone outside from any source. In this case, the phone can no longer accumulate, and see the actual current power consumption.

Timur is sorting the IPhone to get a battery out of there. Modern batteries are smart devices, they are not just two wires from a battery, but also a microcontroller.

It looks like this, we cut it off from the IPhone battery, it has a convenient connector that can connect it back. And we got soldered directly to this controller, that is, we didn’t buy a 4-wire connector somewhere, and implement some kind of logic inside.

So, we soldered to this controller. The next question is: how can developers give it away now? It looks scary, you whisk away from the table - everything will break, you must somehow close the case back.
In the article about battOr it is proposed to make a flexible printed circuit board, which can be pulled out of the case into the slit. This, firstly, costs a lot of money, and secondly, not every telephone will be able to be withdrawn, because they are tightly closed. Therefore, we decided to apply the Russian engineering solution. Here it is:

We began to drill phones. IPhones are drilled very well, conveniently, they are aluminum. Some phones are glass, they are badly drilled, cracked.

We removed from them a wire with a connector, it is plugged only with one side, you will not mix up the polarity. At that time, the finished solution looked like this: a box that the developer connects to the computer's USB port, and the phone connects to the box, and everything works on his local machine.

The parameters of our device then were as follows:
The maximum measured current is 3A, for telephones it is enough. For tablets it may not be enough, but we have ideas on how to defeat it.
The resolution of the ADC in Arduino is 10 bit, which means that we have 1024 gradations, with which we measure the input voltage or current.
The frequency of measurements at the Arduino, then was 500 samples per second. This was the first decision in the forehead, and we thought that this was enough for everyone, like Bill Gates with his "640 kilobytes of memory." Then they came to us from the team of the mobile browser, showed an article about battOr and said that this is not enough. We said “why do you need more than 500 measurements per second, this is so complete”. They say: “Well, look, battOr lead this case: they took Chrome with Safari and compared the time of drawing one frame of video on YouTube. We saw that Safari is better in energy efficiency than Chrome. They localized the place in the code in which this energy was consumed, sawed it out, repaired Chrome, built new graphics and saw that they now coincide with Safari. ”

One frame of video is 16 milliseconds, and during these 16 ms we must have time to make a lot of measurements. If we measure with a frequency of 500 samples per second, then we get one point in 2 ms, and here we need more. But how much more do we need?
We took another Arduino (Arduino Due), were able to get a million samples per second from the box. They built graphs and saw that they are quite smooth, so, in principle, 10 thousand measurements per second are enough.
We managed to overclock Arduino Nano, to which we initially launched on 500 samples per second, up to 10,000. To do this, we had to not use standard library functions, but write our own, which directly pull registers. Library functions are rather slow due to the fact that they are universal. By modifying the firmware, we managed to increase the frequency of collecting our metrics. And we have growth potential, we can use other cores - for example, STM32, we literally soldered this thing during the week and soon we will use it, I hope that it will work even better than Arduino.
The most interesting thing is that we learned how to collect a metric in real-time: just flipping through Facebook on your phone, you can see which page of your friend consumes more energy. However, while we do not use it, we try to use automatic methods. It is also interesting that this million points on the screen in real-time is drawn in Python, it just amazes me.
The next task that we faced after the acceleration of our piece of iron is synchronization. What do you need to synchronize there? The fact is that on the phone, on the Arduino, and on the computer the clock is different, they must either be synchronized first, and then measured so that your logs are then matched with the consumption schedule, or you must first take the logs and then synchronize them.
How can these logs be synchronized with the phone? The article about battOr describes the method of how they do it, and we decided to go the same way. We generate bursts of energy consumption on the phone, for example, using a flashlight: we light a flashlight - consumption increases, we quench - consumption decreases. Thus, we make a square signal, and then generate the same signal, but already, clean. It turns out two graphs, one real, the other generated, and we compare them, moving our reference along the original signal. And we are looking for a point where they correlate as much as possible with each other, here it is:

We tried to do this, at first we had an approach in the forehead: count cross-correlation, move, count cross-correlation. There were two problems with this approach. First: it takes a very long time to read a few minutes for one test. When our tester downloaded the results, he waits for a few minutes until the synchronization is calculated, this is bad. And, secondly, we did not always find the very peak that we need, sometimes shifted in one direction or another. Disclaimer: “I’m not a real welder,” but I’ll try to explain the math we’ve applied to solve these two problems.

First, we applied the fast Fourier transform. Cross-correlation is equivalent to a convolution with a signal deployed along the Y axis. That is, we put a minus before the time in the signal or in the reference, and we consider the convolution, we obtain a cross-correlation. This is the first thought. Second: there is an FFT convolution algorithm, which is much faster than if you count it on the forehead. Our synchronization was considered a few minutes, and with this algorithm we count less than a second per test.

How convolution works: we translate our function, our reference into the frequency domain. That is, we had a graph, where the horizontal axis is time, and it became a graph, where the horizontal axis is frequency. Then we multiply these two resulting graphics, and convert it back to the time domain. We do this with the help of the fast Fourier transform, it sounds difficult, but in Python one line, like this:

I brought math to show that Python is cool! Thus we solved the problem with the performance of our synchronization. The next problem with instability. Where does she even come from? Here is a typical graph that we then observed, which was unstable:

On it is our reference, it is clear that it coincides with the flashlight flash. Green - cross-correlation graph. And this chart has a problem: the difference between the peaks in height is not so big, and we still have noises on our chart due to the fact that we poke the screen, we move the shutter, where the flashlight turns on, with our hands, and this graph can shift to the right, for example, and this happens in different cases, sometimes happens, sometimes not.
We tried to flash the program code in random order. There was also a problem here - sometimes it worked well, sometimes not so much. And we thought that there probably was some kind of optimal waveform for it to match well. I began to search the Internet, came across a very interesting lecture
about how the plane flies over the ice of Antarctica and measures the thickness of the ice.

It turned out that they use the same thing. The aircraft emits a signal, takes the signal back, and looks for a correlation with the reference.
Here is the resulting picture, they found the thickness of the ice:

And they had the same problem. It is connected with the fact that when you take a random signal and are looking for a correlation with yourself ...

Here, at the upper left, there is a random signal, a bit of noise is added there, and below it is a cross-correlation with oneself, just shifted. And it is clear that the peak is not very pronounced there. But when you take a signal with increasing frequency (upper right), then you get a signal with a pronounced peak (lower right).
We also began to flash software flashlight with increasing frequency. This is how it looks on the chart:

And our synchronization began to work much more stable. The vertical yellow lines on the graph are the flashlight flash from the logs, the blue lines are the current consumption. And on the right we see events from the logs, only the flashlight flash is displayed here, but in fact you can see there all the events from the logs and compare them with the original schedule.
Now about how a typical test looks, from the point of view of a tester or a developer. First, we can drive our tests manually.
How it happens: we take the phone, disconnect USB (I’ll explain why later), start recording measurements, blink the flashlight manually or using a special application, then do something on the phone, perform some scenarios that we want to measure stop the measurement recording, connect the USB back, download logs from the phone, they are automatically synchronized and loaded into our system for reports.
With the help of such tests, we were able to make different measurements, for example, to compare different music applications by average power consumption during the scenario:

Compare browser consumption during cold start, following links and other scenarios:

But we, realizing that there are few manual tests, because testers cannot save enough time to measure everything, so we began to think how to automate all this.
For automation, first of all we had to solve the problem with the fact that the phone, when connected via USB, begins to be powered not from a battery, but from USB. There is no universal solution: someone turns off consumption by software, but this cannot be done everywhere, especially on the IPhone.

Therefore, we came up with a wire that does not give the phone more than 20 mA. It is arranged simply: there is one field-effect transistor (or, if you need to switch the current level, several field-effect transistors).

And we began to distribute all these wires for automatic tests. But this is not the only problem that has arisen. There is a problem with this circuit; it lies in the fact that you cannot connect USB.

Because you have a loop on the ground, and a minus on the phone, and a USB ground on the phone are different things, there is a potential difference between them, and you start to have a current, we first solved this with the help of these 10 kOhm resistors, t. e. your current is not so big, but it spoiled our measurements.

And we decided to add a galvanic isolation to our circuit. Made on the basis of a special chip, a signal passes through it, but the current does not pass, and we had to bring out our ADC. That is, first we used an analog-to-digital converter in the microcontroller, and now we have installed a separate chip that measures the voltage directly from the sensor.
The external ADC we chose better than the one that stands in the Arduino, and it has a bit more. But in the picture above you can find a file. Timur may, because his condenser flew in the forehead once, and now he is looking well. Otgadka - under the spoiler.
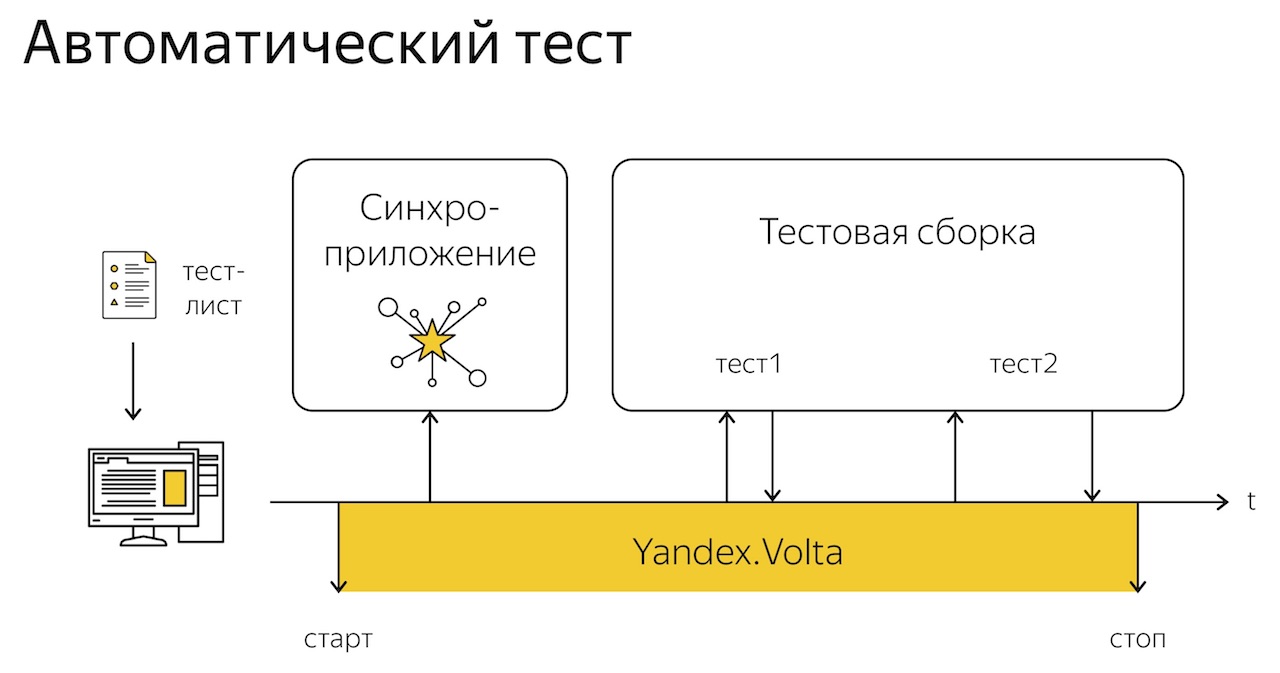
The process of automatic testing in our country looks something like this. We send a test list (our test script, config) to the server. The server starts the recording of measurements, automatically flashes a flashlight, then we run a test build, this is a JAR-nickname on the phone.
Then everything is loaded into our analytical system, and there we see different graphs. Different teams in different ways, this is the example of the browser command:

They have tests divided into so-called suites. One suite is a set of tests for a specific browser functionality: only the network is testing something, only the UI is testing something. And when such a suite starts to run, they log the tag “we started testing the UI”, when it ends - “we finished testing the UI”. We combine the logs with the consumption schedule and select fragments on the consumption graph when it was tested.
Thus, we can follow the regressions, how the consumption of a specific test suite changes from version to browser version: UI, network, etc.

Here we select fragments, we can run each test several times to collect statistics on them so that the most stable results are obtained, and then we build regression graphs.
Now Timur will tell you how to do this at home.
Timur Torubarov:
You, probably, got bored, Alexey told about all sorts of complicated things, about mathematics, microcontrollers. And I will entertain.
Alexey has already told that we are on load testers, and we are doing Yandex.Tank. And with Volta, this is the name of our project, we did the same thing: we put it into the open source , you can download it, touch it.
But “do not repeat it at home”: the technique is expensive, especially the iPhone, so do everything at your own peril and risk, and either be very careful or prepare ten iPhones in advance.
So, we want to do, for example, that my Android would live out until the evening, so that all people’s phones would live longer, the manufacturers would take care, including software, how the hardware itself works, and optimize their software as they could.

Let's try to assemble such a box, which was told by Alexey, with his own hands, quickly and from improvised means. Here are three components: a current sensor, a power supply unit and a microcontroller, each of these components can be bought on AliExpress for 50 rubles.

First we need food. We took a ready-made board based on the XL4005 module, 50 rubles on Aliexpress, this is a DC-DC step down voltage converter. We feed it from a laptop power supply, which is almost free of charge in the helpdesk, because when replacing laptops, employees donate old ones together with power supplies, their whole mountain lies, we come and pick up the boxes. They say thank you, but they probably don’t know what we are doing with them later.
But not all power supplies are suitable, you need to carefully measure the potential difference between the minus output and USB, so as not to burn anything (for example, a new Macbook).

Notebook power supplies are powered by 220 V, and geoservice guys were not very comfortable testing their applications with geolocation: they walked down the street around the office with a large seven-kilogram UPS with lead batteries, with a laptop, with our box and phone. It’s okay to go around Yandex’s office like that, people don’t ask questions, but it’s better not to come to the railway station.

Especially for them, we made a box that is powered by a battery. And it writes data to the SD card, you can then go somewhere to the office, download, download the backend and everything works fine. It is convenient to go on business trips, the guys with such things went to Belarus, there were no questions. By the way, it works from the cigarette lighter: Alexey's Kia cee'd passed the test.

The second component of this box is a current sensor, bought on AliExpress for 50 rubles, very convenient. It converts current to voltage, one ampere to one volt. We, accordingly, interrogate it by the microcontroller. The measurement range is from zero to three amps, it fits us perfectly. But he has a problem: there is no electrical isolation, about which Alexey has already spoken.

Do not do this.

Next is the microcontroller. You can take the Arduino Nano, to the surprise, it costs 50 rubles on AliExpress, it has a built-in ADC and it is convenient to write firmware: either in the Arduino Studio or in the Platformio IDE. We took Platformio IDE, because it is installed from the console with one command, and the firmware is clogged with one command, super.

Putting it all together, it looks like this: power, current sensor, microcontroller and telephone, which is powered by a power supply unit through a current sensor.

Fill the firmware on the microcontroller, ready-made firmware can be taken from us, there are both for 500 samples per second, and for 10,000, it is poured in with one command. For automation, for some console pieces - this is the perfect solution.
After we have collected the box, we need to prepare the phone.

Alexey included this video in the presentation, because he wanted to play a trick on me and see how I’ll get out ... In general, I don’t know what I was guided by when I did it on my knees, but not exactly by safety.
This is a portable box that we collect for geo-services. In general, you need to prepare a phone. The algorithm is very simple: you need to disassemble it, pull out the battery, cut off the controller from the battery, solder the wires to them and assemble them back. But the phones are all different, and this is a problem.

There is a whole bunch of problems (especially the iPhone): there are fragile elements, unreliable loops. For example, this is the story: when we disassembled the iPhone 5, found a bunch of cables going to the display, and they all attached to the motherboard with a metal cover. The cover is screwed to the motherboard with four bolts, and all four are the same size but different lengths. Do you understand what the trick is? If the screw is not screwed in the wrong place, it breaks through the motherboard, and it’s almost solid on the iPhone: it's very difficult to fix this thing.
At the same time, the difference in length is something in the region of 0.1 millimeter, it is not visible to the eye. That is, if you have not read it, then you do not know about it. But in the end, all the forums are filled with amateurs, who disassembled, then collected and stumbled upon it. And so we also lost the iPhone 5.
We also don’t like glass cell phones. One Korean company, whose batteries have recently come on fire, still loves to glue everything and loves glass cases. We are not so much not to love this company, but to disassemble its phones is a problem for us.
And after we have prepared the box, prepared the phone, we just have to install the software. We use Python and install with the command “pip install volta”.
This is how it looks under the hood:

I show this only for you to understand that we have thought over everything there. Do not understand this. I wrote this for two months.
And now I will show the demo how we are testing the real Yandex browser application.

We use Jupyter Notebook, Python pandas - all these jokes, because we are load testers, we love statistics. We will work with Volta, as with the library.
We import the library, create the config, specify the path to the device, the type of the box (binary), and the voltage. Voltage is set arbitrarily, as you screwed it onto DC-DC. And create a class Voltabox, start the data collection, start test.

Data is collected. We can read one second of this data, at the output we get the pandas dataframe. Let's make describe, look and see that in the dataframe for 1 second there are 10,000 values (this is a box of 10 kHz), and an average consumption of 116 mA.
We perform tests, stop recording with the command volta_box.end_test (), now for speed we will not do this. Stopping the test, perform a couple of functions. One of them reads out the data from the queue with the results and prepares them, collects them into the necessary dataframe. The second builds on the prepared data graphics, we show them.
In principle, since the code lies in the open source, we will not comment on it now to every comma. The main thing: we build graphs, we prepare data, it turns out that such beauty, on which nothing is clear.

Blue is current consumption. There are a lot of values, which is why it is so noisy, and for clarity, we built a red moving average, a moving average. Now we will understand what is happening on this chart.
In the process of tests, we collect logs from the phone, and we can record various events in logsat, then get them to the computer, and then automatically put them on the charts (using the synchronization that Alexei spoke about). And we see the events of the inclusion of something on the phone, I do not remember what we included here. It was a test with some build of Yandex. Browser, there was a patch there that the developer wrote overnight (probably, having reached Balmer Peak).
In general, he wanted to quickly roll in the prod, says: "Look, I have such a patch, it will bring a lot of money, let's test it." The manager's eyes lit up: "Let's roll," we began to test. We took two applications, without a patch and after, and began to compare. The first launch with the patch, the second without the patch. Select a second of these sections, reduce it all to one chart and see:

We have a certain Baseline, it is indicated in gray, this is when the phone just lies with the display on. We have a blue line - this is a test run without a patch. And we have a red line, which probably brings a lot of money, but for some reason it is above all. And here is a very controversial situation: if there is a lot of benefit, maybe it can be rolled out, and in the future it can be paid. But, most likely, the developer will rework and finish something so that it works optimally and does not hurt users, because if the user has a battery because of us, we will suffer. Because he will leave.

We've got a bunch of metrics, and then we can work with them, compare, count quantile, average - now we will not go deep into analytics. It is important that we managed to assemble a device from available tools that would measure energy consumption and move away from percentages and three-day tests for metrics with which you can already work, which can be compared, by which you can build a regression, back-to-back tests and all these familiar things that are pleasant and convenient to work with.
At parting, I demonstrate Nexus: you see, it has no back cover, no battery, not even a power button ... I could switch on the same, but I don’t remember the pin code. The guys from the browser reinsured.

Useful links:
How to measure the power consumption of the application? Why do 10,000 measurements per second instead of 500? Which smartphones are harder to drill? How to kill the iPhone in a completely unexpected way? In the text under the cut - all this and more. Also attach the video report:
Introduction
Timur Torubarov:
I would like to start with a greeting greeting to the guys from Badoo: we listened to your report yesterday, it was very cool. Who has not heard - we recommend, the guys there talked about testing geolocation in Badoo and about power consumption during geolocation.
')
But, unlike them, firstly, we dug deeper into the topic of energy consumption, and secondly, during testing we suffered a lot of iPhones in the physical sense!
Alexey Lavrenyuk:
People are surprised “you and Timur are load testers, which is what you are drilling iPhones”. How did we get started? The developers came to us and said: “We here choose which library to use: write it yourself or buy a paid one. We need to compare the prototype and the free version of the external library on different parameters, in particular, on energy consumption. ” We were engaged in performance, so they came to us.
How to measure the power consumption of the application? A person takes two phones, on one puts one version of the application, on the other, puts both in his pockets. Badoo guys said yesterday that there is a difference between what pocket to put. In fact, there are still a lot of options, how the difference may appear: whether you downloaded the phone, put it on the table, phone revision, etc. In general, there are no two identical phones. Then you walk with these two phones for three days and see which one is faster discharged, that is, it takes you three days to do one test.
We then tested this case and chose to write our bicycle, but at the same time we realized that we need to learn how to measure energy consumption. And faster than three days. We walked around, asked who needed it, and realized that it was necessary to measure not only on Android, but also on the iPhone, on laptops, potentially on tablets, on anything up to the Apple Watch.
We do not want to spend human resources on this and walk for three days with laptops, but we want to do this automatically, preferably for each commit. And we also need to measure energy consumption with great frequency, that is, many, many times per second, I will tell you more about this in more detail.
Our report outline:
- Why we did not take ready multimeter, which is full on the market
- How we made our multimeter
- How we improved it in accordance with the requirements of different teams.
- What from our project can be downloaded in open source
- How to use it and what results can be obtained
As they usually do
Let's start with the multimeters. How is this usually done? There are a lot of software metrics on the phones, maybe energy consumption can also be collected?
We thought so too. Here is the standard IPhone interface for the IPhone, which collects many different metrics and power consumption, too; the black arrow indicates power consumption:
The trick is that the CPU consumption graph shows that it changed during the test, but the power consumption for the entire test did not change at all 1/20.
Does anyone know what 1/20 is? And we did not know. 1/20 is not 1/20 mA, not 1/20 W / h or something physical, it means that the phone will work in this mode for another 20 hours. Such is the encrypted metric of the iPhone.
Android is better: it is Linux, there is / proc, you can conveniently read metrics programmatically. But there is a nuance.
On Nexus, for example, this metric changes every 20 seconds. And we, as already said, need many times a second. On some phones, this metric is in other places, or it shows something strange, we could not decipher, there is no documentation.
On some phones, this metric does not exist at all, we searched for it, then came across a branch of StackOverflow, where a person also searched for this metric for a specific phone model, and finally realized that there was simply no chip that measures current in the phone. And he realized that the only way is to take a multimeter and measure.
We need to test a lot of different devices, we will never find a universal way to collect metrics quickly. Therefore, we decided to build our multimeter.
Naturally, first looked at what is on the market.
Firstly, there are digital oscilloscopes: complex, expensive, powerful, with a bandwidth of several MHz, i.e. we can make millions of measurements per second. First, they stand like a wing of the Boeing. And we need to drive parallel tests, many, many tests for each release, for each application of Yandex, that is, all this needs to be multiplied by a couple of dozen or even more in the future, and we get an irresponsible amount. In addition, these devices are not designed for this. We just need to collect the metric, then analyze it separately. And these devices are able to display the metric on the screen, its frequency characteristics, that is, they are for detailed signal analysis.
Then we stumbled upon a project called Power Monitor - this is a device designed specifically for collecting metrics from phones. But it didn’t suit us either, because it is being sold as a black box: it’s impossible to climb into it, to correct something for our needs. The software works under Windows, and we have Linux everywhere, we need to push it into automation. In general, difficult.
After we began to develop our piece, we stumbled upon the batt0r project. They are very similar to us, these are guys from different institutions (including Stanford). They published a couple of articles, we gathered various useful information (I’ll refer to them a little), but then they went to work at Google, and after that we couldn’t contact them. And the articles are gone, the old links no longer open.
How we made our multimeter
In general, we decided to build our multimeter, found a scheme on the Internet.
I have never built anything from electronics before, only programmed. The scheme is simple, includes a shunt - this is a resistor, the current through which the phone is powered, passes through it, and a potential difference is formed. This potential difference is small, not directly measured with Arduino (we decided to start using Arduino, because this is a simple, cheap start). To consider this Arduino, we need to increase this potential difference, this is done using an instrumental amplifier, it is also on the diagram.
We implemented this scheme, simply poke the wires into the breadboard. There you can see the Arduino, amplifier, shunt and the connected phone.
We measured first in the break of the USB cable, because it is simple: I cut the wire in half, put a shunt in there, and everything is measured. We had this proof of concept.
We got the first charts. Here we have the Power Monitor on the table, we compared the results with it - we understood that it works fine, we measure something, we must continue.
Next we need to get rid of the measurements in the USB break. Otherwise, the phone will charge the battery before you consume current, and you will not measure this process, and you will not see how much the phone consumes at this particular moment. Therefore, the only option is to pull out the battery, power the phone outside from any source. In this case, the phone can no longer accumulate, and see the actual current power consumption.
Timur is sorting the IPhone to get a battery out of there. Modern batteries are smart devices, they are not just two wires from a battery, but also a microcontroller.
It looks like this, we cut it off from the IPhone battery, it has a convenient connector that can connect it back. And we got soldered directly to this controller, that is, we didn’t buy a 4-wire connector somewhere, and implement some kind of logic inside.
So, we soldered to this controller. The next question is: how can developers give it away now? It looks scary, you whisk away from the table - everything will break, you must somehow close the case back.
In the article about battOr it is proposed to make a flexible printed circuit board, which can be pulled out of the case into the slit. This, firstly, costs a lot of money, and secondly, not every telephone will be able to be withdrawn, because they are tightly closed. Therefore, we decided to apply the Russian engineering solution. Here it is:
We began to drill phones. IPhones are drilled very well, conveniently, they are aluminum. Some phones are glass, they are badly drilled, cracked.
We removed from them a wire with a connector, it is plugged only with one side, you will not mix up the polarity. At that time, the finished solution looked like this: a box that the developer connects to the computer's USB port, and the phone connects to the box, and everything works on his local machine.
The parameters of our device then were as follows:
The maximum measured current is 3A, for telephones it is enough. For tablets it may not be enough, but we have ideas on how to defeat it.
The resolution of the ADC in Arduino is 10 bit, which means that we have 1024 gradations, with which we measure the input voltage or current.
The frequency of measurements at the Arduino, then was 500 samples per second. This was the first decision in the forehead, and we thought that this was enough for everyone, like Bill Gates with his "640 kilobytes of memory." Then they came to us from the team of the mobile browser, showed an article about battOr and said that this is not enough. We said “why do you need more than 500 measurements per second, this is so complete”. They say: “Well, look, battOr lead this case: they took Chrome with Safari and compared the time of drawing one frame of video on YouTube. We saw that Safari is better in energy efficiency than Chrome. They localized the place in the code in which this energy was consumed, sawed it out, repaired Chrome, built new graphics and saw that they now coincide with Safari. ”
One frame of video is 16 milliseconds, and during these 16 ms we must have time to make a lot of measurements. If we measure with a frequency of 500 samples per second, then we get one point in 2 ms, and here we need more. But how much more do we need?
We took another Arduino (Arduino Due), were able to get a million samples per second from the box. They built graphs and saw that they are quite smooth, so, in principle, 10 thousand measurements per second are enough.
We managed to overclock Arduino Nano, to which we initially launched on 500 samples per second, up to 10,000. To do this, we had to not use standard library functions, but write our own, which directly pull registers. Library functions are rather slow due to the fact that they are universal. By modifying the firmware, we managed to increase the frequency of collecting our metrics. And we have growth potential, we can use other cores - for example, STM32, we literally soldered this thing during the week and soon we will use it, I hope that it will work even better than Arduino.
The most interesting thing is that we learned how to collect a metric in real-time: just flipping through Facebook on your phone, you can see which page of your friend consumes more energy. However, while we do not use it, we try to use automatic methods. It is also interesting that this million points on the screen in real-time is drawn in Python, it just amazes me.
The next task that we faced after the acceleration of our piece of iron is synchronization. What do you need to synchronize there? The fact is that on the phone, on the Arduino, and on the computer the clock is different, they must either be synchronized first, and then measured so that your logs are then matched with the consumption schedule, or you must first take the logs and then synchronize them.
How can these logs be synchronized with the phone? The article about battOr describes the method of how they do it, and we decided to go the same way. We generate bursts of energy consumption on the phone, for example, using a flashlight: we light a flashlight - consumption increases, we quench - consumption decreases. Thus, we make a square signal, and then generate the same signal, but already, clean. It turns out two graphs, one real, the other generated, and we compare them, moving our reference along the original signal. And we are looking for a point where they correlate as much as possible with each other, here it is:
We tried to do this, at first we had an approach in the forehead: count cross-correlation, move, count cross-correlation. There were two problems with this approach. First: it takes a very long time to read a few minutes for one test. When our tester downloaded the results, he waits for a few minutes until the synchronization is calculated, this is bad. And, secondly, we did not always find the very peak that we need, sometimes shifted in one direction or another. Disclaimer: “I’m not a real welder,” but I’ll try to explain the math we’ve applied to solve these two problems.
First, we applied the fast Fourier transform. Cross-correlation is equivalent to a convolution with a signal deployed along the Y axis. That is, we put a minus before the time in the signal or in the reference, and we consider the convolution, we obtain a cross-correlation. This is the first thought. Second: there is an FFT convolution algorithm, which is much faster than if you count it on the forehead. Our synchronization was considered a few minutes, and with this algorithm we count less than a second per test.
How convolution works: we translate our function, our reference into the frequency domain. That is, we had a graph, where the horizontal axis is time, and it became a graph, where the horizontal axis is frequency. Then we multiply these two resulting graphics, and convert it back to the time domain. We do this with the help of the fast Fourier transform, it sounds difficult, but in Python one line, like this:
I brought math to show that Python is cool! Thus we solved the problem with the performance of our synchronization. The next problem with instability. Where does she even come from? Here is a typical graph that we then observed, which was unstable:
On it is our reference, it is clear that it coincides with the flashlight flash. Green - cross-correlation graph. And this chart has a problem: the difference between the peaks in height is not so big, and we still have noises on our chart due to the fact that we poke the screen, we move the shutter, where the flashlight turns on, with our hands, and this graph can shift to the right, for example, and this happens in different cases, sometimes happens, sometimes not.
We tried to flash the program code in random order. There was also a problem here - sometimes it worked well, sometimes not so much. And we thought that there probably was some kind of optimal waveform for it to match well. I began to search the Internet, came across a very interesting lecture
about how the plane flies over the ice of Antarctica and measures the thickness of the ice.
It turned out that they use the same thing. The aircraft emits a signal, takes the signal back, and looks for a correlation with the reference.
Here is the resulting picture, they found the thickness of the ice:
And they had the same problem. It is connected with the fact that when you take a random signal and are looking for a correlation with yourself ...
Here, at the upper left, there is a random signal, a bit of noise is added there, and below it is a cross-correlation with oneself, just shifted. And it is clear that the peak is not very pronounced there. But when you take a signal with increasing frequency (upper right), then you get a signal with a pronounced peak (lower right).
We also began to flash software flashlight with increasing frequency. This is how it looks on the chart:
And our synchronization began to work much more stable. The vertical yellow lines on the graph are the flashlight flash from the logs, the blue lines are the current consumption. And on the right we see events from the logs, only the flashlight flash is displayed here, but in fact you can see there all the events from the logs and compare them with the original schedule.
Now about how a typical test looks, from the point of view of a tester or a developer. First, we can drive our tests manually.
How it happens: we take the phone, disconnect USB (I’ll explain why later), start recording measurements, blink the flashlight manually or using a special application, then do something on the phone, perform some scenarios that we want to measure stop the measurement recording, connect the USB back, download logs from the phone, they are automatically synchronized and loaded into our system for reports.
With the help of such tests, we were able to make different measurements, for example, to compare different music applications by average power consumption during the scenario:
Compare browser consumption during cold start, following links and other scenarios:
But we, realizing that there are few manual tests, because testers cannot save enough time to measure everything, so we began to think how to automate all this.
For automation, first of all we had to solve the problem with the fact that the phone, when connected via USB, begins to be powered not from a battery, but from USB. There is no universal solution: someone turns off consumption by software, but this cannot be done everywhere, especially on the IPhone.
Therefore, we came up with a wire that does not give the phone more than 20 mA. It is arranged simply: there is one field-effect transistor (or, if you need to switch the current level, several field-effect transistors).
And we began to distribute all these wires for automatic tests. But this is not the only problem that has arisen. There is a problem with this circuit; it lies in the fact that you cannot connect USB.
Because you have a loop on the ground, and a minus on the phone, and a USB ground on the phone are different things, there is a potential difference between them, and you start to have a current, we first solved this with the help of these 10 kOhm resistors, t. e. your current is not so big, but it spoiled our measurements.
And we decided to add a galvanic isolation to our circuit. Made on the basis of a special chip, a signal passes through it, but the current does not pass, and we had to bring out our ADC. That is, first we used an analog-to-digital converter in the microcontroller, and now we have installed a separate chip that measures the voltage directly from the sensor.
The external ADC we chose better than the one that stands in the Arduino, and it has a bit more. But in the picture above you can find a file. Timur may, because his condenser flew in the forehead once, and now he is looking well. Otgadka - under the spoiler.
Hidden text
, , , :

, , , , .
, , , , .
The process of automatic testing in our country looks something like this. We send a test list (our test script, config) to the server. The server starts the recording of measurements, automatically flashes a flashlight, then we run a test build, this is a JAR-nickname on the phone.
Then everything is loaded into our analytical system, and there we see different graphs. Different teams in different ways, this is the example of the browser command:
They have tests divided into so-called suites. One suite is a set of tests for a specific browser functionality: only the network is testing something, only the UI is testing something. And when such a suite starts to run, they log the tag “we started testing the UI”, when it ends - “we finished testing the UI”. We combine the logs with the consumption schedule and select fragments on the consumption graph when it was tested.
Thus, we can follow the regressions, how the consumption of a specific test suite changes from version to browser version: UI, network, etc.
Here we select fragments, we can run each test several times to collect statistics on them so that the most stable results are obtained, and then we build regression graphs.
Now Timur will tell you how to do this at home.
How to do it
Timur Torubarov:
You, probably, got bored, Alexey told about all sorts of complicated things, about mathematics, microcontrollers. And I will entertain.
Alexey has already told that we are on load testers, and we are doing Yandex.Tank. And with Volta, this is the name of our project, we did the same thing: we put it into the open source , you can download it, touch it.
But “do not repeat it at home”: the technique is expensive, especially the iPhone, so do everything at your own peril and risk, and either be very careful or prepare ten iPhones in advance.
So, we want to do, for example, that my Android would live out until the evening, so that all people’s phones would live longer, the manufacturers would take care, including software, how the hardware itself works, and optimize their software as they could.
Let's try to assemble such a box, which was told by Alexey, with his own hands, quickly and from improvised means. Here are three components: a current sensor, a power supply unit and a microcontroller, each of these components can be bought on AliExpress for 50 rubles.
First we need food. We took a ready-made board based on the XL4005 module, 50 rubles on Aliexpress, this is a DC-DC step down voltage converter. We feed it from a laptop power supply, which is almost free of charge in the helpdesk, because when replacing laptops, employees donate old ones together with power supplies, their whole mountain lies, we come and pick up the boxes. They say thank you, but they probably don’t know what we are doing with them later.
But not all power supplies are suitable, you need to carefully measure the potential difference between the minus output and USB, so as not to burn anything (for example, a new Macbook).
Notebook power supplies are powered by 220 V, and geoservice guys were not very comfortable testing their applications with geolocation: they walked down the street around the office with a large seven-kilogram UPS with lead batteries, with a laptop, with our box and phone. It’s okay to go around Yandex’s office like that, people don’t ask questions, but it’s better not to come to the railway station.
Especially for them, we made a box that is powered by a battery. And it writes data to the SD card, you can then go somewhere to the office, download, download the backend and everything works fine. It is convenient to go on business trips, the guys with such things went to Belarus, there were no questions. By the way, it works from the cigarette lighter: Alexey's Kia cee'd passed the test.
The second component of this box is a current sensor, bought on AliExpress for 50 rubles, very convenient. It converts current to voltage, one ampere to one volt. We, accordingly, interrogate it by the microcontroller. The measurement range is from zero to three amps, it fits us perfectly. But he has a problem: there is no electrical isolation, about which Alexey has already spoken.
Do not do this.
Next is the microcontroller. You can take the Arduino Nano, to the surprise, it costs 50 rubles on AliExpress, it has a built-in ADC and it is convenient to write firmware: either in the Arduino Studio or in the Platformio IDE. We took Platformio IDE, because it is installed from the console with one command, and the firmware is clogged with one command, super.
Putting it all together, it looks like this: power, current sensor, microcontroller and telephone, which is powered by a power supply unit through a current sensor.
Fill the firmware on the microcontroller, ready-made firmware can be taken from us, there are both for 500 samples per second, and for 10,000, it is poured in with one command. For automation, for some console pieces - this is the perfect solution.
After we have collected the box, we need to prepare the phone.
Alexey included this video in the presentation, because he wanted to play a trick on me and see how I’ll get out ... In general, I don’t know what I was guided by when I did it on my knees, but not exactly by safety.
This is a portable box that we collect for geo-services. In general, you need to prepare a phone. The algorithm is very simple: you need to disassemble it, pull out the battery, cut off the controller from the battery, solder the wires to them and assemble them back. But the phones are all different, and this is a problem.
There is a whole bunch of problems (especially the iPhone): there are fragile elements, unreliable loops. For example, this is the story: when we disassembled the iPhone 5, found a bunch of cables going to the display, and they all attached to the motherboard with a metal cover. The cover is screwed to the motherboard with four bolts, and all four are the same size but different lengths. Do you understand what the trick is? If the screw is not screwed in the wrong place, it breaks through the motherboard, and it’s almost solid on the iPhone: it's very difficult to fix this thing.
At the same time, the difference in length is something in the region of 0.1 millimeter, it is not visible to the eye. That is, if you have not read it, then you do not know about it. But in the end, all the forums are filled with amateurs, who disassembled, then collected and stumbled upon it. And so we also lost the iPhone 5.
We also don’t like glass cell phones. One Korean company, whose batteries have recently come on fire, still loves to glue everything and loves glass cases. We are not so much not to love this company, but to disassemble its phones is a problem for us.
And after we have prepared the box, prepared the phone, we just have to install the software. We use Python and install with the command “pip install volta”.
This is how it looks under the hood:
I show this only for you to understand that we have thought over everything there. Do not understand this. I wrote this for two months.
And now I will show the demo how we are testing the real Yandex browser application.
We use Jupyter Notebook, Python pandas - all these jokes, because we are load testers, we love statistics. We will work with Volta, as with the library.
We import the library, create the config, specify the path to the device, the type of the box (binary), and the voltage. Voltage is set arbitrarily, as you screwed it onto DC-DC. And create a class Voltabox, start the data collection, start test.
Data is collected. We can read one second of this data, at the output we get the pandas dataframe. Let's make describe, look and see that in the dataframe for 1 second there are 10,000 values (this is a box of 10 kHz), and an average consumption of 116 mA.
We perform tests, stop recording with the command volta_box.end_test (), now for speed we will not do this. Stopping the test, perform a couple of functions. One of them reads out the data from the queue with the results and prepares them, collects them into the necessary dataframe. The second builds on the prepared data graphics, we show them.
In principle, since the code lies in the open source, we will not comment on it now to every comma. The main thing: we build graphs, we prepare data, it turns out that such beauty, on which nothing is clear.
Blue is current consumption. There are a lot of values, which is why it is so noisy, and for clarity, we built a red moving average, a moving average. Now we will understand what is happening on this chart.
In the process of tests, we collect logs from the phone, and we can record various events in logsat, then get them to the computer, and then automatically put them on the charts (using the synchronization that Alexei spoke about). And we see the events of the inclusion of something on the phone, I do not remember what we included here. It was a test with some build of Yandex. Browser, there was a patch there that the developer wrote overnight (probably, having reached Balmer Peak).
In general, he wanted to quickly roll in the prod, says: "Look, I have such a patch, it will bring a lot of money, let's test it." The manager's eyes lit up: "Let's roll," we began to test. We took two applications, without a patch and after, and began to compare. The first launch with the patch, the second without the patch. Select a second of these sections, reduce it all to one chart and see:
We have a certain Baseline, it is indicated in gray, this is when the phone just lies with the display on. We have a blue line - this is a test run without a patch. And we have a red line, which probably brings a lot of money, but for some reason it is above all. And here is a very controversial situation: if there is a lot of benefit, maybe it can be rolled out, and in the future it can be paid. But, most likely, the developer will rework and finish something so that it works optimally and does not hurt users, because if the user has a battery because of us, we will suffer. Because he will leave.
We've got a bunch of metrics, and then we can work with them, compare, count quantile, average - now we will not go deep into analytics. It is important that we managed to assemble a device from available tools that would measure energy consumption and move away from percentages and three-day tests for metrics with which you can already work, which can be compared, by which you can build a regression, back-to-back tests and all these familiar things that are pleasant and convenient to work with.
At parting, I demonstrate Nexus: you see, it has no back cover, no battery, not even a power button ... I could switch on the same, but I don’t remember the pin code. The guys from the browser reinsured.
Useful links:
Like this report? Please note that this week Heisenbug 2018 Piter will take place , where there will also be a number of interesting speeches. For example, Yandex will be presented again this time, in two presentations at once: “Crowdsourcing in testing” and “Atlas - your new PageObject guide” .
Source: https://habr.com/ru/post/358378/
All Articles