How we conduct experiments in humans. A / b testing for advanced
In biology and medicine, many experiments on humans and other higher primates, as is known, are now banned. But in marketing and product management is not forbidden. What we actively use in ID Finance, conducting multivariate tests of value propositions, product features, interfaces and other things.
A / B testing in our company is widespread and perverted. Our tests are carried out by everyone, with the exception of lawyers and bookkeeping. But the problem is that these experiments are usually much more complicated than what is usually understood by A / B testing - changing the color of the button, moving the fields, and redesigning the landing page - something that can be done easily with a framework like Google Analytics or Visual Website Optimizer. In our case, large chunks of the customer journey change, and such a test can be a significant part of the main business metrics.
As a result, the correct conduct of such tests, and, most importantly, the correct summing up of their results has become a kind of art, accessible to a few enlightened. Which, of course, is not good. As a result, we decided to start collecting recommendations and examples in order to help business analysts and managers do everything right. After all, errors are quite expensive: at best, we will lose time to collect the data curves and restart the test, at worst - we can make the wrong business decision. At the same time, the company is growing, new people are coming and I want to reduce the learning curve as much as possible.
')
In my opinion, our experience and the path that we have taken to accumulate it may be quite applicable in your company. Especially if:
- you have a difficult customer journey;
- its different parts are interconnected, and often the key metrics change in different directions;
- You want to conduct complex experiments with complex effects.
In order not to go straight to the generalizations, I would like to first take you through a sequence of selected cases. I tried to select such examples from our practice, in which the obvious conclusion was not correct. Having considered the problems in this way, we can already be more prepared to proceed to the conclusions and recommendations.
Our way is the samurai user
In order to give context to the further story, let us briefly consider the main stages of our client’s life course.
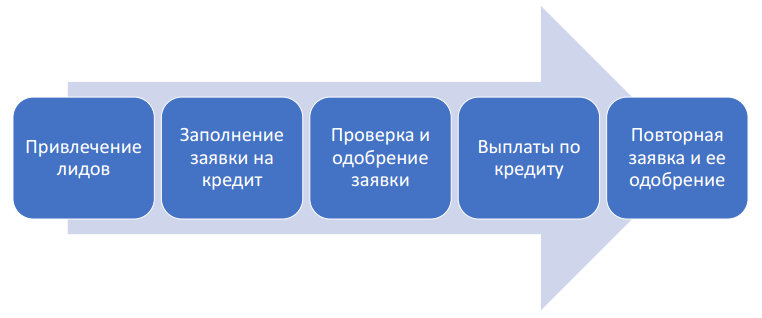
As is customary in any decent e-commerce, we attract customers through online (and sometimes offline) channels to our website, where they register and fill out an application for a loan. Filling out an application is quite a complicated and responsible process, the client must provide quite a lot of information so that we can make an informed decision about (not) providing a loan to him. Actually, consideration of the application and verification of the client and is the next step. After the issuance of money begins "fundraising" campaign for their return. But having successfully repaid the loan, the client usually comes for the following: the return on our projects is around 80-90%.
The table below shows several areas for experimentation in the context of the stages of the customer's life cycle.

In general, there is where to roam. Now let's see what rake you can step on.
We start with a simple: Landing test
I will not deviate from the traditions and give a rather classical example in our performance about testing the landing page in a specific marketing channel.
Below are two options for this very landing. Without reading further, try to guess which option gives the greatest conversion to the next step?
Option A

Option B

And what option we have chosen for further use?
The point is that the answers to these two questions are different. This can be seen by looking at the change in the conversion by steps of the loan application funnel:
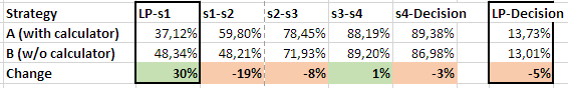
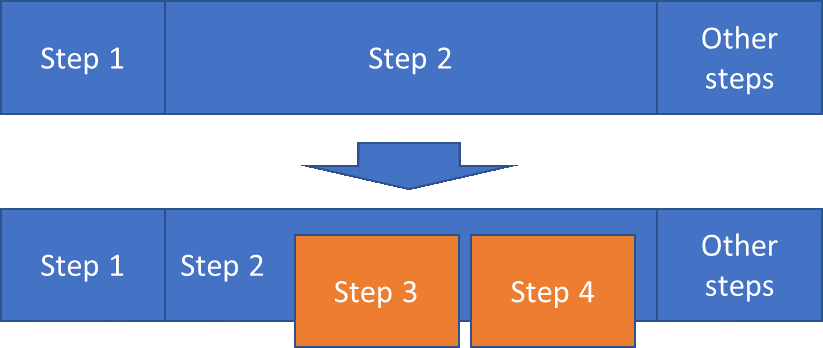
The conversion to the next step is higher in option B, since all that is required from the user in this case is to press the button. It's simple and fun: clicked - and already in the next step. But there the future client is already waiting for numerous questions about his personal data. Well, actually, in one step the application does not end. As a result, we have a fast extinction of the client's motivation and deterioration of conversion on all the other steps, while in option A, the borrower, judging by everything, more deeply realized what was happening and got a bigger fuse in order to reach the end.
Thus, the end-to-end conversion, unfortunately, has not improved, despite the improvement in the landing page. We come to our first conclusion: it is necessary to look at the whole part of the life cycle that is affected by the test, and not just at the conversion directly at the exit from the experiment (the piece that we actually changed).
I do not want and I will not
The following case is also associated with an attempt to increase conversion (for example, our Spanish project).
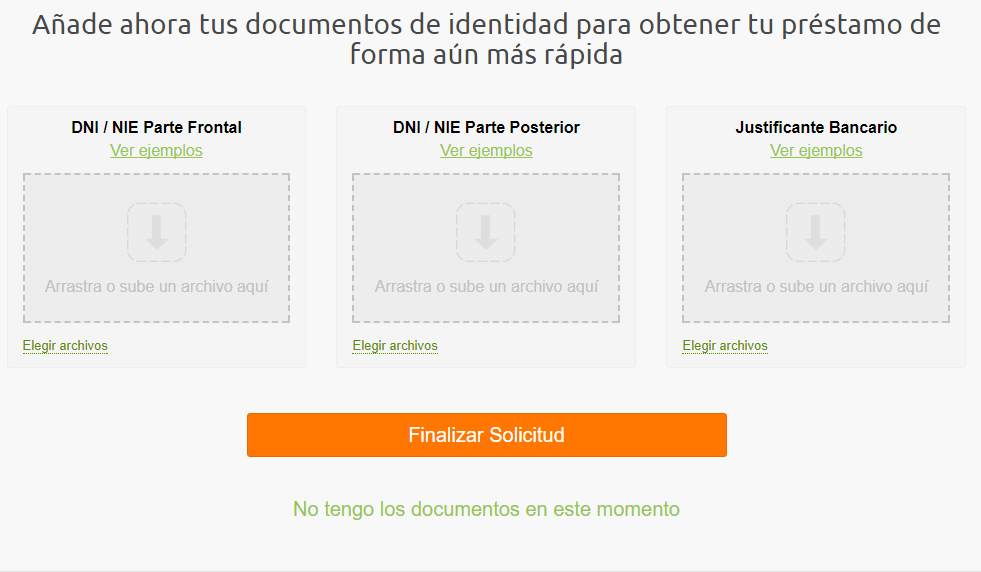
In some countries we have a step of uploading photo documents (like the one presented above). The experiment was to shift this step, initially in the middle of the application process, to the end and make it optional. The calculation was that right at the moment the clients may not have the necessary document and they will send it later.
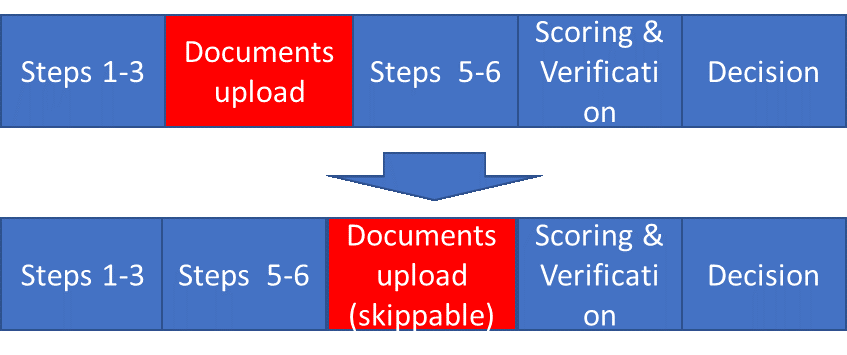
As a result, as expected, the funnel conversion increased by some amount x%. But, at the same time, the number of loans issued increased only by%% xx. Where did this difference come from? The fact is that some of the clients skipping the step, also in the future, at the verification stage, could not (did not want to) provide photo documents. As a result, the metric that we call the “approval level” has decreased - the ratio of the number of loans issued to the requested. The situation is complicated by the fact that one department is responsible for the conversion of the funnel, and another department is responsible for the level of approval.
As in the previous example, the main thing here was to determine the part of the life cycle that the test affected, and to determine the target metric to look at. In this case, the effect of the test can be modeled in the following simple way:
Credits = Leads * Conversion * Approval Level
Those. if the cumulative effect on the issue is positive, then there will be a change, otherwise it will not. This is how we usually resolve contradictions between departments.
Who has a landline phone?
So at some point we thought that not everyone has a landline phone now, and decided to test the form without it (further using the example of the Polish project).
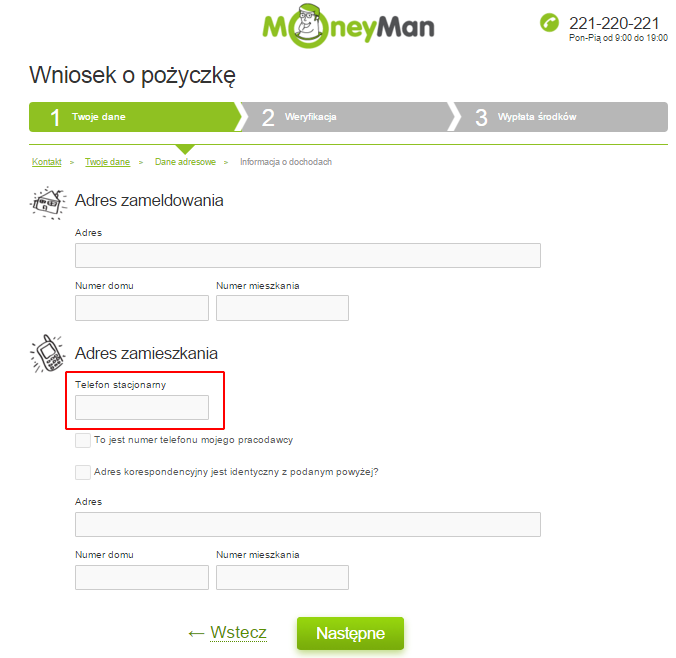
The problem is that a landline phone is a good tool to reach the customer (you can’t throw it out that easily, it is tied to an address, etc.). Therefore, as expected, in the variation without a phone, the return on credits dropped slightly.
Conversion grows, and collecting decreases. How in such a situation to understand which option is better? To answer this question, we had to model the unit economy of a loan in sufficient detail.
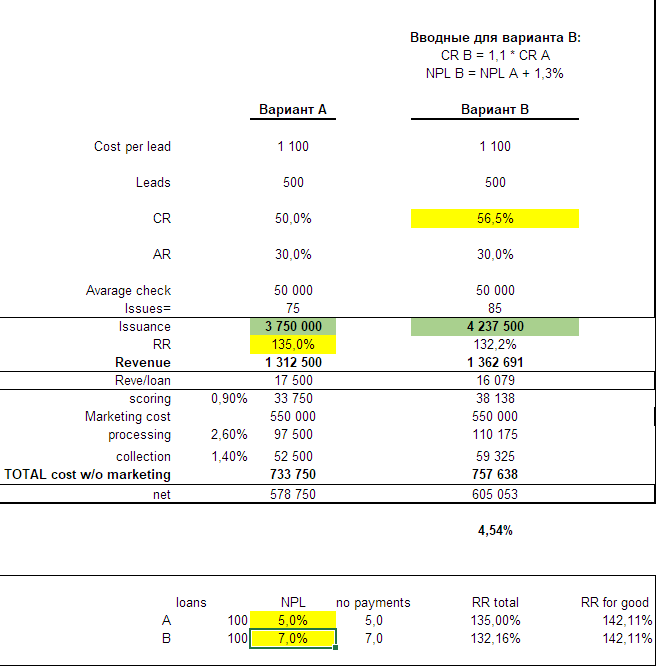
There are a lot of incomprehensible numbers in the picture above, and because of this, I believe, it illustrates well the level of complexity that we occasionally have to deal with, although it all started with such seemingly trifles as removing one field from one of the steps of the form.
In short, the economic effect comes down to the fact that an increase in conversion reduces the share of marketing expenses in the unit-economy, which compensates (or not) the decrease in profits due to the deterioration of customer contact. A bit of math, and we figured out which option is better. Although it took almost two months to wait for this - it was necessary to collect statistics on collection after the date of the 1st loan payment.
Forgotten customers
Once upon a time, one of the steps of registering a client on our Kazakhstan project looked like this:

We (just like you just) thought that this sheet is too long, and this can scare away morally unstable customers. An alternative option in the experiment was an interface in which each next block was shown only after successfully completing the previous one.
Conversion on the result increased, although not as much as we expected, and we switched the traffic completely to the new version. It would seem, happy end, the play is over and the curtain is down, but no.
After some time, we accidentally discovered that there are some users who are very poorly converted. When they began to understand, it turned out that these users visit some strange page that does not seem to be in a funnel. Although, wait a minute, somewhere I have already seen this URL ...
The fact is that the system worked in such a way that if the client didn’t go through all the steps of submitting an application and left the site, then came back and wanted to continue, he would go straight to that step, from which he left the last time. And I must say, there are quite a few such cases. When the experiment was played out, a part of the clients that fell into the control strategy did not immediately master the long version of the 2nd step. These users left the site at that moment, and then returned after the “end” of the experiment. And then the system, based on the experiment version that had been played out before, sent them again to the old version of the 2nd step. But after all, progress does not stand still, and soon the forgotten and unsupported old 2nd step simply ceased to be compatible with the back-end and stopped working normally. Poor clients were held hostage by obsolete code.
What did we do wrong here? We did not finish the experiment properly. In this case, at the end of the test it was necessary to ensure the migration of clients from the control group to the winning group, and, preferably, clean the legacy code.
Materiel
It's time to move from practice to theory. The structure of the test can be represented as follows:

Red is highlighted, in fact, that part of the life cycle, which is directly subject to change. Yellow is the part that, although it remains the same for everyone, but the experiment has a direct impact on it. Accordingly, in order to make a decision about the test result, we must analyze key metrics not only from the “red”, but also from the “yellow” parts. Then begins part of the path, the influence of the experiment on which, as we assume, can be neglected. But, after all, a test is a test to test assumptions, so you need to look at all the basic metrics too. The statistically significant differences between these metrics can mean any of this:
- We did not take into account any effect of the experiment - and then this metric must be taken into account when summing up the results.
- In the formulation of the experiment there is a mistake (maybe technical - arisen during implementation, maybe “ideological”, which arose at the design stage). This error lubricates the test results, and the bias is manifested by differences in metrics that should not differ. In such a sad situation, it is necessary to check whether we can still clear the data from the influence of an error — for example, select a sub-segment or a period of time, or examine not all the indicators we wanted. If it fails, the test will have to be restarted in the new edition.
Let's sum up. To correctly set up an experiment, it is necessary to answer a series of questions. Before it starts, of course.
- Why do we need this test. What we want to improve.
- What, in fact, is the improvement - the content of one or more experimental strategies.
- Who are we testing on? what segment of clients should get into the experiment.
- The point of entry into the experiment is the moment of the user's life path, when the experiment strategy is played out, and the ways of the users diverge, according to the dropout variant.
- The point of exit from the experiment is the moment of life, starting from which the user can again get into the same experiment (and get, for example, another option). A special case is a “life-long” test, when once the played version is assigned to the user until the end of the experiment.
- The intended effect of the experiment, and what metrics we will look at to measure this effect.
- Evaluation of this effect in positive and negative terms.
- Criteria for (non) success are the boundary values of metrics, with a statistically reliable intersection of which we can make a decision.
- The effect of this test on others, and others on this.
- Test duration and sample size required.
- The end of the test - how we will migrate the system and all users to a new reality.
- Suspending the test - if suddenly something goes wrong, can we suspend the test to clarify the circumstances and rolling corrections?
I hope that these examples and methods will help to improve the quality of experiments in your company as well.
Source: https://habr.com/ru/post/358228/
All Articles