Monitoring network traffic on servers in the cloud
In Mars IS, I am responsible for monitoring application performance. The main principle on which performance monitoring is based is a detailed centralized analysis of network traffic between end users and servers located in our data centers. It is carried out in real time and allows you to see an objective picture of the performance of both individual users and applications in general. Read more about our methods of monitoring and analysis here .
However, the world does not stand still and our company, following the general trend, begins to actively use cloud solutions. In particular, many of the applications are moved to servers in the cloud data center. This movement causes certain difficulties in my area and even jeopardizes the prospect of its existence.
In this article, I want to share how I managed to solve the problem of centralized collection and analysis of network traffic on servers located in cloud data centers. I think the result may be useful in other IT areas where there is a need for centralized collection and analysis of network traffic.
The traffic of interest to us is removed from the SPAN ports of the edge switches between remote users and data center servers (see Figure 1)
')
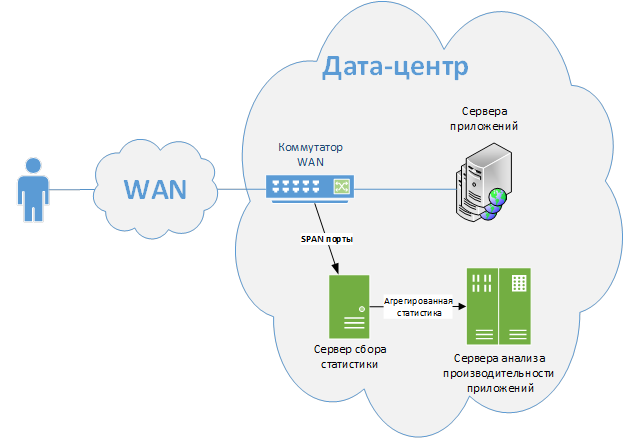
Picture 1
The SPAN port reflects all user traffic on a given VLAN to the statistics collection server. There is a recognition of individual applications, user operations and the users themselves, as well as measuring many parameters of their performance. The collected data is aggregated and transmitted to the server for further analysis. The same servers provide access to statistics to support teams and are responsible for generating alerts about the unacceptable performance of an application.
The monitoring system described above is conveniently configured as long as we have access to the network infrastructure of the data center. The method stops working as soon as the application moves to the cloud. Installing physical servers for collecting statistics in the cloud and setting up SPAN ports there is a costly and difficult task. Meanwhile, support teams prefer to deal with a single monitoring system for both applications inside the data center and those located in the cloud.
After evaluating the standard methods of solving problems provided by third-party companies, I realized that none of them suits me. It is standardly proposed to assemble the structure shown in Figure 2.

Figure 2
The virtual front-end servers are installed with vTAP (virtual network tap device) agents, which read and send all traffic to the statistics collection server via GRE tunnels. There is another standard solution based on the means of the virtual environment itself (for example, using Hyper-V technology). These are acceptable approaches, but they are very far from the optimal solution.
First , we need to install an additional statistics collection server on a virtual machine in the cloud, while the existing statistics collection servers inside our data centers have a significant reserve of unused capacity. Of course, it would be possible to terminate GRE tunnels directly on them, but there is no guarantee that the collected traffic will not overflow the capacity of the communication line between our data center and the cloud. Although the solutions make it possible to filter statistics on vTAP agents, there are no convenient mechanisms to control the speed of the flow created. That is, an error in the configuration of the filter can lead to disastrous consequences for the entire infrastructure.
Secondly, you need to create a separate tunnel for each application server. Managing a large number of GRE tunnels is an additional task and will require considerable attention with support.
Third, system requirements for installing vTAP agents are surprising. One of the leading manufacturers requires 4Gb of RAM and takes one CPU core. These requirements are not comparable with the complexity of the problem being solved. In addition, you need to take care of hosting the server to manage this solution.
Fourth, annually you need to pay for each vTAP agent. Therefore, the cost of the solution becomes too high for mass implementation.
Comparing all this with our current situation, I decided to act in accordance with my favorite rule: “I don’t like the way it is - do it right”. Having spent about two weeks on development, I managed to create my own analog vTAP - easy, convenient, and most importantly, able to control the generated data stream. I called it - ivTAP: Intellectual Virtual TAP device.
The principle of operation of ivTAP is shown in Figure 3.

Figure 3
On each of the servers where it is necessary to analyze the network statistics, the client part of the application is installed - ivTAPclient. She does a fairly simple job. Using the BPF network driver and the libpcap / winpcap library, it scans the network packets with the specified filter and sends them to the server side of the application - ivTAPsrv, having previously packed them into the UDP channel. Each channel is monitored for exceeding the maximum permissible speed.
The server part of the application extracts packets from the UDP channel and “slips” them into any of the SPAN ports interfaces already in use. The network statistics collection server receives and processes these packets along with those that were removed from the switch port SPAN in the usual way.
The result is a product that solves the task and satisfies our requirements:
Here is a list of tools and libraries that I used to create ivTAP:
- Eclipse Java EE IDE. Actually, on what the product was created;
- Winpcap / libpcap;
- Library jnetpcap. A project foundation that implements libpcap / winpcap access from Java;
- Library kohsuke.args4j. Handles a single program launch argument;
- Free service-wrapper for Windows, so that the product was convenient to work;
In order for further material to be useful to you, I recommend to stop at this place and get acquainted with the description of the jnetpcap library. I see no reason to rewrite the basic principles of working with this library here, as well as provide a full listing of the program. It would be more reasonable to limit the demonstration of several of the most important and interesting excerpts. Immediately make a reservation: I am not a professional programmer. I apologize in advance if any code fragment will cause resentment from dear readers.
In general, the concept looks as shown in Figure 4:

Figure 4
The client part of the program implements the class: IVTAP. The first thing he does in void main () is to check for the presence of the "–l" key in the launch arguments. This key is used only once to prepare the first run of the program. It displays the names of all network adapters available on this front-end server. For further work, we will need to select the adapter from which we want to collect statistics and specify it in the program configuration file. The method is an easy modification of the example provided on the jnetpcap website (see Listing 1).
Listing 1
As a result, we get a list of device names available for removing statistics from their MAC and IP addresses. Select the device we are interested in and specify it in the ivTAPclient.properties configuration file:
Listing 2
In addition, the configuration file contains a BPF filter for the traffic of interest to us, the address and port of the server part of the application ivTAPsrv, the maximum allowed transmission rate (in bits per second), the interval for checking this speed (in seconds), and the maximum allowable number of consecutive violations speedLimit required to stop the program in order to avoid overflow of the WAN communication line. In this example, the program will end its work if, for six consecutive measurements made with a 10-second interval, the transmission speed will be higher than 2 Mbps.
The program provides for the creation of an infinite loop recording network packets:
Creating an instance of pcapIn: Pcap is nothing special, except for the timeout parameter. I set it in 10 milliseconds, which gives the additional error described above. Ideally, it would be good to do without a timeout altogether, but this may conflict with the basic principles of libpcap / winpcap. The documentation says that setting zero translates Pcap into a mode where data is not transmitted until the entire write buffer has been filled. The magnitude of this delay is controversial and is taken more likely from my ideas about the operation of the system as the smallest of the safe ones.
Before creating an infinite write loop, you need to take care of the description of the processor of each recorded packet (see Listing 3).
Listing 3
It's simple: we read the package and send it via udpChannel to the server side of the ivTAPsrv application. On the server side, on the contrary: we receive a packet via UDP, send it to the specified network interface using the sendPacket function (see Listing 4).
Listing 4
Another important point that needs to be taken into account is the creation of program exit handlers. Since the client and server parts of the application use infinite loops, you need to register a ShutdownHook for the corresponding streams and close all open devices, sockets and child threads there.
The functional load control on the communication line is implemented on the client part of the ivTAPclient application in a separate thread. At regular time intervals defined in the configuration file, this stream checks the amount of data transferred per unit time. When the boundary conditions are reached, he simply stops recording and closes the program, making the appropriate notes in the log.
Using a similar approach for the removal and centralized analysis of network traffic, you need to take into account some of the limitations that it imposes:
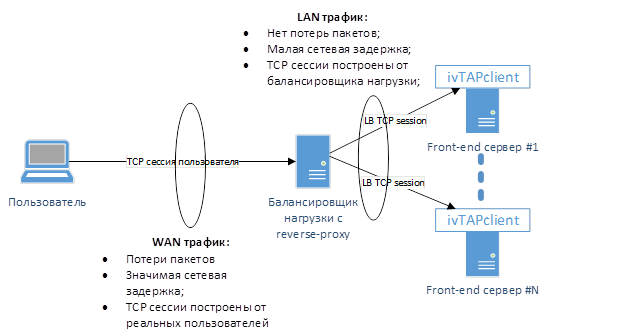
Figure 5
Security issues of the applied solution were raised more than once during our internal discussions. On the one hand, we are actually duplicating user traffic, which could potentially contain important commercial information. Thus, having access to the reflected traffic, an attacker could potentially decipher it. On the other hand, this reflected flow passes through internal protected communication lines. If we assume that the attacker has access to them, then in his arsenal there are already more simple and universal methods of obtaining the desired information.
In any case, there are many relatively simple ways to encrypt transmitted data by slightly modifying the packet-packing algorithm on the UDP channel. They should be used if we for some reason do not trust our lines of communication.
Despite a series of successful implementations, I'm not going to stop there. There are a number of necessary improvements that will help translate this development into the category of enterprise applications.
First of all, you need to add monitoring and notification of abnormal conditions on ivTAPsrv, while avoiding the excessive complexity of the logic of the client part of the application. In particular, I would like to avoid the need for feedback from ivTAPsrv to ivTAPclient. To do this, it will be sufficient to periodically build control packets into the stream of transmitted data. They indicate the amount of information read and the time of sending this control package. Thus, on the ivTAPsrv server, it would be possible to detect abnormal outages of the ivTAPclient agents, estimate the temporal error or loss of UDP statistics packets. You can also create a web-based management interface for ivTAPsrv without overloading it. And the code itself certainly needs a fresh look and optimization in accordance with industry standards for programming.
The experience of creating this product has allowed me to take a fresh look at my capabilities and at what large companies offer to clients. Sometimes the right choice is to spend a relatively short amount of time and learn something new to create the right solution for yourself rather than buying a less convenient solution spending significant resources on implementation and support.
However, the world does not stand still and our company, following the general trend, begins to actively use cloud solutions. In particular, many of the applications are moved to servers in the cloud data center. This movement causes certain difficulties in my area and even jeopardizes the prospect of its existence.
In this article, I want to share how I managed to solve the problem of centralized collection and analysis of network traffic on servers located in cloud data centers. I think the result may be useful in other IT areas where there is a need for centralized collection and analysis of network traffic.
Basic monitoring configuration
The traffic of interest to us is removed from the SPAN ports of the edge switches between remote users and data center servers (see Figure 1)
')
Picture 1
The SPAN port reflects all user traffic on a given VLAN to the statistics collection server. There is a recognition of individual applications, user operations and the users themselves, as well as measuring many parameters of their performance. The collected data is aggregated and transmitted to the server for further analysis. The same servers provide access to statistics to support teams and are responsible for generating alerts about the unacceptable performance of an application.
Monitoring configuration for servers in the cloud
The monitoring system described above is conveniently configured as long as we have access to the network infrastructure of the data center. The method stops working as soon as the application moves to the cloud. Installing physical servers for collecting statistics in the cloud and setting up SPAN ports there is a costly and difficult task. Meanwhile, support teams prefer to deal with a single monitoring system for both applications inside the data center and those located in the cloud.
After evaluating the standard methods of solving problems provided by third-party companies, I realized that none of them suits me. It is standardly proposed to assemble the structure shown in Figure 2.
Figure 2
The virtual front-end servers are installed with vTAP (virtual network tap device) agents, which read and send all traffic to the statistics collection server via GRE tunnels. There is another standard solution based on the means of the virtual environment itself (for example, using Hyper-V technology). These are acceptable approaches, but they are very far from the optimal solution.
First , we need to install an additional statistics collection server on a virtual machine in the cloud, while the existing statistics collection servers inside our data centers have a significant reserve of unused capacity. Of course, it would be possible to terminate GRE tunnels directly on them, but there is no guarantee that the collected traffic will not overflow the capacity of the communication line between our data center and the cloud. Although the solutions make it possible to filter statistics on vTAP agents, there are no convenient mechanisms to control the speed of the flow created. That is, an error in the configuration of the filter can lead to disastrous consequences for the entire infrastructure.
Secondly, you need to create a separate tunnel for each application server. Managing a large number of GRE tunnels is an additional task and will require considerable attention with support.
Third, system requirements for installing vTAP agents are surprising. One of the leading manufacturers requires 4Gb of RAM and takes one CPU core. These requirements are not comparable with the complexity of the problem being solved. In addition, you need to take care of hosting the server to manage this solution.
Fourth, annually you need to pay for each vTAP agent. Therefore, the cost of the solution becomes too high for mass implementation.
Our method
Comparing all this with our current situation, I decided to act in accordance with my favorite rule: “I don’t like the way it is - do it right”. Having spent about two weeks on development, I managed to create my own analog vTAP - easy, convenient, and most importantly, able to control the generated data stream. I called it - ivTAP: Intellectual Virtual TAP device.
The principle of operation of ivTAP is shown in Figure 3.
Figure 3
On each of the servers where it is necessary to analyze the network statistics, the client part of the application is installed - ivTAPclient. She does a fairly simple job. Using the BPF network driver and the libpcap / winpcap library, it scans the network packets with the specified filter and sends them to the server side of the application - ivTAPsrv, having previously packed them into the UDP channel. Each channel is monitored for exceeding the maximum permissible speed.
The server part of the application extracts packets from the UDP channel and “slips” them into any of the SPAN ports interfaces already in use. The network statistics collection server receives and processes these packets along with those that were removed from the switch port SPAN in the usual way.
The result is a product that solves the task and satisfies our requirements:
- The product does not pose an additional threat to either the application servers or the network statistics collection system: it does not consume significant resources (CPU <1%; RAM <= 512Mb) and does not create uncontrolled load emissions on the WAN communication line;
- This method of removing statistics does not add a significant error to performance measurements. At each time, the maximum error is determined by the value of network jitter + 10ms on the side of ivTAPclient;
- The program works steadily for a long time;
- ivTAPclient runs as a normal service on Windows servers and does not depend on the configuration of the front-end server environment;
- The traffic reflected by ivTAP is perceived by the statistics collection server in the same way as received by the regular way through the SPAN port;
- The program does not violate any license agreements: all manipulations are performed at the level of the operating system, without regard to the service of collecting and processing network packets;
- When creating the program, only those libraries that allow free commercial use were used - LGPL, MIT, Apache v2.
Here is a list of tools and libraries that I used to create ivTAP:
- Eclipse Java EE IDE. Actually, on what the product was created;
- Winpcap / libpcap;
- Library jnetpcap. A project foundation that implements libpcap / winpcap access from Java;
- Library kohsuke.args4j. Handles a single program launch argument;
- Free service-wrapper for Windows, so that the product was convenient to work;
In order for further material to be useful to you, I recommend to stop at this place and get acquainted with the description of the jnetpcap library. I see no reason to rewrite the basic principles of working with this library here, as well as provide a full listing of the program. It would be more reasonable to limit the demonstration of several of the most important and interesting excerpts. Immediately make a reservation: I am not a professional programmer. I apologize in advance if any code fragment will cause resentment from dear readers.
In general, the concept looks as shown in Figure 4:
Figure 4
The client part of the program implements the class: IVTAP. The first thing he does in void main () is to check for the presence of the "–l" key in the launch arguments. This key is used only once to prepare the first run of the program. It displays the names of all network adapters available on this front-end server. For further work, we will need to select the adapter from which we want to collect statistics and specify it in the program configuration file. The method is an easy modification of the example provided on the jnetpcap website (see Listing 1).
private static void listDevices() { List<PcapIf> alldevs = new ArrayList<PcapIf>(); // Will be filled with NICs StringBuilder errbuf = new StringBuilder(); // For any error msgs int r = Pcap.findAllDevs(alldevs, errbuf); System.out.println("List available interfaces and exit"); if (r == -1 || alldevs.isEmpty()) { System.err.printf("Can't read list of devices, error is %s", errbuf.toString()); return; } Iterator<PcapIf> itrdev = alldevs.iterator(); while(itrdev.hasNext()) { PcapIf device = (PcapIf)itrdev.next(); StringBuilder sb = new StringBuilder(); sb.append(device.getName()); sb.append(";"); sb.append((device.getDescription() != null) ? device.getDescription() : "No description available"); sb.append("; MAC address:"); try { if (device.getHardwareAddress() != null) { byte[] mac = device.getHardwareAddress(); for (int i = 0; i < mac.length; i++) { sb.append(String.format("%02X%s", mac[i], (i < mac.length - 1) ? "-" : "")); } } else { sb.append("No MAC address"); } } catch (IOException e) { System.err.printf("Can't read MAC address"); } sb.append("; IP address(es):"); List<PcapAddr> addrs = device.getAddresses(); Iterator<PcapAddr> itraddr = addrs.iterator(); while(itraddr.hasNext()) { PcapAddr pcapAddr = (PcapAddr)itraddr.next(); sb.append(pcapAddr.getAddr().toString()); } System.out.printf("%s\n", sb.toString()); } return; } Listing 1
As a result, we get a list of device names available for removing statistics from their MAC and IP addresses. Select the device we are interested in and specify it in the ivTAPclient.properties configuration file:
sIntName=\\Device\\NPF_{7B767B766-A093-46CD-8000-EEEEEFFFFF88} filterString=tcp port 80 srvAddr=<ivTAPsrv IP address> srvPort=< ivTAPsrv UDP channel port number> speedLimit=2000000 bandwidthCheckInterval=10 bandwidthBreachIntervals=6 Listing 2
In addition, the configuration file contains a BPF filter for the traffic of interest to us, the address and port of the server part of the application ivTAPsrv, the maximum allowed transmission rate (in bits per second), the interval for checking this speed (in seconds), and the maximum allowable number of consecutive violations speedLimit required to stop the program in order to avoid overflow of the WAN communication line. In this example, the program will end its work if, for six consecutive measurements made with a 10-second interval, the transmission speed will be higher than 2 Mbps.
The program provides for the creation of an infinite loop recording network packets:
pcapIn.loop(-1, jpacketHandler, "ivTAP"); Creating an instance of pcapIn: Pcap is nothing special, except for the timeout parameter. I set it in 10 milliseconds, which gives the additional error described above. Ideally, it would be good to do without a timeout altogether, but this may conflict with the basic principles of libpcap / winpcap. The documentation says that setting zero translates Pcap into a mode where data is not transmitted until the entire write buffer has been filled. The magnitude of this delay is controversial and is taken more likely from my ideas about the operation of the system as the smallest of the safe ones.
Before creating an infinite write loop, you need to take care of the description of the processor of each recorded packet (see Listing 3).
public class PHandler<T> implements PcapPacketHandler<String> { //Avoid excessive instantiations within endless loop private Tcp tcp = new Tcp(); // Preallocate a Tcp header private Ip4 ip = new Ip4(); // Preallocate a IP header private int size; @SuppressWarnings("unused") private T user; private static Logger log = Logger.getLogger(PHandler.class.getName()); public PHandler(T user) { this.setUser(user); } public void setUser(T user) { this.user = user; } @Override public void nextPacket(PcapPacket packet, String user) { if (packet.hasHeader(ip) && packet.hasHeader(tcp)) { if (log.isLoggable(Level.FINE)) { log.fine("Received packet len=" + String.valueOf(packet.getCaptureHeader().wirelen()) + " source_IP=" + FormatUtils.ip(ip.source()) + " source_port=" + String.valueOf(tcp.source()) + " destination_IP=" + FormatUtils.ip(ip.destination()) + " destination_port=" + String.valueOf(tcp.destination())); } //preparing to send size = packet.size(); ByteBuffer byteBuffer = ByteBuffer.allocate(size); packet.transferTo(byteBuffer); IVTAP.bytesTransferred += size; if (IVTAP.bytesTransferred >= 8000000000000000000L) { IVTAP.bytesTransferred = 0L; } //sending UDP byteBuffer.flip(); try { IVTAP.udpChannel.send(byteBuffer, IVTAP.dstaddr); } catch (IOException e) { log.log(Level.SEVERE, "Exception: ", e); } } } } Listing 3
It's simple: we read the package and send it via udpChannel to the server side of the ivTAPsrv application. On the server side, on the contrary: we receive a packet via UDP, send it to the specified network interface using the sendPacket function (see Listing 4).
try { DatagramSocket listener = new DatagramSocket(bindsocketaddr); try { DatagramPacket udppacket = null; System.out.println("waitnig for packets..."); byte[] message = new byte[65536]; udppacket = new DatagramPacket(message, message.length); while (true) { try { listener.receive(udppacket); if (pcapOut.sendPacket(udppacket.getData(),0,udppacket.getLength()) == -1) { System.err.println(pcapOut.getErr()); if (pcapOut.getErr().equals("send: Message too long")) { System.err.println("Disable TCP segmentation offload at the source interface"); } return; } } catch (IOException e) { e.printStackTrace(); } } } finally { listener.close(); } } catch (SocketException e) { e.printStackTrace(); } Listing 4
Another important point that needs to be taken into account is the creation of program exit handlers. Since the client and server parts of the application use infinite loops, you need to register a ShutdownHook for the corresponding streams and close all open devices, sockets and child threads there.
The functional load control on the communication line is implemented on the client part of the ivTAPclient application in a separate thread. At regular time intervals defined in the configuration file, this stream checks the amount of data transferred per unit time. When the boundary conditions are reached, he simply stops recording and closes the program, making the appropriate notes in the log.
Using a similar approach for the removal and centralized analysis of network traffic, you need to take into account some of the limitations that it imposes:
- We actually double the load on the communication line created by users of the measured systems. Although the front-end traffic of individual applications is usually not large (I almost always have a limit of 2 Mbps), I need to take care of checking the free bandwidth from the cloud to the data collection server located in your data center.
- If the network jitter between ivTAPclient and ivTAPsrv exceeds the required measurement accuracy threshold, you will not be able to use this solution.
- On the front-end server where ivTAPclient is installed, you need to turn off network offload. Otherwise, the material you have collected will be significantly distorted.
- Traffic removed from the SPAN port falls into the receiving queue of network adapter packets (Rx). IvTAPsrv traffic can only be added to an outgoing queue (Tx). I still could not solve the ivTAPsrv packet forwarding task in the Rx queue. Using libpcap / winpcap, it is not solved; you need to rewrite the network driver. On the other hand, this means that if the server uses standard network drivers, then the third-party statistics collection service will receive data from both queues. D
- If there is a reverse-proxy between the user and the front-end server (for example, on the load balancer), then in the analyzed traffic you will not see the real TCP session of users. Accordingly, it will not be possible to measure their network metrics (see Figure 5)
Figure 5
Security
Security issues of the applied solution were raised more than once during our internal discussions. On the one hand, we are actually duplicating user traffic, which could potentially contain important commercial information. Thus, having access to the reflected traffic, an attacker could potentially decipher it. On the other hand, this reflected flow passes through internal protected communication lines. If we assume that the attacker has access to them, then in his arsenal there are already more simple and universal methods of obtaining the desired information.
In any case, there are many relatively simple ways to encrypt transmitted data by slightly modifying the packet-packing algorithm on the UDP channel. They should be used if we for some reason do not trust our lines of communication.
Perspectives and conclusions
Despite a series of successful implementations, I'm not going to stop there. There are a number of necessary improvements that will help translate this development into the category of enterprise applications.
First of all, you need to add monitoring and notification of abnormal conditions on ivTAPsrv, while avoiding the excessive complexity of the logic of the client part of the application. In particular, I would like to avoid the need for feedback from ivTAPsrv to ivTAPclient. To do this, it will be sufficient to periodically build control packets into the stream of transmitted data. They indicate the amount of information read and the time of sending this control package. Thus, on the ivTAPsrv server, it would be possible to detect abnormal outages of the ivTAPclient agents, estimate the temporal error or loss of UDP statistics packets. You can also create a web-based management interface for ivTAPsrv without overloading it. And the code itself certainly needs a fresh look and optimization in accordance with industry standards for programming.
The experience of creating this product has allowed me to take a fresh look at my capabilities and at what large companies offer to clients. Sometimes the right choice is to spend a relatively short amount of time and learn something new to create the right solution for yourself rather than buying a less convenient solution spending significant resources on implementation and support.
Source: https://habr.com/ru/post/358116/
All Articles