Your A / B tests are broken.
After you check that the functionality is implemented normally, it rolls out into the experiment to find out if the users like the new version.
Have you noticed that usually people who are responsible for experiments, as a result, say that there is not enough data to solve? Often this is true, but often it’s all a matter of breakdowns in the system of experiments and accounting of user statistics.
In this article we will look at typical breakdowns that occur there, and you will have the opportunity, returning to the workplace, to be a little data scientists and find errors in your company. Some of them are probably there.
')
The material is based on the transcript of the report of Roman Poborechy from our December conference Heisenbug 2017 Moscow.
A few years ago I worked at Yandex, where I worked, in particular, on user behavior metrics and user experiments; Most of my experience on this topic comes from there.
First, let us recall an example from the history: 2007, a button on the Microsoft Office page: what will happen if you make a slightly different button, but next to write a price - maybe they will click more there? Zadizaynili this page:

And it’s scary: Office is a rather expensive product, it brings a lot of money, and you want to do it so carefully that you don’t lose this money at once. Split tests (A / B tests) are carried out: when we select a group of users and show them the new version, and another group the old one, then we compare the results. In our example about Microsoft Office - do you think it is more or less clicked in the new version? In the new version, the “Buy” button was clicked less. Hence the first message - error number 0.
Do you have an A / B testing system in your company? Cool, but it is probably broken in several typical ways, which we will now disassemble. How you can use this material: you can come to your job, talk to people who use the A / B test system, ask some simple questions and point out mistakes. Or, if you ever have to test such a system, then you will know these few typical tests.
People who do not do such tests usually say: “What can be so complicated here?” It is necessary (1) to divide users into groups, then (2) each user should show something of their own, then (3) calculate the results and see who is better - in roll production. To this I want to say: the world is very simple, it stands on three elephants, at the top of Sagarmathi (Russian Everest) Shiva sits, there are commandments, and it is clear to everyone what to do.

In fact, in each of the three points you can nakosyachit. Today we will talk about the last of them: counting the results.
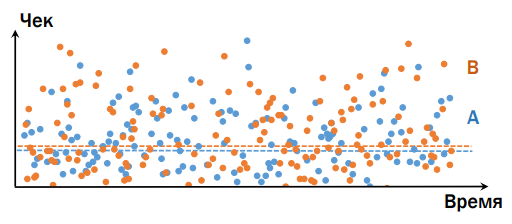
For example, imagine that there is an online store, and we want to conduct an experiment. A naive idea: we take Time (for convenience), ( y ) along the axis ( x ) - a check (that is, what people bought in the end), and we will have option A and option B - below the graph shows that option B it is better.

In reality, everything is different. Take a product that is interesting to everyone, regardless of the budget (for example, food), and imagine that there are two clients: rich and poorer. Suppose that the version presented in group B is better than in A. Consumption in A and B for these two users is different, the following is important: the rich, coming to the “bad” group, will bring much more money than the second client, who I bought a version from a “good” group (except for the absolutely terrible cases, when in both versions something is broken so much that nothing works at all). A person depends much more on his own habits than on some minimal changes on our service. Therefore, unfortunately, the picture is as follows - it is difficult to determine which of the options is better / worse, even comparing the average value:
The fact is that there are not so many people who came to us during the experiment. Our task is to determine by these users what will be better or worse for all. The classic problem of statistics: we can not see the full set, we are trying to make a forecast for a small sample. It turns out that the world is much more complex than we assume.
(I’ll note that I will refer to the statistics in the future, but I will try to explain everything on my fingers so that people with different experiences can easily keep track of what is happening; in-depth knowledge of statistics is not required)
So, in order to determine from a small sample whether there is a difference on a large set, we use statistical tests (criteria). This is a function to which we transfer data, and we get a result in response. We usually transfer all the data that is (not only the average, but the entire array of data from which this average value was taken); answers are given in terms of probability (for example, there is a difference with the probability of XX%). Usually people stop at 95% or more; if less than 95%, then it is considered that there is no difference, and the results of the experiment are not recognized.
It is important that the tests are developed in such a way that when there is certainly no difference, they are mistaken with this probability, otherwise they cannot be calibrated. For example, we will carry out an A / A test - we will launch two completely identical results both in the experimental and control groups of users. If we work with a significance of 95%, the result is interpreted as follows: if the result is within 95%, there is no difference; the remaining 5% - there is a difference.

The result of 5% seems small, but it is important. To understand why, let's look at the Google conflict story when Doug Bowman was the Chief Designer, and Marissa Mayer was in charge of the company's products.

Doug Bowman, Marissa Mayer
What happened: there is Google Mail, there are sponsored links. There was an interesting task: let's make a slightly different color of links, and they will click more on them. (Has anyone clicked on an advertisement in the mail at least once? I didn’t click either. Apparently, the guys still have a problem and need to do something) Marissa: "Let's try forty-one shades of blue." Doug: "Everything, I refuse to take part in this outrage." And he quit, rather because of design considerations, rather than mathematical ones, although mathematically he was also somewhat right. Let's see what happens if you do forty-one tests. What is the probability that the test will never fail (it will give an honest result - if there really is no difference, then the result will show it):
And so on. When we conduct forty-one experiments, the probabilities multiply again, and the probability that the test never fails 41 times is only 0.12, i.e. with 88% probability, at least one “shoots” and says “yes, there is a difference, this shade of blue is cool!”, when in fact it is not true.

In this regard, go to error number 1 (Recall: No. 0 - do not have A / B tests at all and immediately roll everything into production): sort through the parameters of the hands of users. That is, instead of investigating and inventing the hypothesis “what will be better and what is worse,” everything is sent to the experiment in the hope that something from this will “shoot” (without thinking that any of this can “Shoot” by chance).

Google is big, it has a lot of data, it can be considered more likely (95% vs. 99% and 99.9%). So, theoretically, it is possible to conduct 41 experiments: if not one “shoots”, then everything is likely to be normal. Who is right, Marris or Doug? In the case of conventional services that do not have billions of users, it is wasteful to conduct many experiments with a probability of 99.9%. What does the criterion answer depend on? From a few things.
First, the scatter of data. The better they are grouped around (see Fig. A), for example, their average, the more confident the test will be to say that one version has a better difference than the other. Otherwise (Fig. B) ), more data is required to get the same degree of confidence.
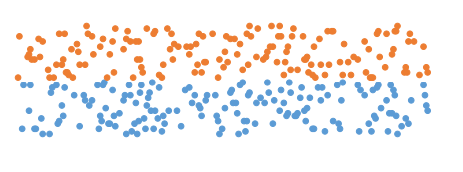
Fig. but)
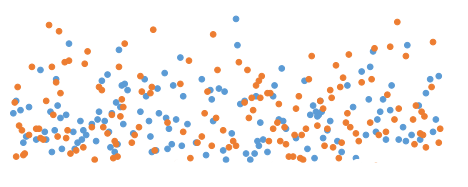
Fig. b)
There is a spread of data. Most likely, we cannot influence it, because it depends on our users, the structure of our service, and we cannot do anything about it quickly. Secondly, the response of the criterion depends on the difference we want to detect. If we have done something very good (or bad, it is made easier and, therefore, more often) - the difference is big, and existing users will, on average, generate this big difference. Then we need a smaller amount of data, but nevertheless, the last parameter is the amount of data that we send to the criterion. Obviously, we can regulate the difference in the quality of our work (better work - more difference :)). The amount of data is governed by how many users we throw into the experiment, and it is limited to 100% (ie, 50% is the control group, 50% is the experiment). I note that sometimes it is possible to keep the experiment longer - not a day / week, but a month - then more data will accumulate (but this does not work for all metrics). There is a dependency between the difference we see and the amount of data we need to do this - this is a fundamental law, regardless of what statistical criterion we use.
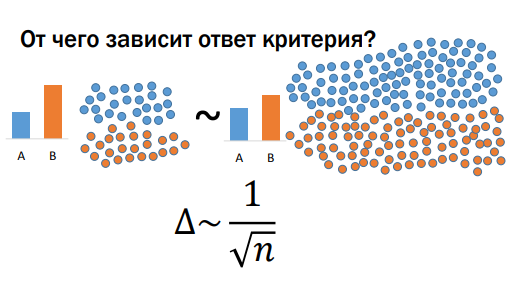
For example, if the delta is two times less than in the first case, then in order to notice it with the same degree of confidence, we need four times more data (since the square root). What is bad? The simplest things (payment buttons, recommendations, etc.) we, as a startup of 2-3 people, manage to do quickly. Then the service becomes relatively stable, and it’s difficult to make powerful changes there, and besides, we continue to grow, many developers appear (everyone generates something, wants to send something to the experiment), and at a pace when we have a square, We very quickly end an important resource - users. Everything is crammed with experiments in our country, sometimes we put them in several layers, and still the line of people who want to launch something into the experiment stretches right up to the horizon. This is the first thing to be understood. The second thing is illustrated by the following example.
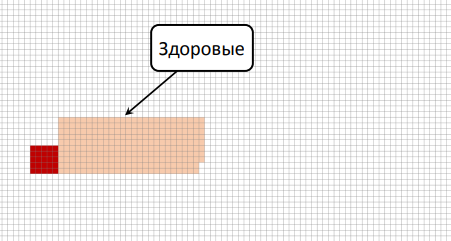
If you ever retrain in a data scientist , then know that this task is set at the first interview. Let us analyze it graphically (there will be no more formulas). Suppose there is a dangerous disease; 0.5% of people are sick with it (according to statistics); there is a test that determines this disease with an accuracy of 95% (in both directions, with a probability of 95%, it gives the correct result and 5% gives the wrong result; it does not matter whether the person is healthy or sick). Consider the option: the test is positive, is it necessary to be sad? We decide graphically: each cell is a person, of which about 0.5% is sick (a dark red cell, we group them for convenience).
Important: the test that we run on them can sometimes be statistically wrong. This situation was a long time with tests for AIDS: they worked with such accuracy that the percentage of patients was much less than the percentage of errors, and therefore it was necessary to carry out the test several times to be sure (very often a positive result for the first time was an error).
Let's return to our experiment about “shades of blue”. Some say, "Let's test forty-one shades of blue." The product owner picks up: "They told me here that rounded buttons are better than square ones, let's test them." One more: “Let's play with fonts”. And the worst of what I have seen is what they do with recommender systems.

We have content, and we additionally recommend something else (for example, to watch a product / video, etc.), usually it is based on machine learning (this is a random process). People come and say: “Let's run a few times. Let's put a different seed on this random process and see if it comes together in different ways, and one of these options suddenly turns out to be better than the rest. ” And so forty-one times ("shades of blue"). If we have many such experiments, then we understand that among them, if there will be, there are very few really successful ones; most will be about the same. Then we will come to a situation where the number of randomly tested tests is approximately equal (if not more) to the number of “really good”. And we still do not notice all of them: for example, if the test is good, but the difference is small, then we can say that there is no difference. What is worth doing? We always know from the construction of the test how many random alarms are there (if 95%, then 5% should be random); You can go and find out from employees what percentage is completed with success / failure, effectively. If they say that only 10% (and we know that 5% is random), then we conclude: half of what is being rolled into production is random trash.
It is better to conduct an experiment based on the results of your research, formed from third-party sources, the hypothesis that is better for users. For example, once in Yandex, we tested a hypothesis about search results, about so-called “stupid answers” (the query is “ Leo Tolstoy ”, one of the search results is “ colon cancer ”). Invented a method by which you can separate and hide such "stupid answers." The result was discouraging: users are not better from this, but this is the subject of a separate discussion.
Let's go back to the example with the button and the specified price for Microsoft Office. I have a hypothesis: the company is big, there is a lot of money (financial indicators can be hidden, inaccessible for the experiment, that is, you can look at the statistics of clicks, but don’t know how much money it brings). Having received the first negative result, they did not stop at this experiment.
I want to warn you: when I had a bad experiment (I did, I tried, I rolled out - they say that the users didn’t like it), I start looking for bugs (including in the experiment system) as a feature owner , until I I am rehabilitating my idea or until I come to the conclusion that "there really is no ore there." So, in the opposite direction it does not work that way: I did something, and from the first time it shows a profit (“Hurray! In production, sold!”) - I am not looking for these bugs / errors that may be there. There is some bias in it.
Microsoft didn’t calm down either: they found that they click on the button with the specified cost less, but there is a more complicated process behind it (insert a card, etc.) and buy more; it turned out that the cumulative amount of money it brings made a difference of several tens of millions of dollars. From here follows another important point: you need to choose which indicator to look at.
Indicators in the experiment can be many, you must choose the right one. It would seem that you only have to look at the money, is it logical? It depends on the monetization model: “ direct ” (users come with money and get something for it, for example, an online store, stock) or “ indirect ”. When indirect monetization occurs, the following happens: users come for some shareware content, and while they are watching this shareware content, we catch some of them, drag them into a dark basement, disassemble them into organs, sell organs. According to this model, search engines, entertainment portals, social networks work, that's all. The more advertising, the more money you can get in the moment, but at the same time users can stop visiting such sites - short-term money vs. long-term money: reduced food supply, and everything becomes bad. What happens with LiveJournal / LiveJournal: the service is dying, let's hang up more advertising to make up for the loss of money, but from this the service dies even faster. There are also "working" sites: there are employers who pay for the database, advertising, and there are job seekers who work for free. And to applicants to keep them, you need one thing, and employers - something else.
In general, difficult life for those who have an indirect model of monetization - what should they look at, only for money? Of course, the money should not be squandered, but you can’t just maximize them, because now we will get rich, and then everything will end. At this point, we notice that the world is rather complicated - we have to somehow measure the user base. For example, there are such indicators to measure:
There are other indicators. The problem with the immediate metrics of the user base (if you exaggerate the situation) - they never change. Of course, you can make such a change that you will immediately see that user loyalty has increased, but it is difficult.
So we come to technical metrics - something that can be easily calculated. For example, clicks (users began to click more, which is probably good). Nothing worth dragging clicks from one place to another on the page; click-through-rate (aka CTR) - showing the button / form; there are cases where the user has seen, but did not interact with it, but there is, when interacted. This is the percentage of cases when people saw an element (for example, a button) and began to do something with it. If we are talking about video and recommendations, there is such a good indicator as to the depth (percentage) of viewing , i.e. if the video takes 2 minutes, and the user watched 1.5 minutes, then the viewing depth is 75% (if you’ve watched it to the end - 100%); time to click (strongly depends on whether we make large or small snippets) and others. Most of these metrics stumble upon such a terrible thing called the Central Limit Theorem (CLT). I will not formulate it, only one point is important for us, which everyone has forgotten about. Most of the statistical criteria are based on the CLT; they assume that its conditions are correct. One of the conditions is as follows: the measurements that we put in the data array must be independent of each other. What does it mean? In order to demonstrate dependence and independence, now in practice, find out what it is, on volunteers :)
We will measure the distribution of eye color: according to 1909, most people in Russia at that time had gray eyes, the second most common color was brown, then blue, blue, green and black. By the way, there are people with an exotic eye color, for example, “swamp”, but they will not include our example. We put in front of an audience of two volunteers, Stas and Philip. We place bets on what color of their eyes. We assume that the gain is equal to the frequency. We find out - Stas has gray eyes (the statistics do not lie!). And Philip? Also gray. After we learned what color Stas' eyes were, did we want to somehow change our rate relative to the color of Philip's eyes? Probably not, because what's the difference? Actually, this is an example of independent measurements.
Suppose there are 2 girls, twin sisters, nonidentical.

Let's make a bet, who has what color eyes. Made?
Now the trick: let's color the first girl.

In one, as we see, blue. The question is, do we now want to change our bet regarding the color of the eyes of the second girl? It would be desirable - in the second girl, the color of the eyes is also likely blue.
And as we can see, this is the case.

This is an example of dependent measurements - when our predictions, our best hypothesis about the result changes depending on whether we know the result of some other measurement. How does all this happen in the web, in search, in life?
All user actions are actually twins, because they have a common “ancestor” - the user. All user actions are somehow related to each other, because they are based on the habits of this user, his behavior on our service. Moreover, often all these actions are not individual, but are associated with a single task. For example, imagine: the search query “ Kalashnikov assault rifle buy ” - the user looked, poked, did not like him; changing the query “ a real Kalashnikov automatic buy ” - again I don’t like it; tries “the Kalashnikov assault rifle doesn't buy ” (here we understand that the user is not very experienced, because the search results, on the contrary, will contain the word “ make-up ”). Realizing this, the user leaves for a while and returns later with a new request, which he really cares about:

These requests are somehow dependent on each other, if the user received normal (in his understanding) results for the first two requests, then it wouldn’t come to a request to “hire a killer”. How does this work in reality? Here are some examples.
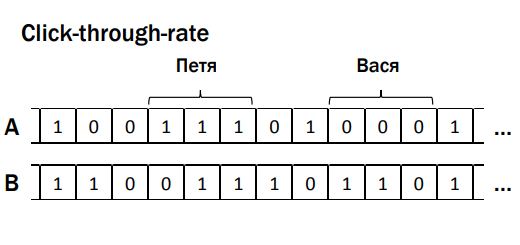
There is click-through-rate, data array A and B (see figure), dependent data groups, where ' 1 ' are cases when the user interacted with interface elements (for example, a button, a form), ' 0 ' did not interact . It would seem that the criterion does not know anything about them, but it breaks down, it’s magic. The next example is purchases from an online store, arrays A and B contain information about checks of purchases made. The user Roman (this, by the way, I) bought his wife a tablet with a cover in the kit - when she received the order, it turned out that the case was completely bad, it was impossible to use, the tablet fell out. And Roman goes and buys a separate case, more suitable for this tablet. These actions are also dependent on each other, not by accident. Thus, we come to error number 3 - do not take into account the dependence of the user's actions. What is the problem: if the actions in the metric are dependent, then we have a test, it works with a significance of 95%, but in fact in the A / A test, most likely, the test will be wrong not 5%, but more often. In my practice, I have even met 20%, the company conducted the nth number of experiments, and 20% of these experiments, regardless of what their true result is, give some random significant result. It's terrible, it's a business decision, you feel? You can't do that.
What can you do about it? Let's start by checking this out. Often, when you read articles about A / B testing, you meet “when you have captured the system for yourself, conduct at least one A / A experiment, and it is necessary that it does not show a“ meaningful result ”. 20% is still a breakdown. How many times do I need to conduct an A / A test to test well? Let's discuss. For example, if you spend it 100 times, how many of these hundred things will we shoot there ”(in a normal situation)? 5, maybe 4, maybe 6, which is normal, these are statistics. If never - is this normal? Look, as in the example with Google and Marissa Mayer - if there are 41 experiments, then “never” of them is a probability of 12%, if 100 times, then 0.95 to the 100th power, which is a rather small number.
How to spend a million A / A tests? We do not have enough time or users. There is a " synthetic A / A test " technique. Suppose we have one real A / A test, we conducted it - in each group we got at least several thousand users. What we can do is upload to offline and repartition again into groups, and then divide again.
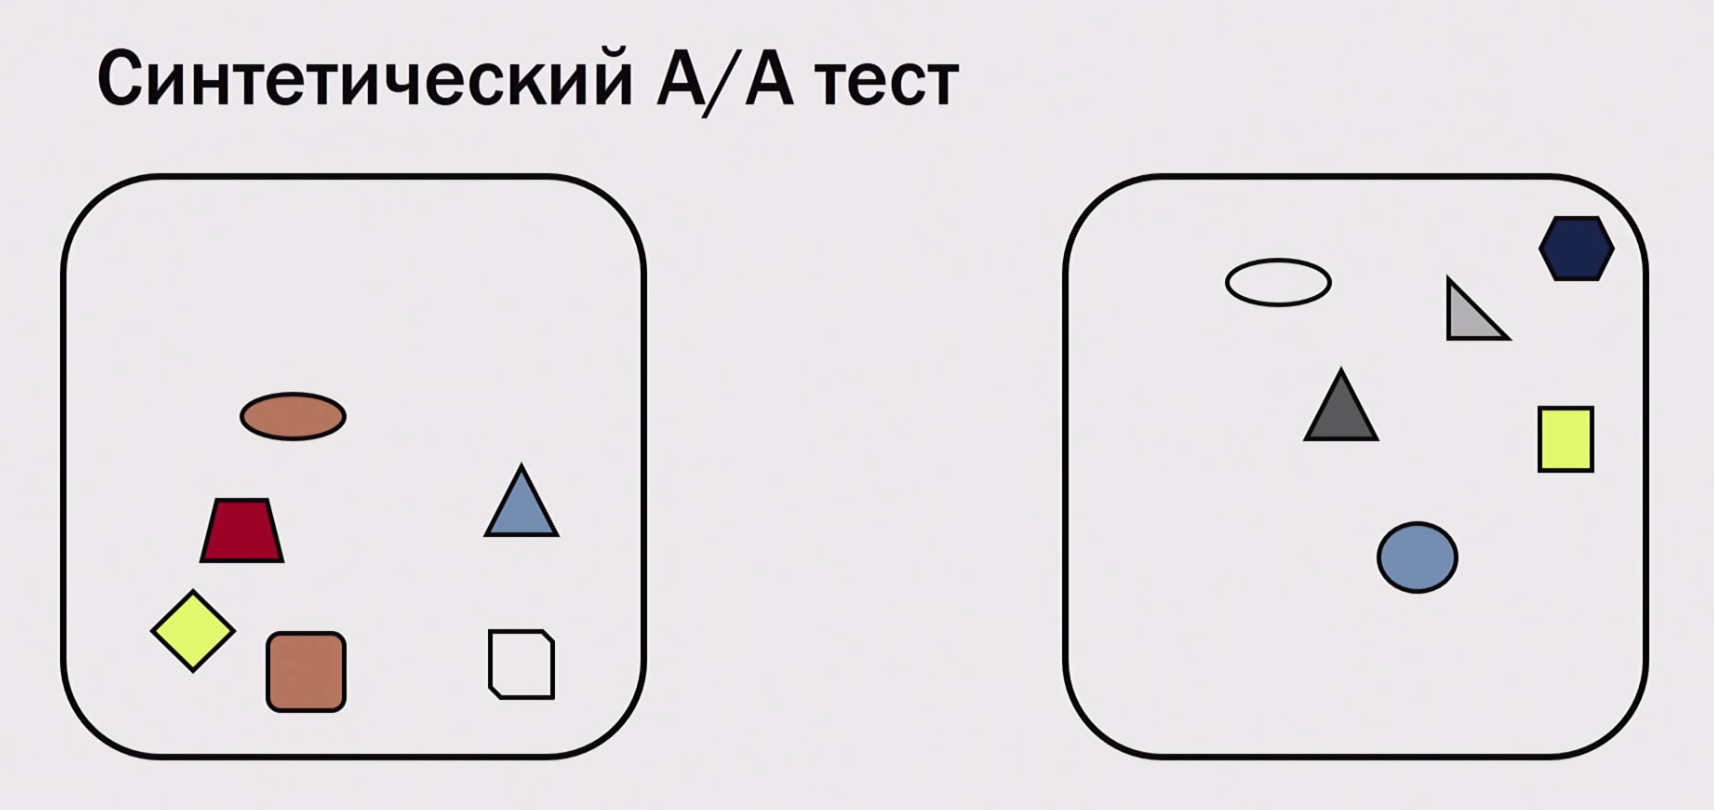
Thus, we can accumulate hundreds of thousands of experiments from a single A / A test (if we have at least several thousand users). Of course, we can not check everything in this way - we can check only errors in calculations, in statistics. We cannot verify that in our production, users somehow incorrectly split (which sometimes happens; for example, they have incorrectly calculated the hash function), or we did not notice that the “production” version is spinning on one cluster, “experiments” - on the other, and there is a different performance iron (someone is faster, and, accordingly, users are better). We may not notice something, but we can see some problems with mathematics. Important error number 4: do not save the logs of experiments with the possibility of recalculation. Those. conduct an experiment and return to this data, calculate it differently, cannot fix the metric - this is “a shot in the leg”). What to do with the situation when you noticed a dependency in your metric? There are two methods of struggle:
We remember that we need the number of users in a square from the size of the delta (the delta decreases, the service grows, we have a lot of developers with ideas, there are not enough users). An attempt to generate more data from the same data by adding dependent data failed. We do not have enough users, what are we going to do? Roll out gradually. We have many experiments, we will roll them each into a small group of users. Here is the delta onit works in our favor - if we did something bad, the delta is big and negative, then we need few users to notice it. If we have deteriorated everything 10 times, we will notice it by 100 times fewer users. At 1% roll out a lot of experiments, those of them that are obviously bad, weed out, and the rest have already been rolled out to more users and see what happens. Use "multi-armed bandits." This is a term from machine learning, in experiments it is so arranged: a thing that continuously recalculates the current indicator of the experiment - if the experiment is promising (everything seems to be good, although the significance level has not yet been reached), then it starts pouring more traffic into this experiment. dynamically changes which experiments pour more traffic, which ones less. Respectively,A promising experiment is tested faster - either it turns out to be successful, or it loses its perspective (however, in general, we get more profit). These approaches have a common problem - let's consider it on a simplified example with the admission of applicants to the University of Berkeley'1975: it suddenly turned out that about 50% of applicants passed from the enrolled boys, and 40% girls (while students from different gender groups were approximately equal quantity). The girls began to resent being oppressed, they say, discrimination. The scandal forced the university management to understand what was going on. How to understand? It was decided to break down the faculties.These approaches have a common problem - let's consider it on a simplified example with the admission of applicants to the University of Berkeley'1975: it suddenly turned out that about 50% of applicants passed from the enrolled boys, and 40% girls (while students from different gender groups were approximately equal quantity). The girls began to resent being oppressed, they say, discrimination. The scandal forced the university management to understand what was going on. How to understand? It was decided to break down the faculties.These approaches have a common problem - let's consider it on a simplified example with the admission of applicants to the University of Berkeley'1975: it suddenly turned out that about 50% of applicants passed from the enrolled boys, and 40% girls (while students from different gender groups were approximately equal quantity). The girls began to resent being oppressed, they say, discrimination. The scandal forced the university management to understand what was going on. How to understand? It was decided to break down the faculties.The scandal forced the university management to understand what was going on. How to understand? It was decided to break down the faculties.The scandal forced the university management to understand what was going on. How to understand? It was decided to break down the faculties.
(This situation would not be possible if there were an equal number of girls and boys among the applicants of each faculty)
Judging by the percentage of admitted girls, at each of the faculties (the names of the faculties are changed for simplicity) they do not seem to be oppressed. This situation would be impossible if there were an equal number of girls and boys among the applicants in each department. Here, a lot of girls enter the philfak and many of them do not pass, the amount in columns turns out to be disproportionate. This statistical paradox is named after the British scientist Edward Simpson.. How does this happen with experiments? Suppose we have Friday, Saturday, options A and B. Friday - roll 1%, according to science (if users see something very bad, then they are very afraid, start to run away, swear, remember for a long time). Saturday - roll out 50/50. For example, in online trading, conversions are highly dependent on the day of the week and may differ by 2 times between Friday and Saturday.
On each specific day, option B wins in terms of conversion. If we begin to summarize it all - the sum suddenly wins by option A. We caught this paradox of E. Simpson (if you work with “multi-armed gangsters”, then this is also possible, therefore act carefully). If we roll out gradually, it makes sense to take control and experimental groups of the same size . This indicator is floating not only in the case of conversions. Consider a graph with shares of the search market, li.ru counters. If you take all the sites on which there are counters from searches, then you can count the share in each case.
On the graph, the activity changes every weekend - Yandex attendance at the weekend drops sharply, Google also falls, but only slightly. If we add shares, the graph looks like a saw. Almost any indicator we follow can change over time (not only in a year, but also in a day). From here we formulate:
In a good way, if we conduct an experiment, it is better to conduct it during the full seasonality cycle (i.e., to keep the experiment for a whole day / week). As we have seen, having considered the experiment only on Friday and Saturday, one can catch a strange effect.
And if we admit that all the nuances of seasonality are difficult to foresee, and it is better to concentrate the experiment in a small period of time, parallel to the A and B groups? Experiments that go through a big holiday (we have this New Year) are obviously hard, because everything breaks down. Especially if we are talking about metrics of user return. Of course, there are many factors that influence the outcome of the experiment. The point is that the A and B groups should always go in parallel, but if we don’t keep the experiment full week, or they differ in size, there can be a shift in performance. There are always unrecoverable losses - there are users who refuse to use cookies, and in each service there are many such users - we cannot but give them to buy in the store, purchases without registration are allowed, so as not to lose money.And still there is a dependency - the user does not take cookies, but comes to the store regularly. So at least you need to eliminate the losses that we know about.
If the share starts to approach the projected share of those who worked at random, then something went wrong - we should be able to return to any experiment and recalculate.
The main thing: no matter how much we learn about the world, it is still more complex than it seems to us.
Have you noticed that usually people who are responsible for experiments, as a result, say that there is not enough data to solve? Often this is true, but often it’s all a matter of breakdowns in the system of experiments and accounting of user statistics.
In this article we will look at typical breakdowns that occur there, and you will have the opportunity, returning to the workplace, to be a little data scientists and find errors in your company. Some of them are probably there.
')
The material is based on the transcript of the report of Roman Poborechy from our December conference Heisenbug 2017 Moscow.
A few years ago I worked at Yandex, where I worked, in particular, on user behavior metrics and user experiments; Most of my experience on this topic comes from there.
First, let us recall an example from the history: 2007, a button on the Microsoft Office page: what will happen if you make a slightly different button, but next to write a price - maybe they will click more there? Zadizaynili this page:
And it’s scary: Office is a rather expensive product, it brings a lot of money, and you want to do it so carefully that you don’t lose this money at once. Split tests (A / B tests) are carried out: when we select a group of users and show them the new version, and another group the old one, then we compare the results. In our example about Microsoft Office - do you think it is more or less clicked in the new version? In the new version, the “Buy” button was clicked less. Hence the first message - error number 0.
Error number 0: if you don’t have A / B tests at all and immediately roll everything into production, you can roll out something that you can later regret
Do you have an A / B testing system in your company? Cool, but it is probably broken in several typical ways, which we will now disassemble. How you can use this material: you can come to your job, talk to people who use the A / B test system, ask some simple questions and point out mistakes. Or, if you ever have to test such a system, then you will know these few typical tests.
People who do not do such tests usually say: “What can be so complicated here?” It is necessary (1) to divide users into groups, then (2) each user should show something of their own, then (3) calculate the results and see who is better - in roll production. To this I want to say: the world is very simple, it stands on three elephants, at the top of Sagarmathi (Russian Everest) Shiva sits, there are commandments, and it is clear to everyone what to do.
In fact, in each of the three points you can nakosyachit. Today we will talk about the last of them: counting the results.
For example, imagine that there is an online store, and we want to conduct an experiment. A naive idea: we take Time (for convenience), ( y ) along the axis ( x ) - a check (that is, what people bought in the end), and we will have option A and option B - below the graph shows that option B it is better.
In reality, everything is different. Take a product that is interesting to everyone, regardless of the budget (for example, food), and imagine that there are two clients: rich and poorer. Suppose that the version presented in group B is better than in A. Consumption in A and B for these two users is different, the following is important: the rich, coming to the “bad” group, will bring much more money than the second client, who I bought a version from a “good” group (except for the absolutely terrible cases, when in both versions something is broken so much that nothing works at all). A person depends much more on his own habits than on some minimal changes on our service. Therefore, unfortunately, the picture is as follows - it is difficult to determine which of the options is better / worse, even comparing the average value:
The fact is that there are not so many people who came to us during the experiment. Our task is to determine by these users what will be better or worse for all. The classic problem of statistics: we can not see the full set, we are trying to make a forecast for a small sample. It turns out that the world is much more complex than we assume.
(I’ll note that I will refer to the statistics in the future, but I will try to explain everything on my fingers so that people with different experiences can easily keep track of what is happening; in-depth knowledge of statistics is not required)
So, in order to determine from a small sample whether there is a difference on a large set, we use statistical tests (criteria). This is a function to which we transfer data, and we get a result in response. We usually transfer all the data that is (not only the average, but the entire array of data from which this average value was taken); answers are given in terms of probability (for example, there is a difference with the probability of XX%). Usually people stop at 95% or more; if less than 95%, then it is considered that there is no difference, and the results of the experiment are not recognized.
It is important that the tests are developed in such a way that when there is certainly no difference, they are mistaken with this probability, otherwise they cannot be calibrated. For example, we will carry out an A / A test - we will launch two completely identical results both in the experimental and control groups of users. If we work with a significance of 95%, the result is interpreted as follows: if the result is within 95%, there is no difference; the remaining 5% - there is a difference.
The result of 5% seems small, but it is important. To understand why, let's look at the Google conflict story when Doug Bowman was the Chief Designer, and Marissa Mayer was in charge of the company's products.
Doug Bowman, Marissa Mayer
What happened: there is Google Mail, there are sponsored links. There was an interesting task: let's make a slightly different color of links, and they will click more on them. (Has anyone clicked on an advertisement in the mail at least once? I didn’t click either. Apparently, the guys still have a problem and need to do something) Marissa: "Let's try forty-one shades of blue." Doug: "Everything, I refuse to take part in this outrage." And he quit, rather because of design considerations, rather than mathematical ones, although mathematically he was also somewhat right. Let's see what happens if you do forty-one tests. What is the probability that the test will never fail (it will give an honest result - if there really is no difference, then the result will show it):
- if we conduct only one experiment with two shades of blue, then the probability of 0.95 will show that there is no difference, everything is ok;
- if two experiments - the probabilities are multiplied, too, everything is ok.
And so on. When we conduct forty-one experiments, the probabilities multiply again, and the probability that the test never fails 41 times is only 0.12, i.e. with 88% probability, at least one “shoots” and says “yes, there is a difference, this shade of blue is cool!”, when in fact it is not true.
Error number 1: to sort the parameters by users
In this regard, go to error number 1 (Recall: No. 0 - do not have A / B tests at all and immediately roll everything into production): sort through the parameters of the hands of users. That is, instead of investigating and inventing the hypothesis “what will be better and what is worse,” everything is sent to the experiment in the hope that something from this will “shoot” (without thinking that any of this can “Shoot” by chance).
Google is big, it has a lot of data, it can be considered more likely (95% vs. 99% and 99.9%). So, theoretically, it is possible to conduct 41 experiments: if not one “shoots”, then everything is likely to be normal. Who is right, Marris or Doug? In the case of conventional services that do not have billions of users, it is wasteful to conduct many experiments with a probability of 99.9%. What does the criterion answer depend on? From a few things.
First, the scatter of data. The better they are grouped around (see Fig. A), for example, their average, the more confident the test will be to say that one version has a better difference than the other. Otherwise (Fig. B) ), more data is required to get the same degree of confidence.
Fig. but)
Fig. b)
There is a spread of data. Most likely, we cannot influence it, because it depends on our users, the structure of our service, and we cannot do anything about it quickly. Secondly, the response of the criterion depends on the difference we want to detect. If we have done something very good (or bad, it is made easier and, therefore, more often) - the difference is big, and existing users will, on average, generate this big difference. Then we need a smaller amount of data, but nevertheless, the last parameter is the amount of data that we send to the criterion. Obviously, we can regulate the difference in the quality of our work (better work - more difference :)). The amount of data is governed by how many users we throw into the experiment, and it is limited to 100% (ie, 50% is the control group, 50% is the experiment). I note that sometimes it is possible to keep the experiment longer - not a day / week, but a month - then more data will accumulate (but this does not work for all metrics). There is a dependency between the difference we see and the amount of data we need to do this - this is a fundamental law, regardless of what statistical criterion we use.
For example, if the delta is two times less than in the first case, then in order to notice it with the same degree of confidence, we need four times more data (since the square root). What is bad? The simplest things (payment buttons, recommendations, etc.) we, as a startup of 2-3 people, manage to do quickly. Then the service becomes relatively stable, and it’s difficult to make powerful changes there, and besides, we continue to grow, many developers appear (everyone generates something, wants to send something to the experiment), and at a pace when we have a square, We very quickly end an important resource - users. Everything is crammed with experiments in our country, sometimes we put them in several layers, and still the line of people who want to launch something into the experiment stretches right up to the horizon. This is the first thing to be understood. The second thing is illustrated by the following example.
The challenge of a rare disease
If you ever retrain in a data scientist , then know that this task is set at the first interview. Let us analyze it graphically (there will be no more formulas). Suppose there is a dangerous disease; 0.5% of people are sick with it (according to statistics); there is a test that determines this disease with an accuracy of 95% (in both directions, with a probability of 95%, it gives the correct result and 5% gives the wrong result; it does not matter whether the person is healthy or sick). Consider the option: the test is positive, is it necessary to be sad? We decide graphically: each cell is a person, of which about 0.5% is sick (a dark red cell, we group them for convenience).
Important: the test that we run on them can sometimes be statistically wrong. This situation was a long time with tests for AIDS: they worked with such accuracy that the percentage of patients was much less than the percentage of errors, and therefore it was necessary to carry out the test several times to be sure (very often a positive result for the first time was an error).
Let's return to our experiment about “shades of blue”. Some say, "Let's test forty-one shades of blue." The product owner picks up: "They told me here that rounded buttons are better than square ones, let's test them." One more: “Let's play with fonts”. And the worst of what I have seen is what they do with recommender systems.
We have content, and we additionally recommend something else (for example, to watch a product / video, etc.), usually it is based on machine learning (this is a random process). People come and say: “Let's run a few times. Let's put a different seed on this random process and see if it comes together in different ways, and one of these options suddenly turns out to be better than the rest. ” And so forty-one times ("shades of blue"). If we have many such experiments, then we understand that among them, if there will be, there are very few really successful ones; most will be about the same. Then we will come to a situation where the number of randomly tested tests is approximately equal (if not more) to the number of “really good”. And we still do not notice all of them: for example, if the test is good, but the difference is small, then we can say that there is no difference. What is worth doing? We always know from the construction of the test how many random alarms are there (if 95%, then 5% should be random); You can go and find out from employees what percentage is completed with success / failure, effectively. If they say that only 10% (and we know that 5% is random), then we conclude: half of what is being rolled into production is random trash.
Mistake number 2: conduct too many (bad) experiments
It is better to conduct an experiment based on the results of your research, formed from third-party sources, the hypothesis that is better for users. For example, once in Yandex, we tested a hypothesis about search results, about so-called “stupid answers” (the query is “ Leo Tolstoy ”, one of the search results is “ colon cancer ”). Invented a method by which you can separate and hide such "stupid answers." The result was discouraging: users are not better from this, but this is the subject of a separate discussion.
Let's go back to the example with the button and the specified price for Microsoft Office. I have a hypothesis: the company is big, there is a lot of money (financial indicators can be hidden, inaccessible for the experiment, that is, you can look at the statistics of clicks, but don’t know how much money it brings). Having received the first negative result, they did not stop at this experiment.
I want to warn you: when I had a bad experiment (I did, I tried, I rolled out - they say that the users didn’t like it), I start looking for bugs (including in the experiment system) as a feature owner , until I I am rehabilitating my idea or until I come to the conclusion that "there really is no ore there." So, in the opposite direction it does not work that way: I did something, and from the first time it shows a profit (“Hurray! In production, sold!”) - I am not looking for these bugs / errors that may be there. There is some bias in it.
Microsoft didn’t calm down either: they found that they click on the button with the specified cost less, but there is a more complicated process behind it (insert a card, etc.) and buy more; it turned out that the cumulative amount of money it brings made a difference of several tens of millions of dollars. From here follows another important point: you need to choose which indicator to look at.
Indicators in the experiment can be many, you must choose the right one. It would seem that you only have to look at the money, is it logical? It depends on the monetization model: “ direct ” (users come with money and get something for it, for example, an online store, stock) or “ indirect ”. When indirect monetization occurs, the following happens: users come for some shareware content, and while they are watching this shareware content, we catch some of them, drag them into a dark basement, disassemble them into organs, sell organs. According to this model, search engines, entertainment portals, social networks work, that's all. The more advertising, the more money you can get in the moment, but at the same time users can stop visiting such sites - short-term money vs. long-term money: reduced food supply, and everything becomes bad. What happens with LiveJournal / LiveJournal: the service is dying, let's hang up more advertising to make up for the loss of money, but from this the service dies even faster. There are also "working" sites: there are employers who pay for the database, advertising, and there are job seekers who work for free. And to applicants to keep them, you need one thing, and employers - something else.
In general, difficult life for those who have an indirect model of monetization - what should they look at, only for money? Of course, the money should not be squandered, but you can’t just maximize them, because now we will get rich, and then everything will end. At this point, we notice that the world is rather complicated - we have to somehow measure the user base. For example, there are such indicators to measure:
- churn rate (conditionally: there were some users, and then we notice that they stop coming - you can track with the help of mathematics, who was, and then disappeared);
- user loyalty in different versions; time of absence of the user (if the user used to come to our service often, then began to come rarely).
There are other indicators. The problem with the immediate metrics of the user base (if you exaggerate the situation) - they never change. Of course, you can make such a change that you will immediately see that user loyalty has increased, but it is difficult.
Dependent and independent measurements
So we come to technical metrics - something that can be easily calculated. For example, clicks (users began to click more, which is probably good). Nothing worth dragging clicks from one place to another on the page; click-through-rate (aka CTR) - showing the button / form; there are cases where the user has seen, but did not interact with it, but there is, when interacted. This is the percentage of cases when people saw an element (for example, a button) and began to do something with it. If we are talking about video and recommendations, there is such a good indicator as to the depth (percentage) of viewing , i.e. if the video takes 2 minutes, and the user watched 1.5 minutes, then the viewing depth is 75% (if you’ve watched it to the end - 100%); time to click (strongly depends on whether we make large or small snippets) and others. Most of these metrics stumble upon such a terrible thing called the Central Limit Theorem (CLT). I will not formulate it, only one point is important for us, which everyone has forgotten about. Most of the statistical criteria are based on the CLT; they assume that its conditions are correct. One of the conditions is as follows: the measurements that we put in the data array must be independent of each other. What does it mean? In order to demonstrate dependence and independence, now in practice, find out what it is, on volunteers :)
We will measure the distribution of eye color: according to 1909, most people in Russia at that time had gray eyes, the second most common color was brown, then blue, blue, green and black. By the way, there are people with an exotic eye color, for example, “swamp”, but they will not include our example. We put in front of an audience of two volunteers, Stas and Philip. We place bets on what color of their eyes. We assume that the gain is equal to the frequency. We find out - Stas has gray eyes (the statistics do not lie!). And Philip? Also gray. After we learned what color Stas' eyes were, did we want to somehow change our rate relative to the color of Philip's eyes? Probably not, because what's the difference? Actually, this is an example of independent measurements.
Suppose there are 2 girls, twin sisters, nonidentical.
Let's make a bet, who has what color eyes. Made?
Now the trick: let's color the first girl.
In one, as we see, blue. The question is, do we now want to change our bet regarding the color of the eyes of the second girl? It would be desirable - in the second girl, the color of the eyes is also likely blue.
And as we can see, this is the case.
This is an example of dependent measurements - when our predictions, our best hypothesis about the result changes depending on whether we know the result of some other measurement. How does all this happen in the web, in search, in life?
All user actions are actually twins, because they have a common “ancestor” - the user. All user actions are somehow related to each other, because they are based on the habits of this user, his behavior on our service. Moreover, often all these actions are not individual, but are associated with a single task. For example, imagine: the search query “ Kalashnikov assault rifle buy ” - the user looked, poked, did not like him; changing the query “ a real Kalashnikov automatic buy ” - again I don’t like it; tries “the Kalashnikov assault rifle doesn't buy ” (here we understand that the user is not very experienced, because the search results, on the contrary, will contain the word “ make-up ”). Realizing this, the user leaves for a while and returns later with a new request, which he really cares about:
These requests are somehow dependent on each other, if the user received normal (in his understanding) results for the first two requests, then it wouldn’t come to a request to “hire a killer”. How does this work in reality? Here are some examples.
Error number 3: do not consider the dependence of user actions
There is click-through-rate, data array A and B (see figure), dependent data groups, where ' 1 ' are cases when the user interacted with interface elements (for example, a button, a form), ' 0 ' did not interact . It would seem that the criterion does not know anything about them, but it breaks down, it’s magic. The next example is purchases from an online store, arrays A and B contain information about checks of purchases made. The user Roman (this, by the way, I) bought his wife a tablet with a cover in the kit - when she received the order, it turned out that the case was completely bad, it was impossible to use, the tablet fell out. And Roman goes and buys a separate case, more suitable for this tablet. These actions are also dependent on each other, not by accident. Thus, we come to error number 3 - do not take into account the dependence of the user's actions. What is the problem: if the actions in the metric are dependent, then we have a test, it works with a significance of 95%, but in fact in the A / A test, most likely, the test will be wrong not 5%, but more often. In my practice, I have even met 20%, the company conducted the nth number of experiments, and 20% of these experiments, regardless of what their true result is, give some random significant result. It's terrible, it's a business decision, you feel? You can't do that.
What can you do about it? Let's start by checking this out. Often, when you read articles about A / B testing, you meet “when you have captured the system for yourself, conduct at least one A / A experiment, and it is necessary that it does not show a“ meaningful result ”. 20% is still a breakdown. How many times do I need to conduct an A / A test to test well? Let's discuss. For example, if you spend it 100 times, how many of these hundred things will we shoot there ”(in a normal situation)? 5, maybe 4, maybe 6, which is normal, these are statistics. If never - is this normal? Look, as in the example with Google and Marissa Mayer - if there are 41 experiments, then “never” of them is a probability of 12%, if 100 times, then 0.95 to the 100th power, which is a rather small number.
Error number 4: do not save the logs of experiments with the possibility of recalculation
How to spend a million A / A tests? We do not have enough time or users. There is a " synthetic A / A test " technique. Suppose we have one real A / A test, we conducted it - in each group we got at least several thousand users. What we can do is upload to offline and repartition again into groups, and then divide again.
Thus, we can accumulate hundreds of thousands of experiments from a single A / A test (if we have at least several thousand users). Of course, we can not check everything in this way - we can check only errors in calculations, in statistics. We cannot verify that in our production, users somehow incorrectly split (which sometimes happens; for example, they have incorrectly calculated the hash function), or we did not notice that the “production” version is spinning on one cluster, “experiments” - on the other, and there is a different performance iron (someone is faster, and, accordingly, users are better). We may not notice something, but we can see some problems with mathematics. Important error number 4: do not save the logs of experiments with the possibility of recalculation. Those. conduct an experiment and return to this data, calculate it differently, cannot fix the metric - this is “a shot in the leg”). What to do with the situation when you noticed a dependency in your metric? There are two methods of struggle:
- (per user) ( , , , ).
- , , . ( Python ), , .
We remember that we need the number of users in a square from the size of the delta (the delta decreases, the service grows, we have a lot of developers with ideas, there are not enough users). An attempt to generate more data from the same data by adding dependent data failed. We do not have enough users, what are we going to do? Roll out gradually. We have many experiments, we will roll them each into a small group of users. Here is the delta onit works in our favor - if we did something bad, the delta is big and negative, then we need few users to notice it. If we have deteriorated everything 10 times, we will notice it by 100 times fewer users. At 1% roll out a lot of experiments, those of them that are obviously bad, weed out, and the rest have already been rolled out to more users and see what happens. Use "multi-armed bandits." This is a term from machine learning, in experiments it is so arranged: a thing that continuously recalculates the current indicator of the experiment - if the experiment is promising (everything seems to be good, although the significance level has not yet been reached), then it starts pouring more traffic into this experiment. dynamically changes which experiments pour more traffic, which ones less. Respectively,A promising experiment is tested faster - either it turns out to be successful, or it loses its perspective (however, in general, we get more profit). These approaches have a common problem - let's consider it on a simplified example with the admission of applicants to the University of Berkeley'1975: it suddenly turned out that about 50% of applicants passed from the enrolled boys, and 40% girls (while students from different gender groups were approximately equal quantity). The girls began to resent being oppressed, they say, discrimination. The scandal forced the university management to understand what was going on. How to understand? It was decided to break down the faculties.These approaches have a common problem - let's consider it on a simplified example with the admission of applicants to the University of Berkeley'1975: it suddenly turned out that about 50% of applicants passed from the enrolled boys, and 40% girls (while students from different gender groups were approximately equal quantity). The girls began to resent being oppressed, they say, discrimination. The scandal forced the university management to understand what was going on. How to understand? It was decided to break down the faculties.These approaches have a common problem - let's consider it on a simplified example with the admission of applicants to the University of Berkeley'1975: it suddenly turned out that about 50% of applicants passed from the enrolled boys, and 40% girls (while students from different gender groups were approximately equal quantity). The girls began to resent being oppressed, they say, discrimination. The scandal forced the university management to understand what was going on. How to understand? It was decided to break down the faculties.The scandal forced the university management to understand what was going on. How to understand? It was decided to break down the faculties.The scandal forced the university management to understand what was going on. How to understand? It was decided to break down the faculties.
| Faculty | Girls | The boys | ||||
| did | have passed | % | did | have passed | % | |
| mat-fur | 46 | 39 | 85 | 320 | 211 | 66 |
| conclusion | girls do not seem to be oppressed | |||||
| Physical Department | 31 | 28 | 90 | 294 | 232 | 79 |
| conclusion | girls do not seem to be oppressed | |||||
| legal | 405 | 141 | 35 | 438 | 139 | 32 |
| conclusion | girls do not seem to be oppressed | |||||
| filfak | 614 | 233 | 38 | 50 | 7 | 14 |
| conclusion | girls do not seem to be oppressed | |||||
| Total | 1096 | 441 | 40 | 1102 | 589 | 53 |
(This situation would not be possible if there were an equal number of girls and boys among the applicants of each faculty)
Judging by the percentage of admitted girls, at each of the faculties (the names of the faculties are changed for simplicity) they do not seem to be oppressed. This situation would be impossible if there were an equal number of girls and boys among the applicants in each department. Here, a lot of girls enter the philfak and many of them do not pass, the amount in columns turns out to be disproportionate. This statistical paradox is named after the British scientist Edward Simpson.. How does this happen with experiments? Suppose we have Friday, Saturday, options A and B. Friday - roll 1%, according to science (if users see something very bad, then they are very afraid, start to run away, swear, remember for a long time). Saturday - roll out 50/50. For example, in online trading, conversions are highly dependent on the day of the week and may differ by 2 times between Friday and Saturday.
| Friday | Saturday | Total | ||
| BUT | users | 990000 | 500,000 | 1490000 |
| conversions | 20,000 | 5000 | 25,000 | |
| % | 2.02 | 1.00 | 1.68 | |
| AT | users | 10,000 | 500,000 | 510000 |
| conversions | 230 | 6000 | 6230 | |
| % | 2.30 | 1.20 | 1.22 |
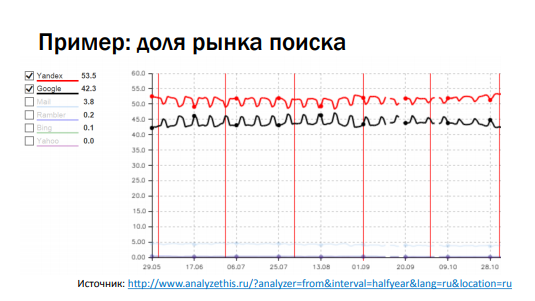
On each specific day, option B wins in terms of conversion. If we begin to summarize it all - the sum suddenly wins by option A. We caught this paradox of E. Simpson (if you work with “multi-armed gangsters”, then this is also possible, therefore act carefully). If we roll out gradually, it makes sense to take control and experimental groups of the same size . This indicator is floating not only in the case of conversions. Consider a graph with shares of the search market, li.ru counters. If you take all the sites on which there are counters from searches, then you can count the share in each case.
On the graph, the activity changes every weekend - Yandex attendance at the weekend drops sharply, Google also falls, but only slightly. If we add shares, the graph looks like a saw. Almost any indicator we follow can change over time (not only in a year, but also in a day). From here we formulate:
Mistake number 5: do not take into account seasonality (the measured indicator varies over time)
In a good way, if we conduct an experiment, it is better to conduct it during the full seasonality cycle (i.e., to keep the experiment for a whole day / week). As we have seen, having considered the experiment only on Friday and Saturday, one can catch a strange effect.
And if we admit that all the nuances of seasonality are difficult to foresee, and it is better to concentrate the experiment in a small period of time, parallel to the A and B groups? Experiments that go through a big holiday (we have this New Year) are obviously hard, because everything breaks down. Especially if we are talking about metrics of user return. Of course, there are many factors that influence the outcome of the experiment. The point is that the A and B groups should always go in parallel, but if we don’t keep the experiment full week, or they differ in size, there can be a shift in performance. There are always unrecoverable losses - there are users who refuse to use cookies, and in each service there are many such users - we cannot but give them to buy in the store, purchases without registration are allowed, so as not to lose money.And still there is a dependency - the user does not take cookies, but comes to the store regularly. So at least you need to eliminate the losses that we know about.
Results
- conduct experiments;
- make changes based on reasonable hypotheses that come from analyzing the market, users, etc .;
- follow the success rate of experiments;
- log everything;
If the share starts to approach the projected share of those who worked at random, then something went wrong - we should be able to return to any experiment and recalculate.
- conduct A / A experiments, including synthetic ones;
- remember seasonality.
The main thing: no matter how much we learn about the world, it is still more complex than it seems to us.
Minute advertising. If you liked this report from the Heisenbug conference - note that the new Heisenbug (May 17-18, St. Petersburg) is already coming, its program also contains a lot of interesting things . We hope to see many of you there!
Source: https://habr.com/ru/post/358104/
All Articles