Build a graph on the character display 1602 Arduino
We will need Arduino Uno, display 1602 (and adapter i2c), pressure sensor BMP180. I apologize for the quality of the photo, but what is.
The display is connected via an i2c adapter, since I did not have enough contacts. With the standard library, connecting additional characters looks a little different, but the meaning should be clear.
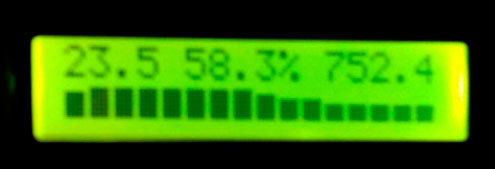
The pressure sensor is also chosen from the considerations of my project, but you can also plot any process. For graphics, we have 16 characters of one line, we can use them all (as in the photo), but for clarity of graphics we use the first characters for the caption, we will have 13 characters left. We will display the readings every two hours.
')
The rest is comments in the code.
Once per hour we read the value from the pressure sensor and time, fill the array. Call the graphing function. The output of the current values in the first line of the display from the code removed, so as not to clutter up the example.
We will build a relative graph, so we will calculate the interval in which the values fit. We can use only eight lines of one cell of the display, so we divide the interval into 8 intervals.
When calculating the interval, we need the minimum value in the array:
We build the graph itself, if there are no values in the array, print a dash. The function call is complicated to build different graphs from the array. The first number is the number of the array, then the frequency of data sampling, then the initial value in the array. We take the first array (0), take every second value (2) and start from the beginning (0):
The display is connected via an i2c adapter, since I did not have enough contacts. With the standard library, connecting additional characters looks a little different, but the meaning should be clear.
The pressure sensor is also chosen from the considerations of my project, but you can also plot any process. For graphics, we have 16 characters of one line, we can use them all (as in the photo), but for clarity of graphics we use the first characters for the caption, we will have 13 characters left. We will display the readings every two hours.
')
The rest is comments in the code.
#include <Wire.h> #include <SPI.h> #include <LiquidCrystal_I2C.h> // LCD i2c LiquidCrystal_I2C lcd(0x3F,16,2); // i2c // #if defined(ARDUINO) && ARDUINO >= 100 #define printByte(args) write(args); #else #define printByte(args) print(args,BYTE); #endif // , . uint8_t graf0[8] = {0x1F,0x1F,0x1F,0x1F,0x1F,0x1F,0x1F}; uint8_t graf1[8] = {B00000, B11111, B11111, B11111, B11111, B11111, B11111}; uint8_t graf2[8] = {B00000, B00000, B11111, B11111, B11111, B11111, B11111}; uint8_t graf3[8] = {B00000, B00000, B00000, B11111, B11111, B11111, B11111}; uint8_t graf4[8] = {B00000, B00000, B00000, B00000, B11111, B11111, B11111}; uint8_t graf5[8] = {B00000, B00000, B00000, B00000, B00000, B11111, B11111}; uint8_t graf6[8] = {B00000, B00000, B00000, B00000, B00000, B00000, B11111}; uint8_t graf7[8] = {B00000, B00000, B00000, B00000, B00000, B00000, B00000}; // int stat[2][25]; // 2 , ( ) //int stat[0]; // //int stat[1]; // #include <BMP085.h> BMP085 dps = BMP085(); // long Pressure = 0; void setup(void) { lcd.init(); lcd.backlight(); // lcd.createChar(0, graf0);// . lcd.createChar(1, graf1); lcd.createChar(2, graf2); lcd.createChar(3, graf3); lcd.createChar(4, graf4); lcd.createChar(5, graf5); lcd.createChar(6, graf6); lcd.createChar(7, graf7); } Once per hour we read the value from the pressure sensor and time, fill the array. Call the graphing function. The output of the current values in the first line of the display from the code removed, so as not to clutter up the example.
void loop(void) { if (((millis()/3600000)-stat[1][23]) >= 1.0) // 1 (3600000) { // , int i=0; for (i = 0; i < 24; i++) stat[0][i] = stat[0][i+1]; for (i = 0; i < 24; i++) stat[1][i] = stat[1][i+1]; dps.getPressure(&Pressure); // stat[0][23] = Pressure/13.33; stat[1][23] = millis()/3600000; grafik(0, 2, 0); // , , , , . (0), (2) (0) } We will build a relative graph, so we will calculate the interval in which the values fit. We can use only eight lines of one cell of the display, so we divide the interval into 8 intervals.
int interval(int x) { int maxy = -5000; int inty = 0; int minx = minimum(x); for (int k = 0; k <= 24; k++) { if (stat[1][k] != 0) { // if (stat[x][k] > maxy) maxy = stat[x][k]; // }} if (maxy == -5000) maxy = 0; // inty = maxy - minx; intx = inty/8; return intx; } When calculating the interval, we need the minimum value in the array:
int minimum(int d) { minx = 32767; for (int i = 0; i <= 24; i++) { if (stat[1][i] != 0) { // if (stat[d][i] < minx) minx = stat[d][i];// }} if (minx == 50000) minx = 0; return minx; } We build the graph itself, if there are no values in the array, print a dash. The function call is complicated to build different graphs from the array. The first number is the number of the array, then the frequency of data sampling, then the initial value in the array. We take the first array (0), take every second value (2) and start from the beginning (0):
void grafik(int x, int y, int z) { lcd.setCursor(0, 1); lcd.print("Dav"); // intx = interval(x); // int minx = minimum(x); // for (int i=z; i <= 24; i= i + y){ if (stat[x][i] == 0){ // lcd.print("-"); // , } else if (stat[x][i] > (minx + intx*7)) { lcd.printByte(0); } else if (stat[x][i] > (minx + intx*6)) { lcd.printByte(1); }else if (stat[x][i] > (minx + intx*5)) { lcd.printByte(2); }else if (stat[x][i] > (minx + intx*4)) { lcd.printByte(3); }else if (stat[x][i] > (minx + intx*3)) { lcd.printByte(4); }else if (stat[x][i] > (minx + intx*2)) { lcd.printByte(5); }else if (stat[x][i] > (minx + intx)) { lcd.printByte(6); } else { lcd.printByte(7); } } } Source: https://habr.com/ru/post/357898/
All Articles