Check Point Dashboards - that's what I love
- Why are you rubbing me about a convenient interface? It doesn't matter at all. I am only interested in the functionality! (from the conversation with the client)
When choosing NGFW (or UTM), they most often look solely at the functionality of the device . It is difficult to argue with this approach (and it is not necessary). The safety device must first protect! At the same time, the quantity and quality of protection mechanisms is very important! For this purpose various reports of Gartner and NSS Labs are published. However, another important aspect of any NGFW is embedded reporting and the quality of its visualization . Below I will try to tell why this is important and why Check Point is really cool in this.
Why do dashboards?
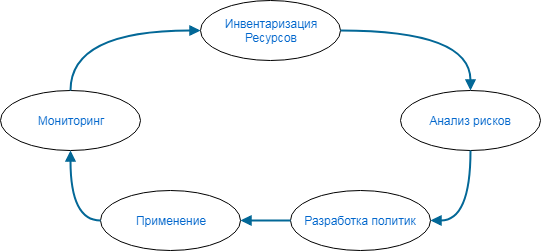
“ Information security is not a result, but a continuous process .” I am sure that everyone remembers this axiom. In different literature, this process is described in different ways, but it necessarily contains 5 main steps:
')
Today we will focus on monitoring . Many scornfully refer to this point. However, this is a big mistake. In this process there are no more important or vice versa less priority stages. The degree of security of your network is determined by the weakest link. If you remove any of the elements, then the entire information security system collapses and all other “works” multiply by zero.
You put NGFW. It may even be well tuned in accordance with the developed policies. But how to adequately evaluate his work? Do they attack you? Do users download malicious files? Do viral resources visit? Are email attachments safe? How often does this happen and is it worth paying attention to these issues? Maybe it is worth thinking about educating users so that they do not open the first available links?
Just here and need monitoring. And it is here that people usually remember about SIEM or Log-management systems. Using these tools, you can get a quantitative assessment of the security of your network. You must understand what you have now and what indicators you want to come to. It helps to set goals for security guards. Examples of goals:
- To nullify incidents with bot activity in the corporate network - “cure” infected computers, think about changing / installing desktop antiviruses).
- Reduce by 2 times the number of events associated with visits to malicious sites. Most likely through user training.
- Reduce the number of downloaded virus files by 30% - for example, by blocking the download of executable files for most users or blocking the category of resources from which they are most often downloaded.
- Exclude incidents with detection of “dangerous” applications like Tor, Teamviewer, Torrent, etc. (user training + group policies).
- Optimize IPS settings by excluding signatures that are irrelevant to your infrastructure. Perhaps 30% of all attacks are attacks on Wordpress, which you don’t have in principle. Such logs “noisy” the real picture.
- Get rid of events with similar attacks from the same nodes. On the Internet, a huge number of hosts that can automatically scan your network. You should not spend resources on them processing this IPS traffic, it is better to add their ip-addresses to the black-list and block them at the firewall level. Earlier there was an article how to do it .
It is here that we will need various dashboards, which in numbers will show what is happening on the network from a security point of view.
And here Check Point or any other NGFW? We ourselves said that SIEM or Log-management systems are usually used for monitoring and analysis. Yes, but do they all have them? Are everyone ready to spend money on it? Does everyone have a trained specialist? If the answers to the questions are negative, then the presence of the function “type SIEM” in NGFW becomes a bold plus . Integrated reporting allows you to implement a continuous process of protection. And this is a prerequisite for information security.
Check Point Ready Dashboards
Reporting and visualization of data in Check Point is responsible for the Smart Event Blade. This functionality can be called SIEM, but only for Check Point products! Technically, you can add logs from other systems (cisco, microsoft, etc.) to the Smart Event, but this is not a good idea. In practice, this is very problematic. But SmartEvent does a great job with chekpointovsky logs. It can correlate, sum, average and much more. By itself, there are already ready dashboards to display the most important information. In Check Point, they are called Views :

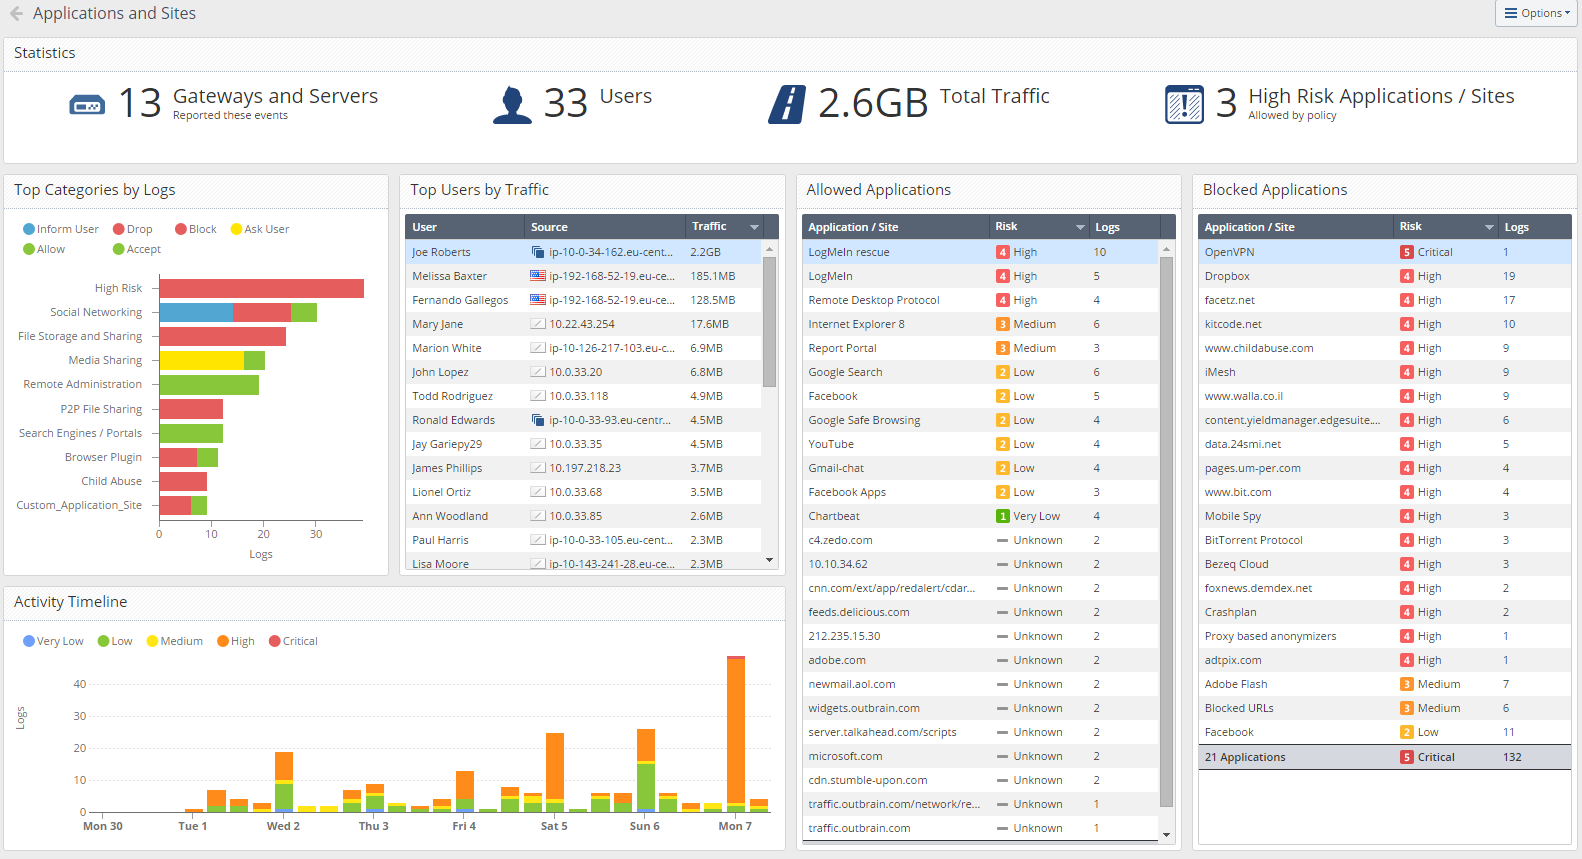
As you can see, there are dashboards not only related to information security, but also reports on user traffic. Example of Applications and Sites dashboards:
And here is an example of the Important Attacks dashboard:
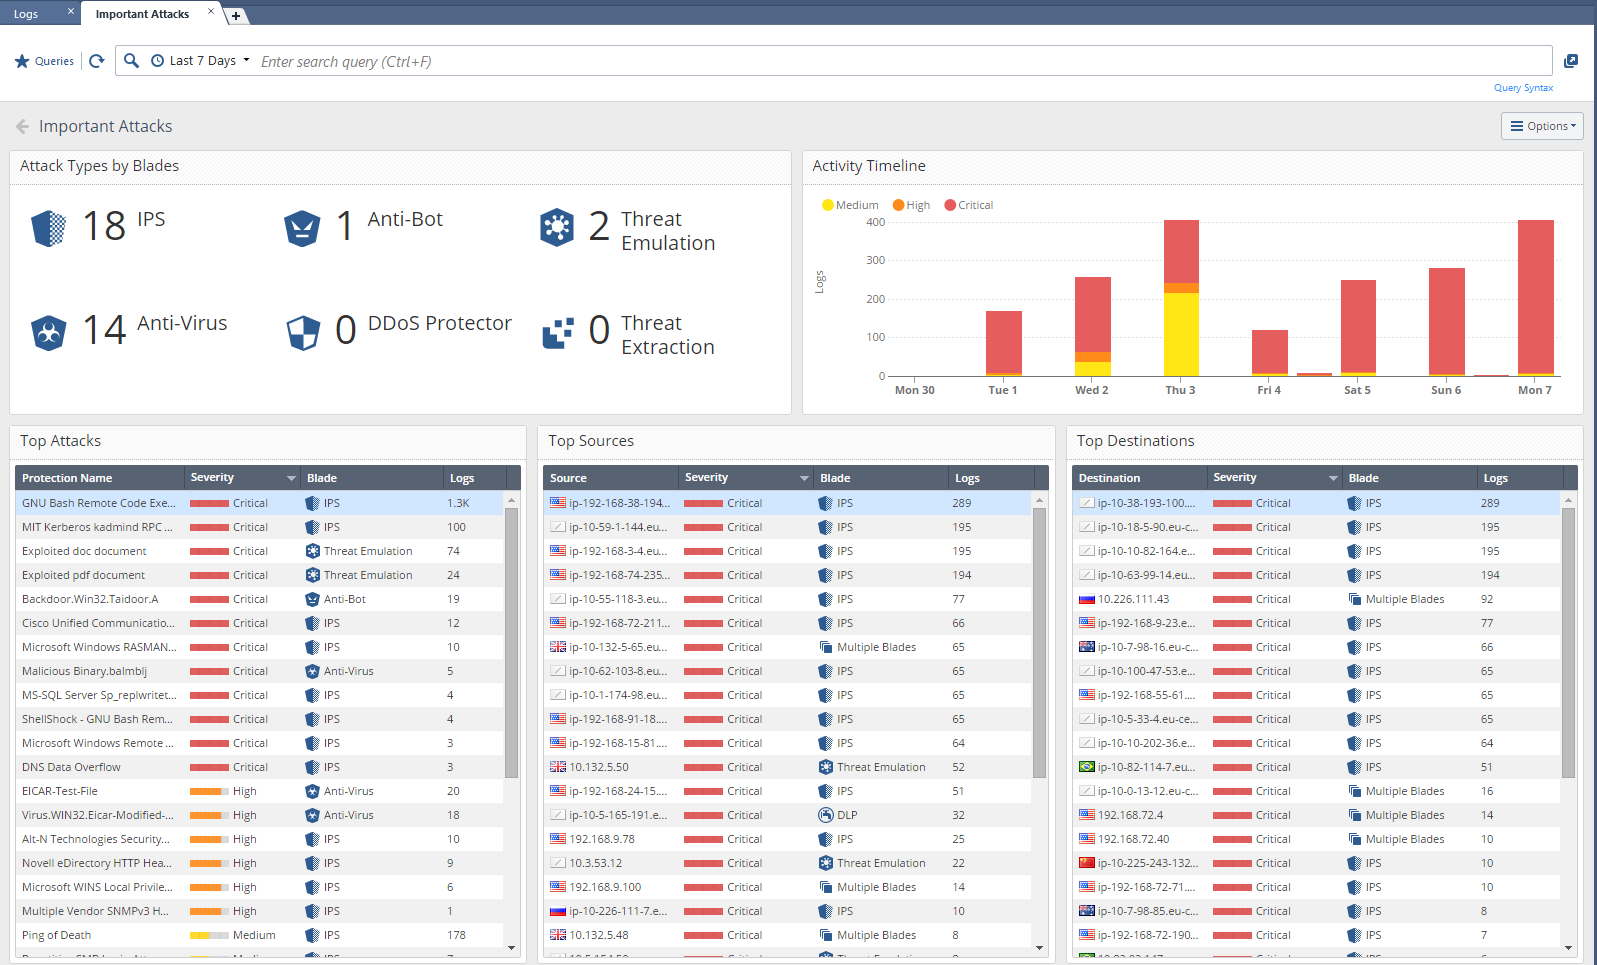
On one screen, we see the most important security events. You can see which blades worked (IPS, AV, Anti-Bot, Threat Emulation), all the triggers are divided into categories with the summation of logs. There is also a timeline. Absolutely all the fields are “clickable” and if we want to see the Anitivirus information in more detail, then simply click on it twice. We immediately went to the logs associated with this blade:
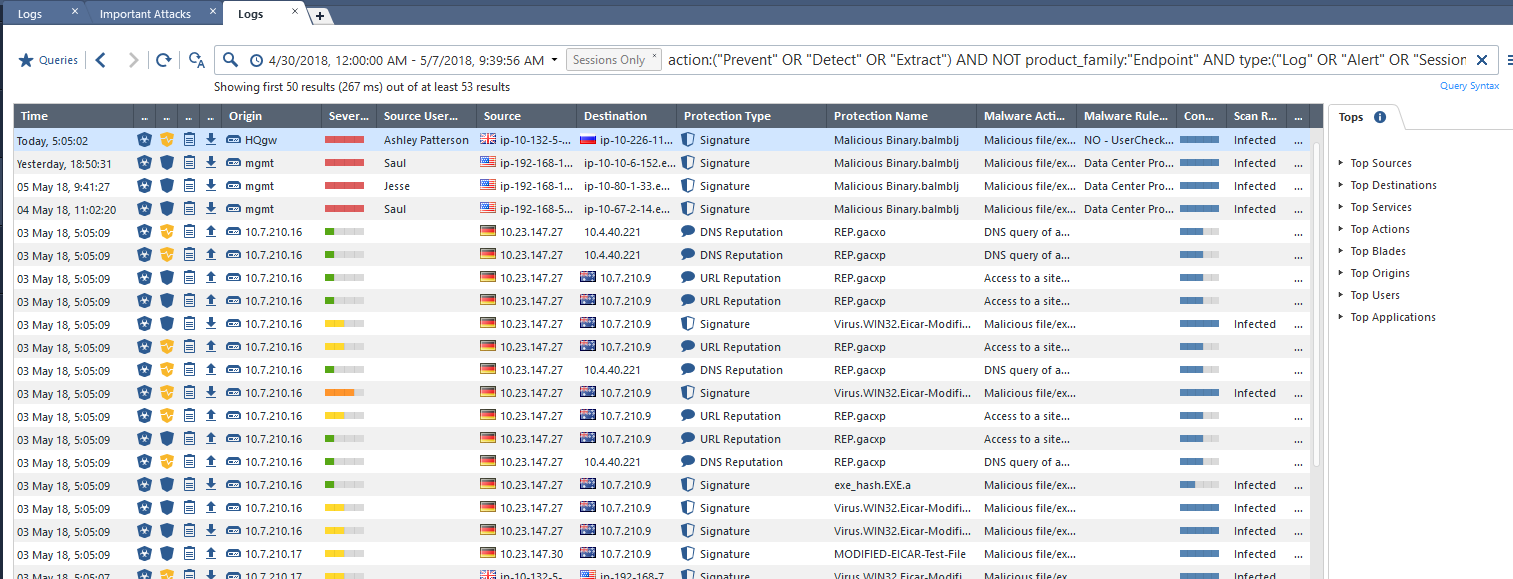
I will not talk in detail about the convenience of working with logs. But searching and filtering here is really convenient. Here is a link to the Logging and Monitoring R80.10 Administration Guide . This is a comprehensive guide.
The most frequently used dashboards can be added to Favorites for quick access:

Another plus that appeared in R80.10 is the ability to access dashboards and logs directly from the browser, without the need to install SmartConsole. To do this, it is necessary in the browser to follow the link https: // management-ip-address / smartview. As a result, we will see about the same thing:
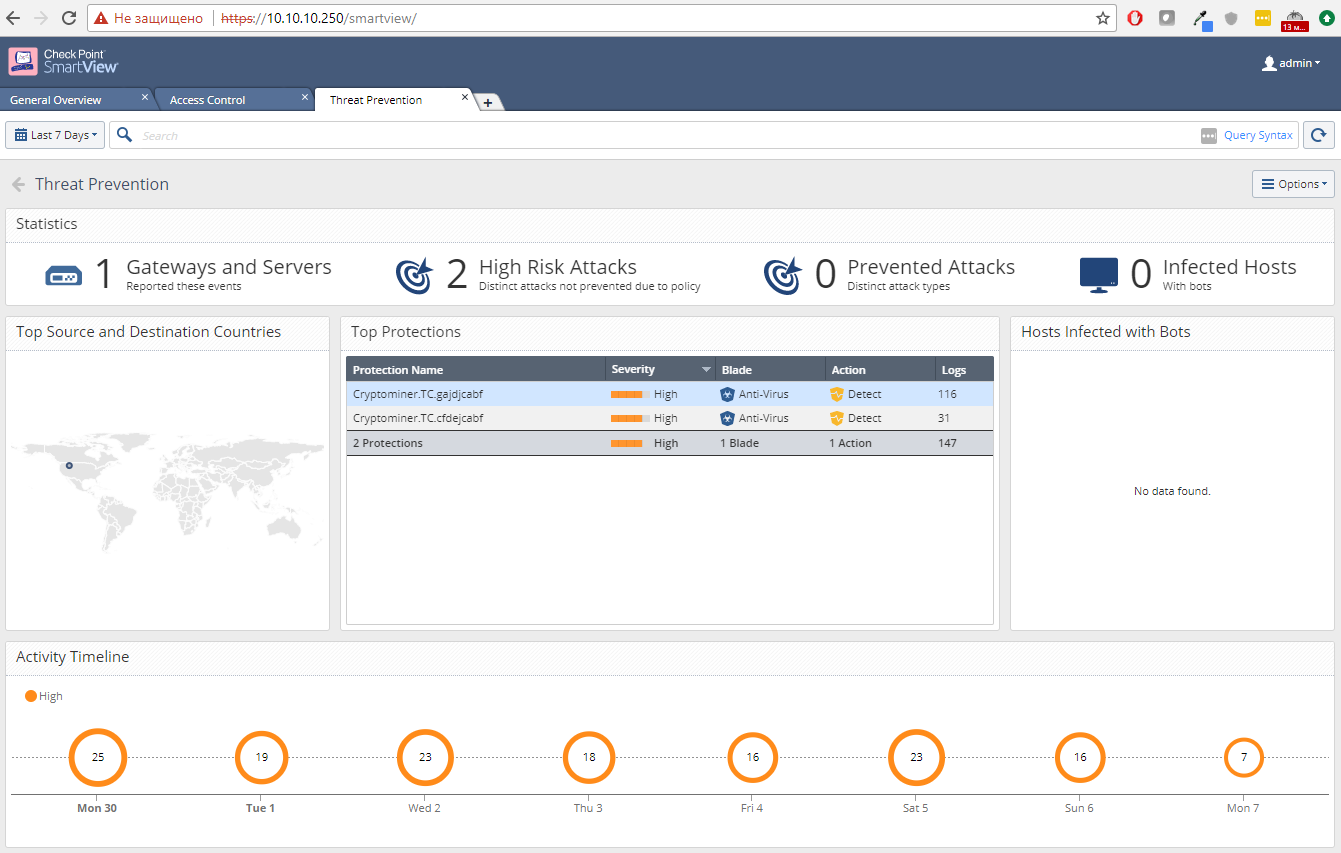
This is very convenient when you need to give your boss access to the dashboard. And of course this allows you to view reports from under Linux and MacOS (a full-fledged SmartConsole is only for Windows).
Creating your own dashboards
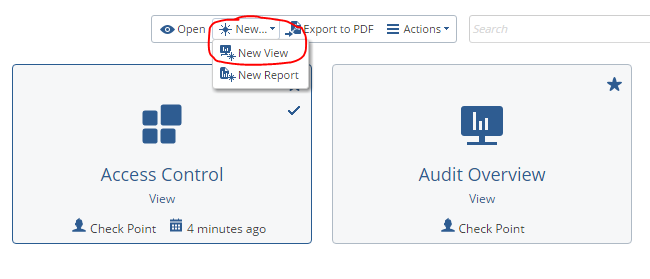
But the coolest thing in the Smart Event is not the presence of built-in dashboards, but the ability to create your own! And it is implemented very simply, no code, everything is done via a graphical interface. The process of creating your own dashboard is as follows:
1. Create a new dashboard New - New View
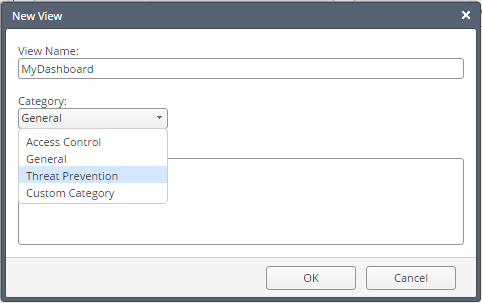
2. Give the name and define the category
3. Add a new Widget
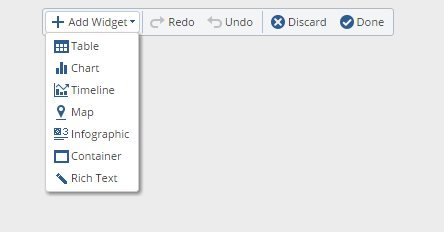
As you can see there are several options available at once. We will select the table.
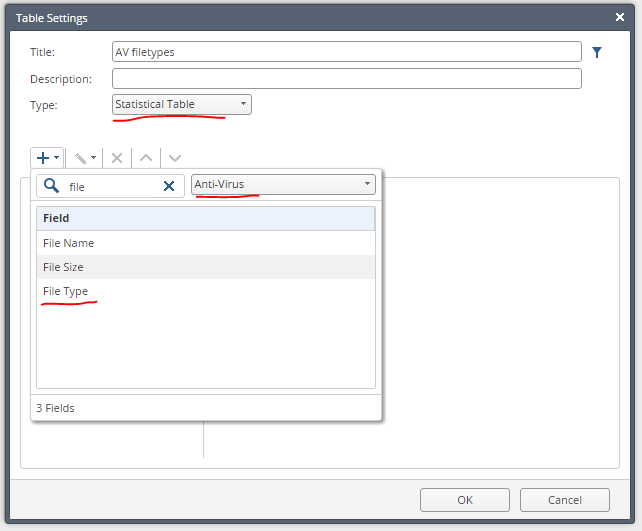
4. Let's create a label in which file types will be displayed and the number of anti-virus responses on them. To do this, first add the File Type field:
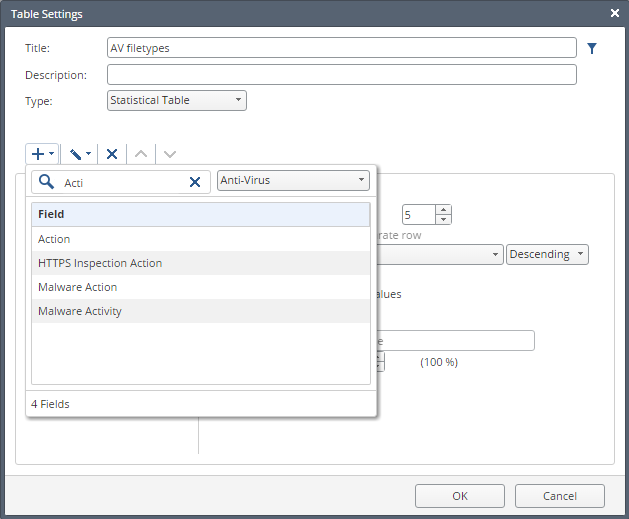
5. Add an Action field:
6. And add another Logs field to see the number of operations:

7. Get something like this:
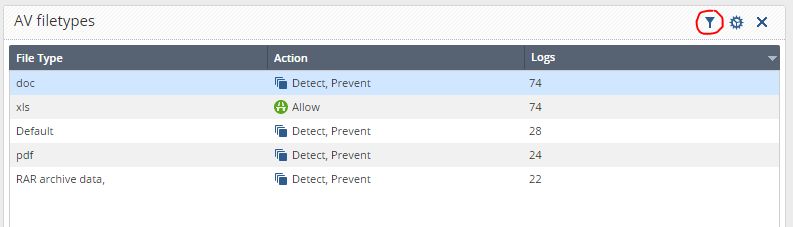
As you can see, both Allow and Detect and Prevent events are displayed here. And we are interested only in Prevent .
8. Add a filter by clicking on the icon (circled in red):
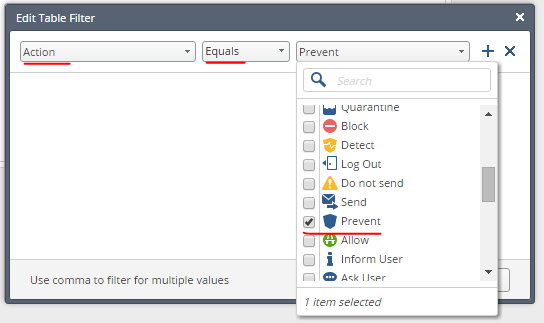
9. Applying the filter we get the final result - file types and the number of antivirus triggered by them:

The same statistics can be obtained in the form of infographics. With the help of such widgets, you can create dashboards literally for everyone.
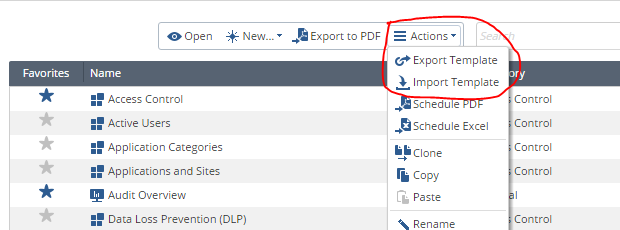
Import and export of dashboards
Another big advantage of these dashboards is that they can be imported and exported.
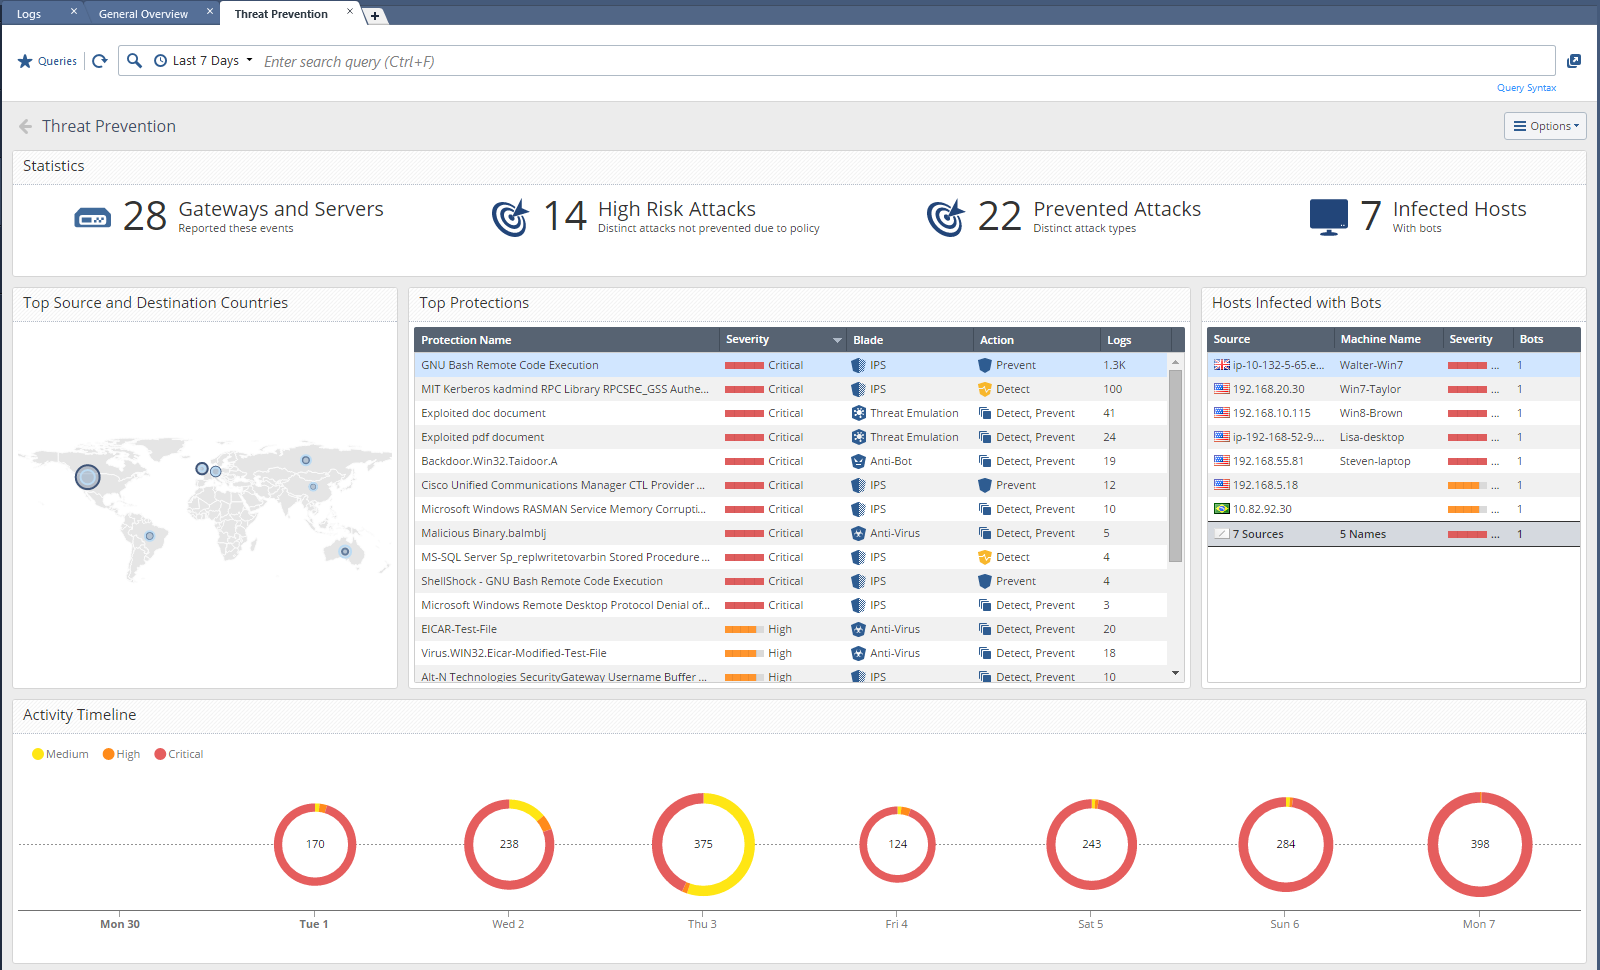
Those. You can create a dashboard and share it with a friend. Or vice versa, install yourself a dashboard designed by someone. For example, quite recently a new dashboard, the Threat Prevention Cyber-attacks dashboard , has been published in the official Check Point community ( CheckMates ) for public access. It looks like this:

There are still a lot of pictures, I will not duplicate, better look at the original .
Conclusion
In conclusion, I would like to clarify once again that I in no way wanted to say that embedded analytics is the most important thing in information security tools. Of course not. The quality of the IB functionality (Anti-Virus, IPS, etc.) is much more important here. But if excellent analytics and convenient dashboards are attached to this, then this is a good plus.
In general, good reporting can always be obtained using third-party and even free solutions. These are various SIEM or Log-management systems. Splunk, ELK, MaxPatrol, ArcSight, your choice. For example, for Splunk, we have already developed our own Check Point dashboards. How to do this, you can read here , or simply contact us by mail .
Not to miss other lessons, subscribe to our YouTube channel, VK group and Telegram .
PS You can play with dashboards in demo mode. How to do this can be found here .
Source: https://habr.com/ru/post/355010/
All Articles