Postgres auto_explain: query plan autolog
Very briefly I will show you how to set up a PG for logging query execution plans and how then, do not search through the logs for everything that was slowly executed
For automatic logging of execution plans there is an auto_explain module
This can be done in two ways:
')
All right, you can test
But the query that will debug the logs:
Go to the logs, there is a plan:
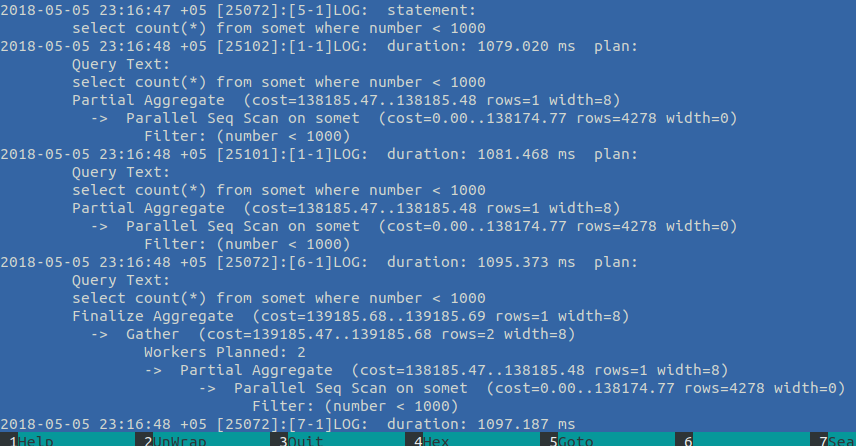
Actually it is good, only the nuance - the request was logged 4 times, and the plan - three times, why so - Parallel Seq Scan, namely - the request began to be processed in 2 streams (Workers Planned: 2) and then gathered into a common result (a new step in terms of PG10 - Gather). So it turns out exactly 3 plans for each request)
So, actually, we see on the fly that we have something bad - Sec Scan of thousands of lines
I am sure the index will help:
Everything, the auto-exposure module does not write anything to the logs:

It’s inconvenient to look through the logs with your eyes, so there is a utility, pgbadger , to search for such requests by logs . It groups and aggregates requests into a simple html report. And it will be as detailed as your logs are detailed.
Installation:
Report generation based on logs:
And this beauty is obtained:

In general, I will not talk about all the possibilities of pgbadger, because I don’t know them myself, but it has very good documentation, especially since there is a “ live report ” that will show everything more clearly.
And briefly, like us:
I do not have postgres on the local wheelbarrow, because first I will install
Ubuntu 18
> sudo apt install postgresql-10 Success. You can now start the database server using: /usr/lib/postgresql/10/bin/pg_ctl -D /var/lib/postgresql/10/main -l logfile start Ver Cluster Port Status Owner Data directory Log file 10 main 5432 down postgres /var/lib/postgresql/10/main /var/log/postgresql/postgresql-10-main.log update-alternatives: using /usr/share/postgresql/10/man/man1/postmaster.1.gz to provide /usr/share/man/man1/postmaster.1.gz (postmaster.1.gz) in auto mode Processing triggers for ureadahead (0.100.0-20) ... Processing triggers for systemd (237-3ubuntu10) ... > sudo -u postgres psql postgres psql (10.3 (Ubuntu 10.3-1)) Type "help" for help. postgres=# \password postgres Enter new password: 1 Enter it again: 1 postgres=# create DATABASE test; > sudo -u postgres psql test test=# show config_file; config_file ----------------------------------------- /etc/postgresql/10/main/postgresql.conf (1 row) auto_explain
For automatic logging of execution plans there is an auto_explain module
The auto_explain module provides the ability to automatically log plans for the execution of slow statements, which eliminates the need to manually execute EXPLAIN . This is especially useful for detecting non-optimized queries in large applications.Those. in Postgres it is possible to find out the request plan at the time of its execution
This can be done in two ways:
')
- By enabling the module for the request:
load 'auto_explain'; SET auto_explain.log_min_duration = 10; SET auto_explain.log_analyze = true; select count(*) from somet where number < 1000 - Enable the module on all requests on the server
 incidentally correct logging
Do not forget to use configstest=# SELECT pg_reload_conf(); pg_reload_conf ---------------- t (1 row)
All right, you can test
Test data generation
CREATE EXTENSION IF NOT EXISTS "uuid-ossp"; create table somet( id uuid PRIMARY key, number INTEGER, text text ); insert into somet select uuid_generate_v1(), round(random() * 1000000), round(random() * 1000000)::text from generate_series(1,10000000) But the query that will debug the logs:
select count(*) from somet where number < 1000 Go to the logs, there is a plan:
Actually it is good, only the nuance - the request was logged 4 times, and the plan - three times, why so - Parallel Seq Scan, namely - the request began to be processed in 2 streams (Workers Planned: 2) and then gathered into a common result (a new step in terms of PG10 - Gather). So it turns out exactly 3 plans for each request)
So, actually, we see on the fly that we have something bad - Sec Scan of thousands of lines
I am sure the index will help:
create index on somet (number) where number < 1000 Everything, the auto-exposure module does not write anything to the logs:
pgBadger
It’s inconvenient to look through the logs with your eyes, so there is a utility, pgbadger , to search for such requests by logs . It groups and aggregates requests into a simple html report. And it will be as detailed as your logs are detailed.
I will show on PG 9.6, because 10-ki log is not so demonstrative
Installation:
> sudo apt install pgbadger Report generation based on logs:
> pgbadger -j 4 -p '%t [%p]:[%l-1]' /var/log/postgresql/postgresql-9.6-main.log -o bad.html [========================>] Parsed 43578 bytes of 43578 (100.00%), queries: 115, events: 1 LOG: Ok, generating html report... And this beauty is obtained:
In general, I will not talk about all the possibilities of pgbadger, because I don’t know them myself, but it has very good documentation, especially since there is a “ live report ” that will show everything more clearly.
And briefly, like us:
- auto_explain is disabled
- We rarely use postgres logs, but pgBadger was used
- For real-time monitoring, we use okmeter at all, it showed itself perfectly, but sometimes there is nothing better than logs)
Source: https://habr.com/ru/post/354948/
All Articles