Fractal manifold method in Data Science problems
A criterion (SNR) was obtained that distinguishes the Gauss function, the distribution of random variables in the absence of mutual correlation, from other functions, which makes it possible to describe collective states with strong mutual correlation of data. The signal-to-noise ratio (SNR) in a one-dimensional space is determined and an algorithm is given for the calculation based on the fractal diversity of the fractal Cantor dust in a closed loop. The algorithm is invariant with respect to any linear transformations of the original data set, has renormalization group invariance, and determines the degree of mutual correlation of the data, taking into account the neighborhood or the collective effect. The description of the collective state is universal and does not depend on the nature of the data correlation, as well as the universality of the distribution of random variables in the absence of data correlation. The method is applicable for large sets of non-Gaussian or strange data obtained in information technology. In confirmation of the Koshland hypothesis, the application of the method to the data of the intensity of digital spectra of X-ray analysis with the calculation of the collective effect allows us to select a conformer exhibiting biological activity.
A method based on theoretical approaches in understanding the most common patterns of behavior of complex nonlinear dynamic systems forming collective states is presented. Review [1] introduces a number of non-standard ideas of applying fractal objects to the description of nonlinear dynamic systems that detect a self-consistent desire for critical or collective states. In the vicinity of the collective state, the number of degrees of freedom becomes minimal. In the language of space topology, this means that the fractal dimension of space decreases due to the appearance of discrete impermeable regions that model the collective state in a simple system.
Thus, the complexity of the nonlinear system is transferred to the complexity of space. At the same time, the universality of the geometric approach in the description of nonlinear systems from the problems of turbulence to artificial intelligence (self-organization) is manifested. In the development of these ideas, this article provides an example of constructing a fractal manifold based on the Kantor dust fractal.
A computational method is proposed that transforms the original non-Gaussian data into Gaussian, which allows us to compare quantitatively the structural characteristics of large data sets.
The transformed value of non-Gaussian data, which allows quantitative comparison, must be invariant with respect to any linear transformations of the values of the original data [2]. The problem has a solution only for ordered strange data and taking into account the neighborhood in which nonlinearity manifests itself. As shown in the paper, the transformation should have renormalization group invariance with respect to the size of the neighborhood in which a quantitative comparison of the manifestations of nonlinearity takes place.
The following are the key steps to deriving a quantitatively computed signal-to-noise ratio formula. The Cantor dust fractal or the geometric progression with an arbitrary value 0 <q <1 (in the classical fractal of the Cantor set q = 2/3) has the form:

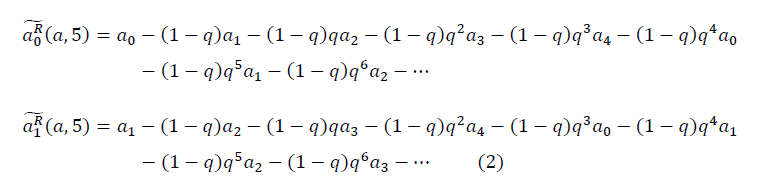
The following method is proposed for constructing a fractal manifold. Fractal manifold for n = 5 arbitrary set of five ordered numbers has the form:
')
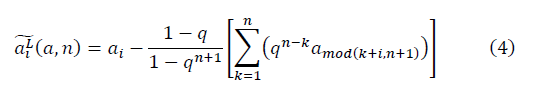
With each fractal cycle m, where m → ∞, a new number appears from a sample of non-Gaussian data n and further along a closed contour. The left and right directions of the circuit traversal are different. In general:
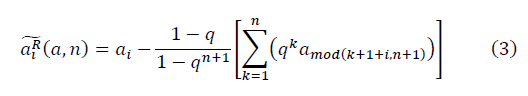
Similarly for it turns out:
Hereinafter, the formulas in the notation Mathcad.
The sets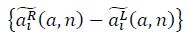 and
and 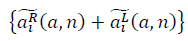 form fractal manifolds. The expression for the signal-to-noise ratio is determined:
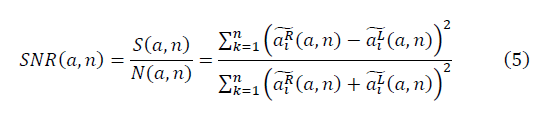
The uniqueness of the Gauss functions, the Bessel basis for the practical application of the method, is that the signal-to-noise ratio SNR in the definition (5) for these functions does not depend on the value of n. In real data, there are both random effects and collective effects caused by cross-correlation. The approximation of the data by a finite series of Bessel functions (approximately three to seven members of the series) leaves only the contribution of random variations. The approximation of the data by a Fourier finite series followed by an SNR transform makes it possible to isolate a collective effect.
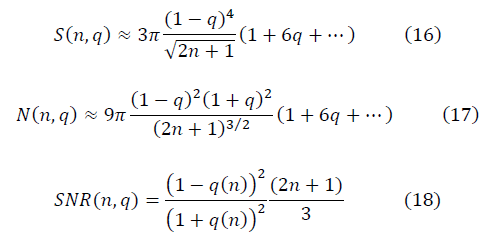
When modeling non-Gaussian half-wave data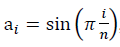 , which is used in calculations with preliminary approximation of data by a finite Fourier series, for sufficiently large values of n, the expression of the signal-to-noise ratio is:
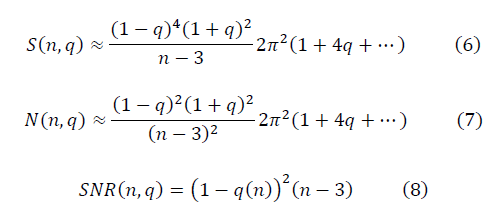
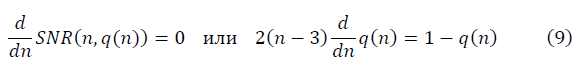
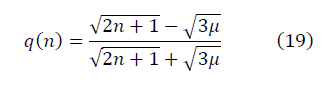
We require the condition of renormalization-group invariance SNR (n, q), which brings strange data to Gaussian: as n → n 'changes, q → q' transforms, leaving the SNR (n, q) value (8) unchanged in the renormalization group method. The requirement of renormalization group invariance is satisfied under the condition:
The solution of a differential equation is:
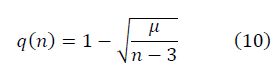
The choice of a constant value μ sets the scale of the signal to noise ratio.
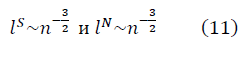
For large values of n, the asymptotics of the parameters of the length of fractal manifolds and
and 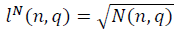 in the half wave model
  , taking into account the renormalization group equation for q (n) (10), have the form:
Hausdorff fractal Kolmogorov dimension [3] for fractal manifolds, constructed taking into account the direction of walking around a closed contour of n numbers:
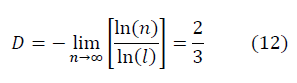
Average as for Gaussian numbers:
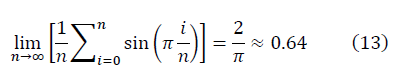
differs from the average in Kolmogorov for D = 2/3
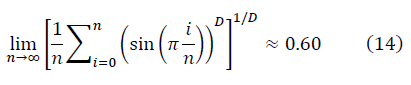
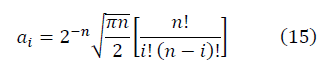
As an illustration of the fractal manifold method, calculations are given for binomial coefficients close to a Gaussian set, normalized to the asymptotics:
For sufficiently large values of n, the expression of the signal-to-noise ratio is:
Renormalization group equation for q (n):
Fractal dimension for normalized binomial coefficients D = 4/5.
The choice of the mean for non-Gaussian data as for Gaussian numbers often used in calculations is not unambiguous [2]. Not only the mean value itself, but also the type of formula for calculating the mean value is determined by strange data. The method of fractal diversity allows us to more accurately determine such a well-known characteristic of the structure as an average value, using a smaller scale as an instrument. compared to Euclidean scale
  and identify a qualitatively new structural characteristic — the degree of cross-correlation of data or the degree of collective data state determined by SNR.
Thus, the emergence of a dependence of the SNR on the number of samples n for non-Gaussian data is explained by the presence of a cross-correlation of non-Gaussian data. The introduction of the q parameter of the Cantor dust fractal and the application of the renormalization-group invariance method with respect to SNR allows us to proceed to the traditional analysis of Gaussian data — the degree of correlation of the data in the definition of SNR (5).
Preliminary calculations are performed for q = 0 using formulas (24) - (26). At the preliminary stage of calculations, when comparing different sets of ordered data, the critical sizes of descriptors n (cr1), n (cr2) are obtained that provide maximum collective states in the data sets. Then the value is taken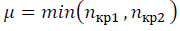 -3 in the formula (10) and the value is specified
 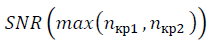 in view of the renormalization-group invariance (20) - (23). Comparing the SNR values of different data sets is correct when calculating on the same scale μ. Peak values
  characterize the presence of structure in the data of the variable x, denote the neighborhood of the collective state. The concept of a critical or collective state is characteristic in the approach of strange kinetics, denoting a cluster of degrees of freedom with a strong correlation. The behavior of the system in the vicinity of the collective state is universal and does not depend on the nature of the interaction causing the correlation [1], as well as the universality of the distribution of random variables in the absence of mutual correlation.
The approximation parameters of the finite Fourier series and the size of the descriptor n when passing the ordered data with a single step are determined from the condition of the maximum of the objective function - the maximum collective state in the system.
In the matrix form, the renorm-invariant formulas for the signal-to-noise ratio are:
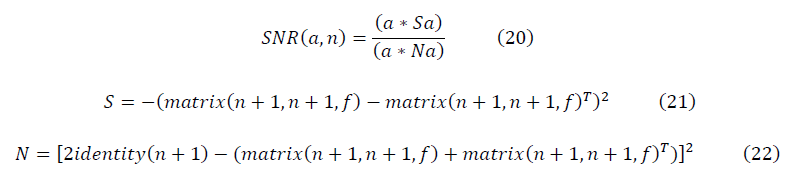
Where

The results of calculations by formulas (11) - (14) are equivalent to the results of the original calculations by formulas (3) - (5), while allowing the development of an algorithm.
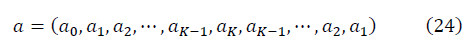
In the calculations, a symmetric vector is constructed from K = n / 2 + 1 unique ordered spectrum data:
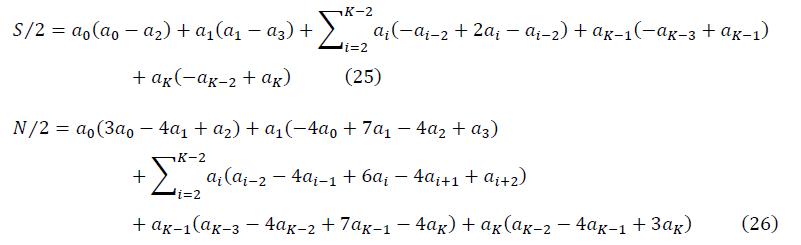
For sufficiently large K, when the condition of renormalization group invariance is satisfied, and q = 0, taking into account the symmetry of the matrices S and N, the formulas for the signal-to-noise ratio take the form:
When comparing the SNR values with the ordering scale, the scale is shifted to the left by the size of the K descriptor. An ordered data set, with a preliminary approximation by a finite Fourier series k, is passed by a descriptor, of size K, with a single step. Is calculated walk all the points in the dataset. The objective function is defined as
  when searching parameters K and k. As already noted, a correct comparison of the structural characteristics of the SNR of different data sets should be carried out on a single scale μ, taking into account the renormalization group invariance ((20) - (23)). Similar to the comparison of measurements made in centimeters and inches.
The computational method is used for large data sets obtained in good resolution, which allows to increase the scale of comparison μ while maintaining renormalization group invariance. In order of magnitude, in a problem with conformers, the total number of data in the X-ray analysis spectrum is 2250 values, the optimal descriptor size for a given resolution is K = 585, the maximum harmonic of a finite Fourier series is k = 3.
The method is applicable in determining areas with a strong correlation of degrees of freedom among themselves and a quantitative comparison of the degree of correlation of large sets of ordered data. For example, when the approach of Hartree-Fock is not applicable. Interpretation of data processing results is based on the construction of a fractal manifold, which models a collective or critical state [1] in a one-dimensional space. The interpretation is complicated by the ambiguity of terminology describing the collective state in different tasks.
The collective state in chemistry is called the flexibility or mobility of molecular fragments. The Koshland hypothesis of induced conformity with the manifestation of biological activity, based on the assumption of the flexibility of the active center of the enzyme, satisfactorily explains the action of the enzymes. As the substrate approaches the active center of the enzyme, a conformational rearrangement occurs synchronously in the enzyme molecule, affecting a large number of degrees of freedom. The application of the computational method to the spectrum of the three conformers shows a significant increase in the collective effect of the conformer, which is distinguished by biological activity. A similar, with the manifestation of biological activity, an example of a collective effect is manifested in the method of thermomechanical curve for polymers with different molecular weight in the field of high elasticity.
The application of the universal transformation formula to large sets of non-Gaussian data, taking into account the invariance properties with respect to any linear transformation and renormalization group invariance, makes it possible to quantitatively compare collective states. The method is used in solving data science problems in the preliminary transformation of the original non-Gaussian data and comparing the degree of mutual correlation of the data and in the search for quantitative structure-property relationships.
For four points, SNR coincides with the formula for the cross operator Roberts, one of the earliest algorithms for extracting boundaries in computer vision, which makes it possible to use the method in computer vision problems and image compression algorithms.
1. Introduction
A method based on theoretical approaches in understanding the most common patterns of behavior of complex nonlinear dynamic systems forming collective states is presented. Review [1] introduces a number of non-standard ideas of applying fractal objects to the description of nonlinear dynamic systems that detect a self-consistent desire for critical or collective states. In the vicinity of the collective state, the number of degrees of freedom becomes minimal. In the language of space topology, this means that the fractal dimension of space decreases due to the appearance of discrete impermeable regions that model the collective state in a simple system.
Thus, the complexity of the nonlinear system is transferred to the complexity of space. At the same time, the universality of the geometric approach in the description of nonlinear systems from the problems of turbulence to artificial intelligence (self-organization) is manifested. In the development of these ideas, this article provides an example of constructing a fractal manifold based on the Kantor dust fractal.
A computational method is proposed that transforms the original non-Gaussian data into Gaussian, which allows us to compare quantitatively the structural characteristics of large data sets.
2. Computational method
The transformed value of non-Gaussian data, which allows quantitative comparison, must be invariant with respect to any linear transformations of the values of the original data [2]. The problem has a solution only for ordered strange data and taking into account the neighborhood in which nonlinearity manifests itself. As shown in the paper, the transformation should have renormalization group invariance with respect to the size of the neighborhood in which a quantitative comparison of the manifestations of nonlinearity takes place.
The following are the key steps to deriving a quantitatively computed signal-to-noise ratio formula. The Cantor dust fractal or the geometric progression with an arbitrary value 0 <q <1 (in the classical fractal of the Cantor set q = 2/3) has the form:
The following method is proposed for constructing a fractal manifold. Fractal manifold for n = 5 arbitrary set of five ordered numbers
has the form:')
With each fractal cycle m, where m → ∞, a new number appears
from a sample of non-Gaussian data n and further along a closed contour. The left and right directions of the circuit traversal are different. In general:Similarly for
it turns out:Hereinafter, the formulas in the notation Mathcad.
The sets
and form fractal manifolds. The expression for the signal-to-noise ratio is determined:The uniqueness of the Gauss functions, the Bessel basis for the practical application of the method, is that the signal-to-noise ratio SNR in the definition (5) for these functions does not depend on the value of n. In real data, there are both random effects and collective effects caused by cross-correlation. The approximation of the data by a finite series of Bessel functions (approximately three to seven members of the series) leaves only the contribution of random variations. The approximation of the data by a Fourier finite series followed by an SNR transform makes it possible to isolate a collective effect.
When modeling non-Gaussian half-wave data
, which is used in calculations with preliminary approximation of data by a finite Fourier series, for sufficiently large values of n, the expression of the signal-to-noise ratio is:We require the condition of renormalization-group invariance SNR (n, q), which brings strange data to Gaussian: as n → n 'changes, q → q' transforms, leaving the SNR (n, q) value (8) unchanged in the renormalization group method. The requirement of renormalization group invariance is satisfied under the condition:
The solution of a differential equation is:
The choice of a constant value μ sets the scale of the signal to noise ratio.
For large values of n, the asymptotics of the parameters of the length of fractal manifolds
and in the half wave model , taking into account the renormalization group equation for q (n) (10), have the form:Hausdorff fractal Kolmogorov dimension [3] for fractal manifolds, constructed taking into account the direction of walking around a closed contour of n numbers:
Average as for Gaussian numbers:
differs from the average in Kolmogorov for D = 2/3
As an illustration of the fractal manifold method, calculations are given for binomial coefficients close to a Gaussian set, normalized to the asymptotics:
For sufficiently large values of n, the expression of the signal-to-noise ratio is:
Renormalization group equation for q (n):
Fractal dimension for normalized binomial coefficients D = 4/5.
The choice of the mean for non-Gaussian data as for Gaussian numbers often used in calculations is not unambiguous [2]. Not only the mean value itself, but also the type of formula for calculating the mean value is determined by strange data. The method of fractal diversity allows us to more accurately determine such a well-known characteristic of the structure as an average value, using a smaller scale as an instrument.
compared to Euclidean scale and identify a qualitatively new structural characteristic — the degree of cross-correlation of data or the degree of collective data state determined by SNR.Thus, the emergence of a dependence of the SNR on the number of samples n for non-Gaussian data is explained by the presence of a cross-correlation of non-Gaussian data. The introduction of the q parameter of the Cantor dust fractal and the application of the renormalization-group invariance method with respect to SNR allows us to proceed to the traditional analysis of Gaussian data — the degree of correlation of the data in the definition of SNR (5).
Preliminary calculations are performed for q = 0 using formulas (24) - (26). At the preliminary stage of calculations, when comparing different sets of ordered data, the critical sizes of descriptors n (cr1), n (cr2) are obtained that provide maximum collective states in the data sets. Then the value is taken
-3 in the formula (10) and the value is specified in view of the renormalization-group invariance (20) - (23). Comparing the SNR values of different data sets is correct when calculating on the same scale μ. Peak values characterize the presence of structure in the data of the variable x, denote the neighborhood of the collective state. The concept of a critical or collective state is characteristic in the approach of strange kinetics, denoting a cluster of degrees of freedom with a strong correlation. The behavior of the system in the vicinity of the collective state is universal and does not depend on the nature of the interaction causing the correlation [1], as well as the universality of the distribution of random variables in the absence of mutual correlation.The approximation parameters of the finite Fourier series and the size of the descriptor n when passing the ordered data with a single step are determined from the condition of the maximum of the objective function - the maximum collective state in the system.
In the matrix form, the renorm-invariant formulas for the signal-to-noise ratio are:
Where
The results of calculations by formulas (11) - (14) are equivalent to the results of the original calculations by formulas (3) - (5), while allowing the development of an algorithm.
In the calculations, a symmetric vector is constructed from K = n / 2 + 1 unique ordered spectrum data:
For sufficiently large K, when the condition of renormalization group invariance is satisfied, and q = 0, taking into account the symmetry of the matrices S and N, the formulas for the signal-to-noise ratio take the form:
When comparing the SNR values with the ordering scale, the scale is shifted to the left by the size of the K descriptor. An ordered data set, with a preliminary approximation by a finite Fourier series k, is passed by a descriptor, of size K, with a single step. Is calculated
walk all the points in the dataset. The objective function is defined as when searching parameters K and k. As already noted, a correct comparison of the structural characteristics of the SNR of different data sets should be carried out on a single scale μ, taking into account the renormalization group invariance ((20) - (23)). Similar to the comparison of measurements made in centimeters and inches.The computational method is used for large data sets obtained in good resolution, which allows to increase the scale of comparison μ while maintaining renormalization group invariance. In order of magnitude, in a problem with conformers, the total number of data in the X-ray analysis spectrum is 2250 values, the optimal descriptor size for a given resolution is K = 585, the maximum harmonic of a finite Fourier series is k = 3.
3. Conclusions
The method is applicable in determining areas with a strong correlation of degrees of freedom among themselves and a quantitative comparison of the degree of correlation of large sets of ordered data. For example, when the approach of Hartree-Fock is not applicable. Interpretation of data processing results is based on the construction of a fractal manifold, which models a collective or critical state [1] in a one-dimensional space. The interpretation is complicated by the ambiguity of terminology describing the collective state in different tasks.
The collective state in chemistry is called the flexibility or mobility of molecular fragments. The Koshland hypothesis of induced conformity with the manifestation of biological activity, based on the assumption of the flexibility of the active center of the enzyme, satisfactorily explains the action of the enzymes. As the substrate approaches the active center of the enzyme, a conformational rearrangement occurs synchronously in the enzyme molecule, affecting a large number of degrees of freedom. The application of the computational method to the spectrum of the three conformers shows a significant increase in the collective effect of the conformer, which is distinguished by biological activity. A similar, with the manifestation of biological activity, an example of a collective effect is manifested in the method of thermomechanical curve for polymers with different molecular weight in the field of high elasticity.
The application of the universal transformation formula to large sets of non-Gaussian data, taking into account the invariance properties with respect to any linear transformation and renormalization group invariance, makes it possible to quantitatively compare collective states. The method is used in solving data science problems in the preliminary transformation of the original non-Gaussian data and comparing the degree of mutual correlation of the data and in the search for quantitative structure-property relationships.
For four points, SNR coincides with the formula for the cross operator Roberts, one of the earliest algorithms for extracting boundaries in computer vision, which makes it possible to use the method in computer vision problems and image compression algorithms.
4. Literature
- Green LM, Milovanov A.V. Advances in the physical sciences, Fractal topology and strange kinetics: from percolation theory to the problems of cosmic electrodynamics, - 2004, №8, P.809 - 852
- Orlov A.I. Application statistics. - M .: Exam, 2006. - 574
- Kolmogorov, AN, New Metric Invariant of Transitive Dynamical Systems and Automorphisms of Lebesgue Spaces, - 1958, Reports of the Academy of Sciences of the USSR, No.5, P. 861 - 864
Source: https://habr.com/ru/post/354898/
All Articles