Biomechanics. Start
We represent the guest post of students of the St. Petersburg State Electrotechnical University "LETI" them. V.I. Ulyanov (Lenin).
Good day to all! We are LETI students Hovsepian Arthur ( Artsearcher ) and Quindt Paul ( Paul_Quindt ). We have dedicated all our conscious activities at the university to working with 3D models of the anatomical structures of the human body and their biomechanical analysis under the guidance of Professor Boris P. Begun, Dr. Sc. (Tech.), Associate professor, Ph.D.
What is it for?
First, the information obtained by classical methods of visualization of anatomical structures, such as computed tomography (CT), magnetic resonance imaging (MRI) and angiography is most often used in part and is evaluated by doctors qualitatively. At the same time, the processes recorded by these methods carry information, which, in particular, is associated with an explanation of the nature of the occurrence of pathologies of human structures.
')
According to our ideas, it is hardly possible to understand the nature of the pathologies in the image. But in conjunction with mathematical modeling, this task is real.
Secondly, biomechanical modeling has found wide use in preoperative planning, rehabilitation, and radiation therapy planning. Modern methods of visualization and analysis provide an opportunity to pre-evaluate the outcome of the operation.
Consider this by example.
We are faced with the task of eliminating the pathological narrowing of an organ (vessel, airway, esophagus) with the help of an inflated balloon ( balloon angioplasty ). It would be nice to know how to inflate the balloon. This process can be modeled and identify the optimal values of pressure in the cylinder, in which there will be no rupture of the structures of the body or remission. This question is part of preoperative planning, which is particularly relevant in the pathology of the heart valves.
But, it would seem, they modeled the situation, got the values and everything, we apply the technique. No, the individual structure of patient structures requires an individual approach to modeling.
Unfortunately, the steps that precede the mathematical analysis, and the analysis itself are beyond the knowledge of most doctors, and medical knowledge is not available to specialists who own the mathematical apparatus. This is where we [fanfare] come on the scene. Of course, we do not claim the title of aces in these two spheres, but we can call ourselves points of contact.
Stages of biomechanical analysis
In principle, if we ignore the formulation of the global problem, the biomechanical analysis can be divided into three stages:
- Creating a model.
- Introducing assumptions and setting boundary conditions.
- Mathematical analysis.
By assumptions, we mean the impossibility to take into account all the parameters of the model under consideration. Trite, almost all tissues of the body are anisotropic , we are not talking about the biochemical nature of most of the processes in the body, which is described by atomic and molecular models. So a number of assumptions are introduced into any biomechanical model in order to reduce its complexity, but, logically, the fewer the assumptions, the more adequate the model.
Now about the boundary conditions. We perform mathematical calculations in CAE-packages ( Computer aided engineering ) Abaqus, Ansys, Nastran, Cosmos, LS-dyna and others, depending on the type of the task. All these packages are based on finite element solvers, which are intended for solving a boundary value problem (it’s a boundary problem ) for systems of differential equations. The introduction of boundary conditions is necessary to find a unique solution on the boundary of the considered region.
We decided to devote this article to the first stage of biomechanical analysis - the creation of a model of the human anatomical structure as a biological object.
Modeling
To begin with, we should familiarize ourselves with the basic ways of creating 3D models of anatomical structures.
Let's start with the basics. For most people, when mentioning the words “construction” and “3D model”, the following sequence of actions immediately appears in the head:
- Select an object.
- Geometry study.
- Creating a virtual image of the object according to its geometrical parameters.
However, when working with anatomical structures, with this approach, a number of problems arise:
First, inaccessibility. Most often, we cannot see with our own eyes the organ we need. The geometric parameters and mechanical properties of tissues have to be studied by any kind of visualization, or by means of preparation.
Secondly, the geometry of the objects under study is often very complex, because of which it is necessary to introduce simplifications in the construction, and this leads to a decrease in the reliability of the study.
Thirdly - time. The use of this method to create models of anatomical structures requires a lot of effort and time, due to the individuality of each object of study.
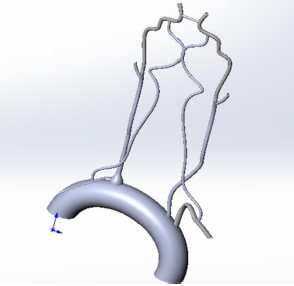
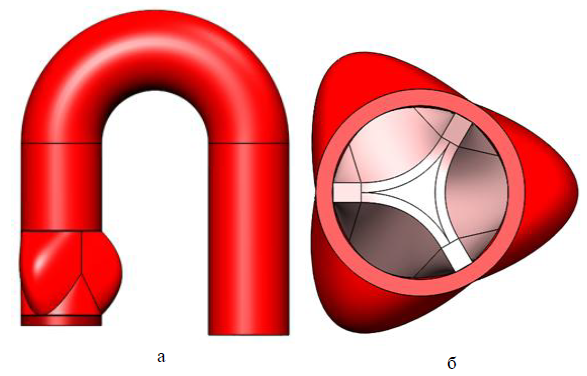
In the figures below are 3D models of human internal organs: the vessels of the circle of Willis and the aortic valve (a is a front view, b is a sectional view from above) constructed by us and our colleagues manually using various CAD systems (most often SolidWorks). As you can see, they are not natural enough, although we tried to take into account the maximum aspects.
But this is still far from the most complex structures of the human body. If, for example, you want to examine a whole organ, for example, a kidney or liver, we are even afraid to imagine how long it will take for you to build such a structure, taking into account all the features of the organ. And we are not sure that at the output you will have a fairly reliable model, the results of the study of which may be applicable to real objects.
Everything is bad?
Not! There is an alternative way to build models - reconstruction by CT. In general, CT is the distribution of X-ray density ( Hounsfield scale ) and the denser the tissue structure, the brighter the corresponding area on the CT.
Tomographs allow obtaining images in the DICOM format (sections) with some step (the more modern the scanner is, the smaller the step), and this in turn makes it possible to reconstruct a polygonal model. Reconstruction of a polygonal model is almost always implemented through a marching cube algorithm . It so happened that for convenience, polygonal models are converted into an STL file. To do this, you need to triangulate the polygonal model.
There is software for these needs, and the most famous is Mimics Materialize. This is a product line that implements many tools for segmentation, generation of 3D models with conversion to an STL file, and even preoperative planning.
But we have not developed this software. The reason is purely subjective - an inconvenient tool for segmentation in 3D mode.
Way out
Since we are not physicians and it is easier for us to be guided by 3D models, it is better for us to switch from CT to 3D visualization as quickly as possible.
Our task was to investigate the gas dynamics of the upper respiratory tract. To do this, it was necessary to find a database of CT images, reconstruct and segment the zone of interest, generate an STL file and import it into a CAE package.
Everything is clear with the first and the last: for the pictures to the doctors, for the analysis to Abaqus, but I had to tinker with the solution of the issues of segmentation and high-quality triangulation .
For this kind of operations, there are special programs - DICOM-Viewers. We turned to different solutions, but all of them, for one reason or another, did not satisfy our needs.
And here, in the search process, we stumbled upon the article Dicom - a look from the inside . The article is devoted to the product Inobitec DICOM-Viewer of the Russian company INOBITEK , and it was decided to stay on it. This Viewer is fully fit for the stated purposes. In our subjective opinion, this Viewer gives the output the best quality of the model and the grid that we have seen. In addition, it is provided in Russian.
The following is an example of a model of the anterior abdominal wall obtained with the Inobitec DICOM-Viewer.
However, in rare cases, the STL file is not immediately suitable for import after it is generated, then we correct the mesh in the MeshLab software and then convert the STL file to a STEP file . Files of this format are suitable for reading by almost all CAE packages.
From theory to practice
In brief, we will show the solution to one of the problems with the upper respiratory tract. Suppose a patient with obstructive sleep apnea . By reducing the overall tone of the upper respiratory tract, the so-called collapse of the respiratory tract occurs (a decrease in the initial diameter of the respiratory tract). When the apnea is running, it is likely that if you inhale, collapse (collapse) of the upper respiratory tract will occur and pulmonary ventilation will stop, while attempts to inhale will continue, due to which a person cannot breathe for a while.
We need to simulate and explore the conditions of collapse.
Start by creating a 3D model. In this article we will look at two segmentation paths from the DICOM-Viewer presented in Inobitec:
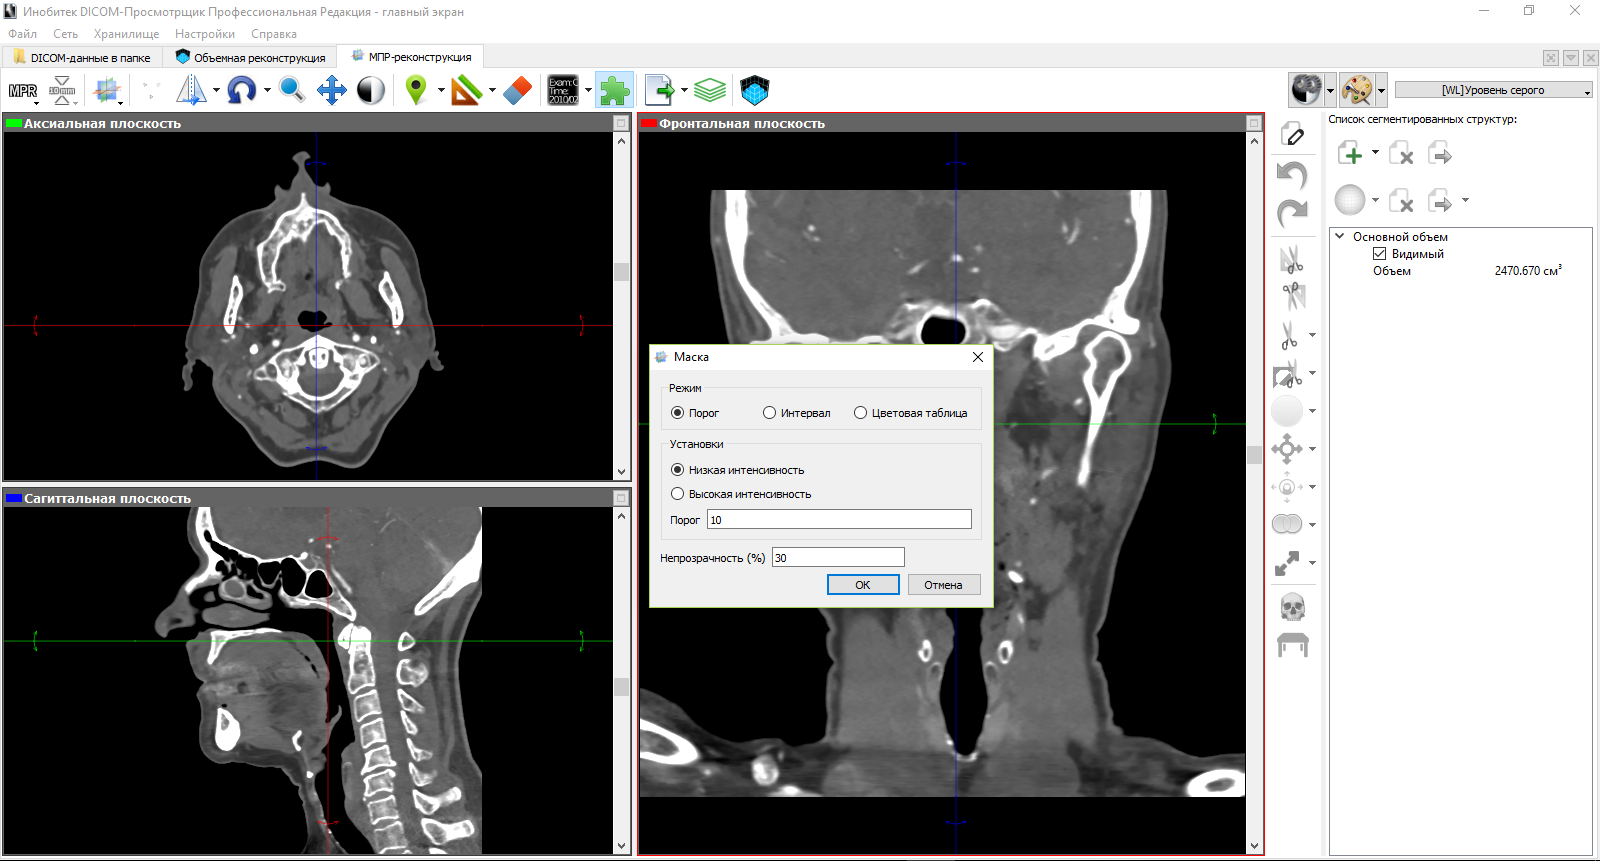
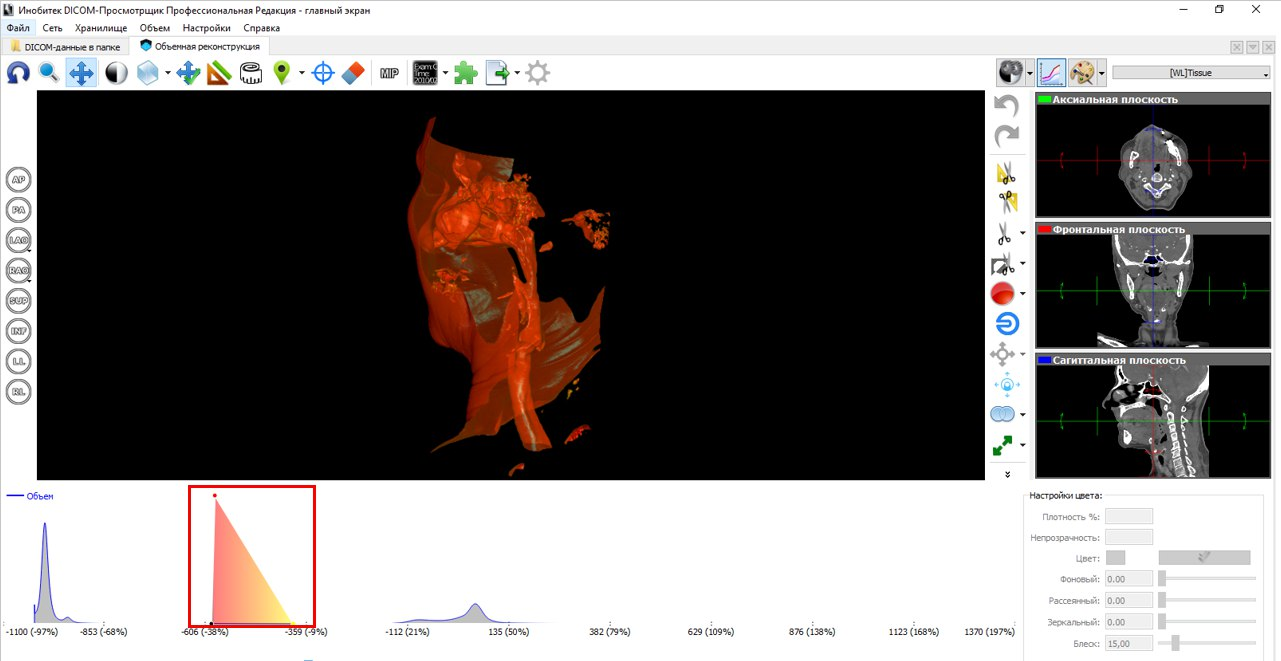
The figures below illustrate the principle with a layer-by-layer selection of the zone of interest, as in Mimics Materialize. In the mode of multiplanar reconstruction, we set a threshold for intensity, thereby cutting off most of the structures that we are not interested in.
Next, we accept manual segmentation. In the figure below, we illustrate the segmentation on the frontal plane using the build tool. Parameters for this tool include area and step change segmentation. On the sagittal and axial planes visible segmented layers corresponding to the selected structure on the frontal plane.
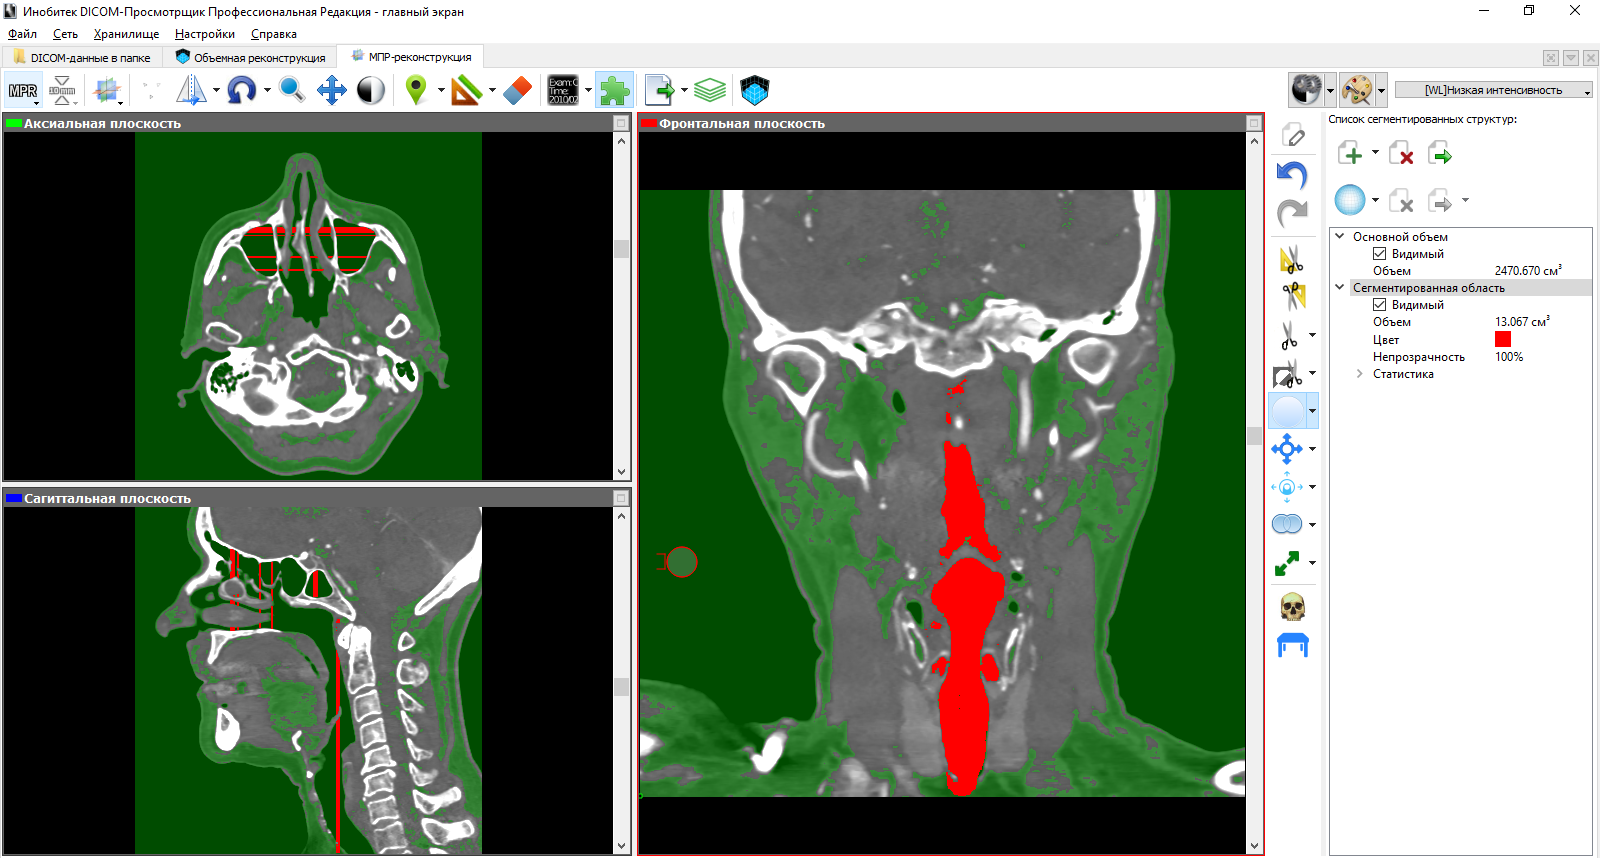
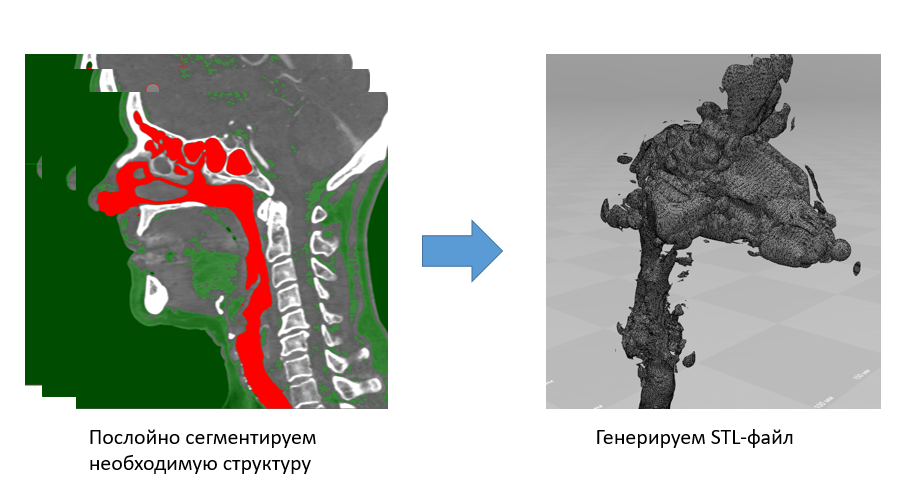
Ultimately, we get a new set of CT slices with a segmented structure only. The approach to segmentation from this side leaves much to be desired, since one has to spend a lot of time.
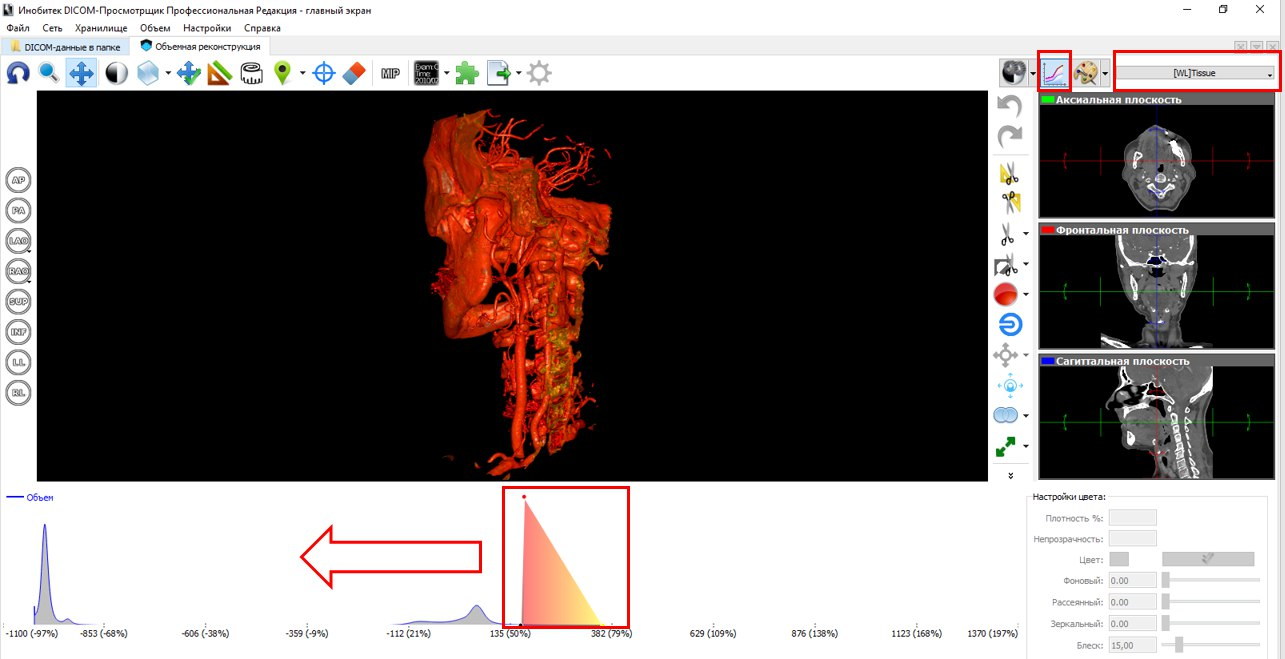
But segmentation on a three-dimensional model is another matter. At a minimum, it's much easier for us to navigate through it. Without exaggeration, we save our time at times. If in the first case we set one threshold of intensity and manually select the zone of interest, then in the case of 3D segmentation we change the transfer characteristic of the 3D image visualization and then manually delete unnecessary segments.
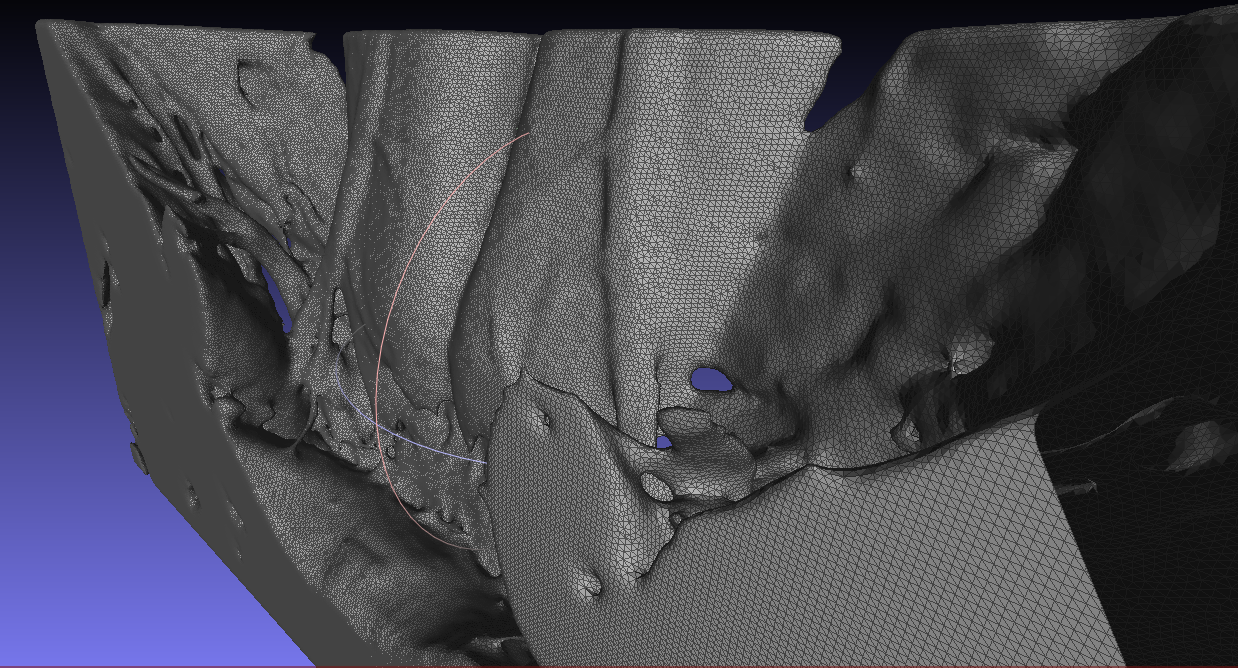
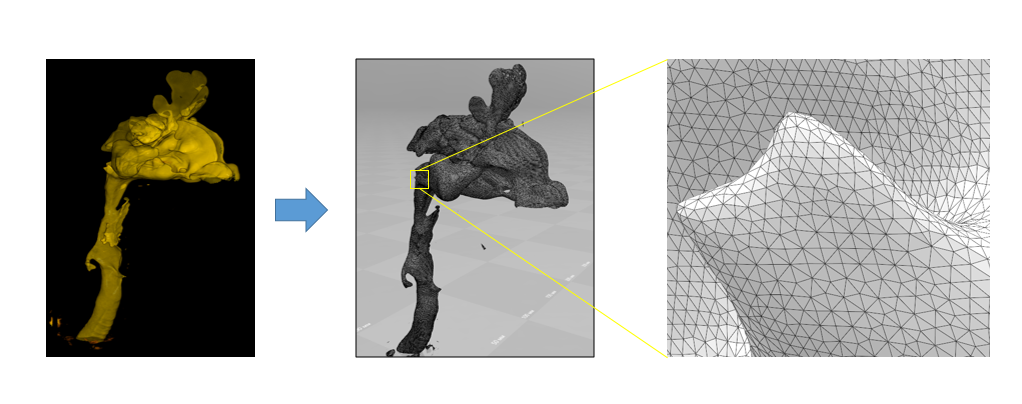
The following figure to the left depicts a segment of the respiratory tract, including the nasal and oral pharynx, epiglottis, the entrance to the larynx and part of the trachea. In our opinion, the number of segmentation artifacts in the received STL files is minimal. But the most important thing is the quality of the grid. We believe that Inobitec DICOM-Viewer'e an excellent triangulation algorithm is implemented.
Actually, the model received. What's next?
In fact, we have a coherent task - due to the negative pressure created in the lungs during inhalation, the lumen of the respiratory tract narrows. We solve such problems in the Abaqus CAE package, but in principle, they can be done in others where there is a FSI ( Fluid – structure interaction ). For the sake of demonstrations, we will try to simulate the first 0.3 seconds of inhalation in order to trace the narrowing of the airway lumen. A negative pressure is applied to the input of the model (from the side of the lungs), and the output is a velocity value equal to zero. To save time, we simplified the model, removing part of the nasal cavity, and introducing a large number of assumptions (isotropy, fixing only the input and output faces, the absence of prestressed states, the constant value of pressure), but this does not completely distort reality.
Analysis results
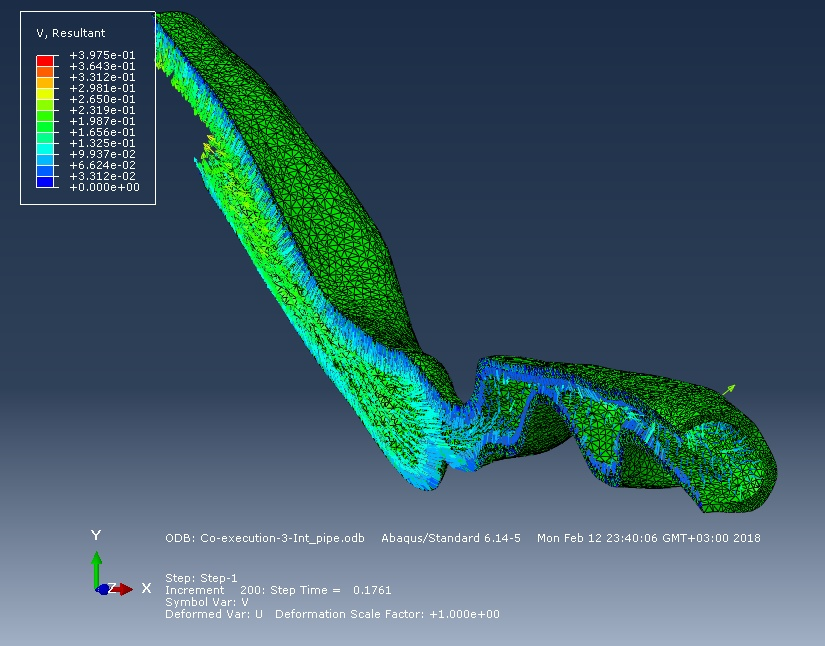
So, the figure below shows a picture of the spatial movements of the surface of the respiratory tract and their speed at the time instant of 0.25 seconds. The flow created by the negative pressure "tightens" the walls of the respiratory tract inside.
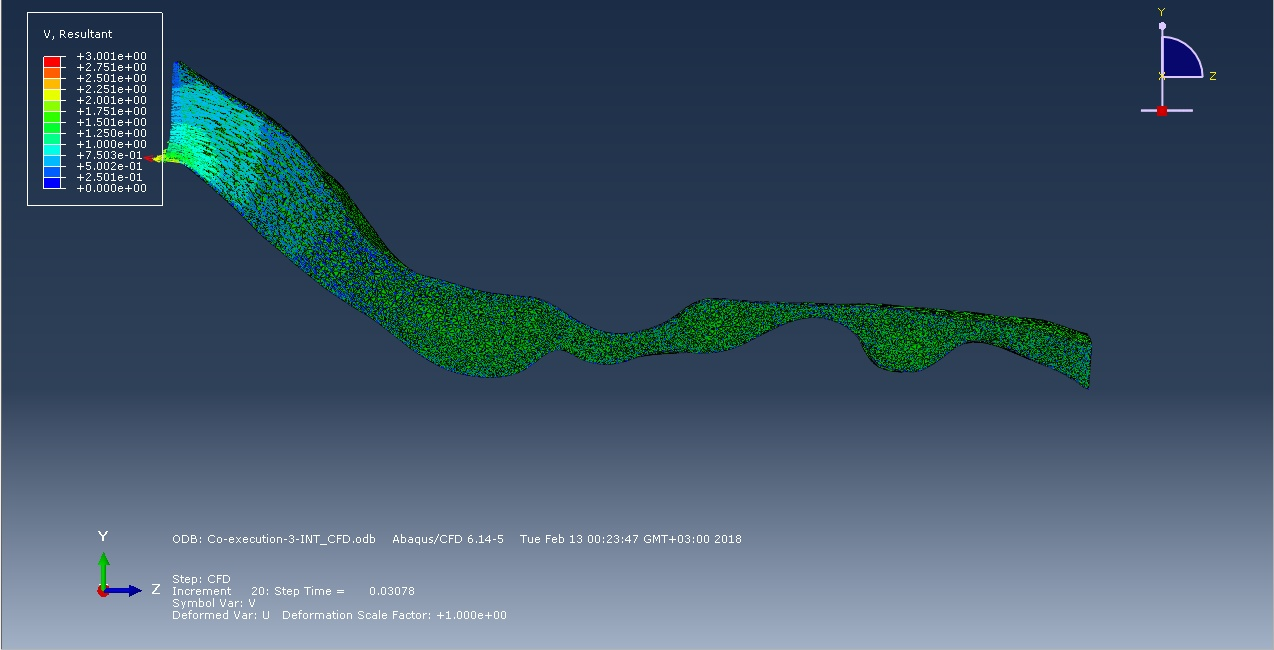
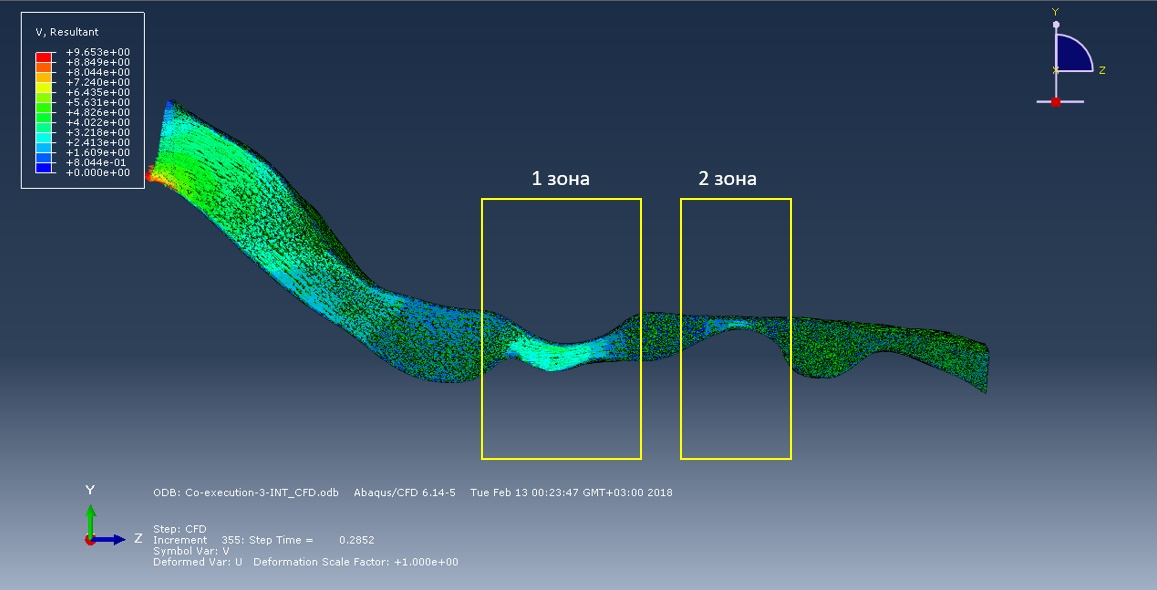
The following figures show the air flow diagrams almost at the beginning of the inhalation phase and to 0.3 second of inhalation. According to the logic of things, the smaller the cross section, the faster the flow, therefore, the probability of collapse in this area is greater. But the simulation of the first 0.3 seconds of inhalation showed that in zone 2 the flow rate is less than in zone 1, despite the diameter of the cross-section of the respiratory route. In the future, we plan to explore the full breathing cycle.
Conclusion
In this article, we do not pretend to adequacy in the formulation of the problem. First of all, we want to introduce you to the activities that we do every day and the methodology that we use to create three-dimensional models. And also, to inform that if we correctly approach the formulation and solution of the problem, this activity turns into a serious science, connecting doctors and engineers, partly shedding light on the great variety of processes within us.
Maybe someone will discover an interesting new direction, will find creative application of our knowledge in other areas of science and production, and someone just read our work with interest.
If this happens, we will be happy to open for you new possibilities of biomechanics in the following articles.
Thank you all and good luck!
Literature:
- Runner P. I., Shukeylo Yu. A. Biomechanics. - SPb .: Polytechnic, 2012. - 463 c.
- Begun, P. I., Afonin, P. N. Modeling in Biomechanics. Textbook // M .: Higher School. - 2004. - 391 p.
- G. Basharova, D. Basharova. Study of blood flow in atherosclerotic lesions of the internal carotid artery // SPbPU Science Week November 13-19, 2017 (IAMM) - P. 267–2.
- AL Ovsepian, AA Anisimov, EV Lebedeva, Trong Huu Tran. IEEE International Conference on Soft Computing and Measurements (SCM) - 2017. –P. 159–161.
- P. A. Quindt, A. L. Hovsepian, A. I. Al-Kiswani, P. I. Begun. Biomechanical studies of the state of stenotic aortic valve structures in balloon dilatation // News of St. Petersburg Electrotechnical University "LETI" - 2018. - №1. - pp. 77–82.
Source: https://habr.com/ru/post/354832/
All Articles