How to make the state open, Part 1: Downloading road accident statistics with your own hands
If you search well, you can find quite a lot of useful, decent quality, state information. But unfortunately, it is still not: EGE and education, weather, cartography, data on crimes ... and accidents.
Therefore, I have two lives: in one I help officials open data that people or organizations ask for, and in the other I write parsers that convert public databases of particularly “stubborn” government bodies into open data and teach others that, There will be a lot of projects, the state will accept the inevitable and put everything in a convenient form.
This article will be the first manual in the series “How to get machine readable data from state sites”. So, today - about the statistics of the accident, and since the state does not give it to us, we will learn to take it on our own. By tradition, the code and data are attached.
')
According to the report of the World Health Organization, in Russia in 2013, accidents accounted for 18.9 deaths per 100 thousand people, in Sweden - 2.8, and in Belarus - 13.7.
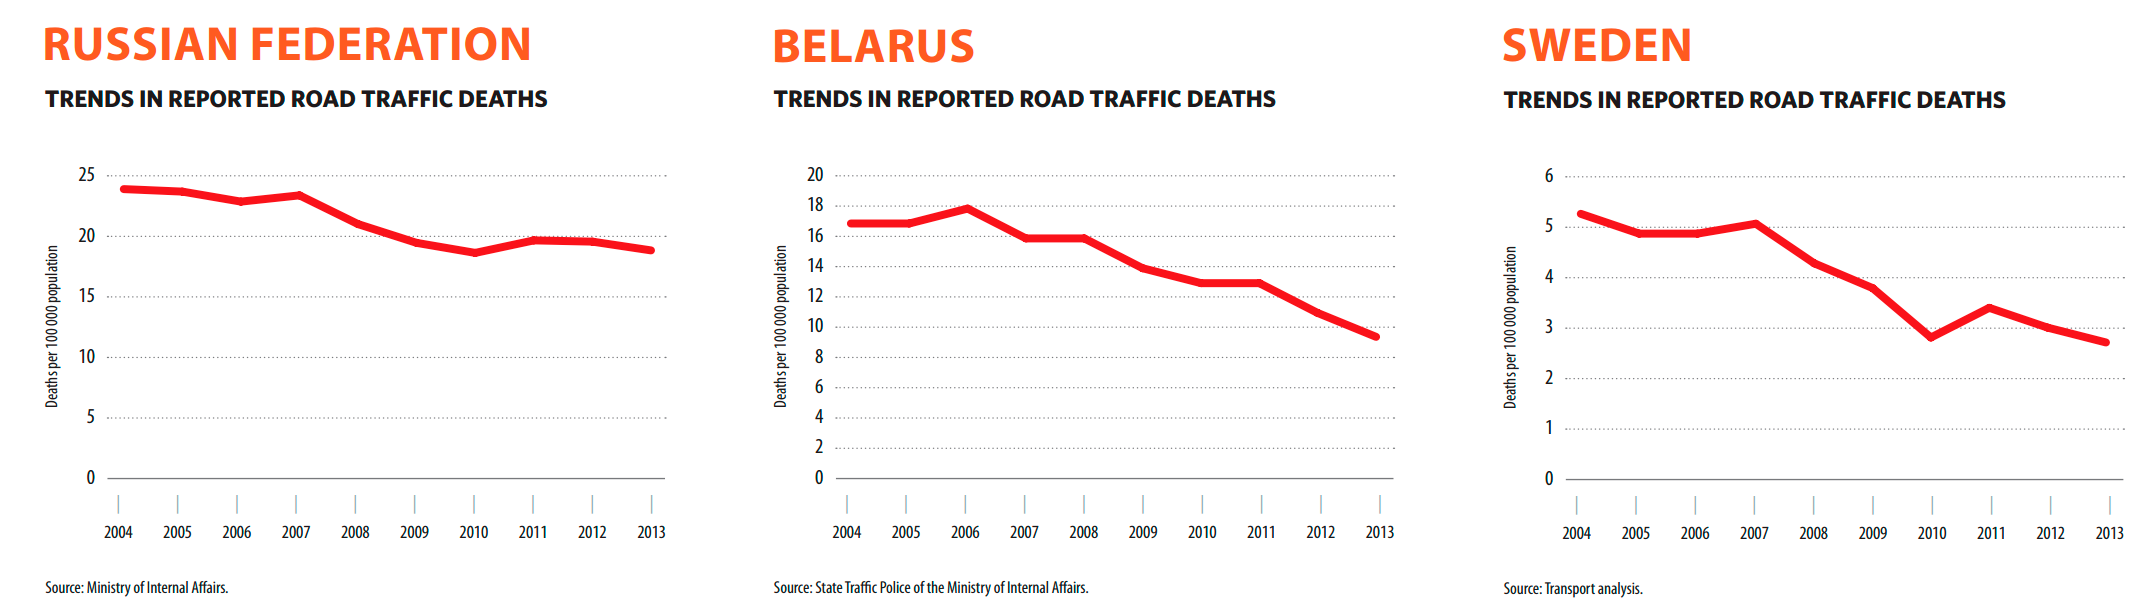
However, in 2017 in Belarus, the mortality rate dropped lower than in the EU countries, but in general for 10 years has decreased threefold. The pictures show another interesting point: while for Russia the situation has hardly changed since 2010, in Belarus and Sweden the red line of death is persistently downward.
The reason for the miracle is in the Swedish program Vision Zero , which says that it is difficult to get people to be more attentive and responsible, but you can make sure that the environment itself ensures the safety of people.
In Belarus, on the basis of this idea, the Minus One Hundred program was launched (minus 100 deaths every year), but at some point the capabilities of speed bumps, speed reduction and traffic control ceased to produce a noticeable effect.
Then I had to turn to the data. The findings of this analysis were unexpected: in Minsk, for example, they struggled with drunk drivers with might and main, and there were 2% of them. Yes, and the people kept the speed, so that was not the case. The real reason turned out to be pedestrians invisible in the dark and the morning distraction of drivers (32 of 41 deaths in Minsk in 2017 were pedestrians, and the most frequent fatal accidents occurred between 00: 00-03: 00 and 06: 00-09: 00).
Of course, in Russia, researchers more than once came to the idea that, having studied the statistics of road accidents, it would be possible to find and explain “bad” places on the roads. Back in 2012, Novosibirsk activists created a map of an accident involving pedestrians, daily from October 2012 to March 2013 collecting reports of local traffic police, and in general the idea was constantly in the air.
Opportunities to conduct an adequate analysis of accidents in Russia appeared along with the traffic statistics statistics from the traffic police, under which at least in 2016 it was already possible to find data with reference to the exact address and time, and in 2017 there appeared information in total (!) Access one can only dream: the details of the road situation, the time of day, the details of the accident and the damage and so on. In all this there was only one “but”: the data could be downloaded only ... one municipality at a time. The municipality is, for example, one district of Moscow.
So, Method 1 : three mouse clicks to get to the data on some district of Moscow on stat.gibdd.ru , and three more - to download them (thanks, at least in xml, but about json, dear pythonists, in forget this version). Let's calculate: in 85 regions of Russia we have 2423 municipalities, in total:
Meditate:
So that you are not upset, there is also Method 2 : Responsible Safety Roads . The Ministry of Communications and Mass Media (there is a suspicion that they also download stat.gibdd.ru ).
In the “Open data” section, incomplete statistics first appeared in the “flat” form in csv, in 2017 it became detailed in json, but ... Something constantly happens to this resource: in July 2017 detailed data was posted, but all of August The site did not work due to expired security certificate. Then he earned again, but nobody updated the data. As of the beginning of May 2018, an update appeared, but the detailed data disappeared again - weather conditions, the nature of vehicle damage and much more (in figures it is 90 MB instead of 603 MB for 2017).
But Russian programmers do not give up, and during this time many good projects have been created: road accident statistics for Barnaul and Moscow from Sergey Ustinov jimborobin , detailed research from Alexander Kukushkin alexkuku , visualization from Konstantin Varik.
upd: thanks to HuGo , two more projects were added: “Zero Deaths” in Krasnoyarsk and dtpstat.ru in Kirov.
upd2: I recommend to read a deep study from Alexander Elmekeev. The display on the map is not working now, but the source code remains, incl. to fix geotagging.
And two long-term projects: “Zero Deaths” - our answer to Vision Zero and a very recent project on the analysis and prediction of accidents on the roads of St. Petersburg - you can see here (better through IE), the guys are planning its development in the coming months.
Of course, a new parser was quickly created for each project ...
The parser , which, I hope, now works completely stably, I actually wrote exactly a year ago (and yes, this article should have been attached to it). Its task is to provide researchers with fresh data, so there is even a command line and manual.
But before proceeding to the code, let's first learn how to independently explore sites. We will need: Chrome browser and Postman application (at the same time install the Postman Interceptor add-on).
After installation, type chrome: // apps in the address bar of the chrome: // apps , a page will open with installed applications, among which will be Postman .
There are different site engines. The simplest ones are controlled through the address bar, in which you can set parameters. stat.gibdd.ru is different: it works on the principle of combining a url command and a data packet in json. Nevertheless, the research strategy of all sites is the same: we run Chrome DevTools , we force the site to do what we need, and we closely monitor the changes in the debugger window.
So, let's try to get data for some area of Moscow.
Open stat.gibdd.ru , choose the period, which one you like (I have the whole 2017), press the “Apply” button next to it.

Next on the map, select Moscow and you can run the debugger: right-click somewhere on the map, select "View code" and see the DevTools window. We find in it in the menu the Network tab. It is better to immediately change the filter from All to XHR to remove unnecessary requests that we do not need.
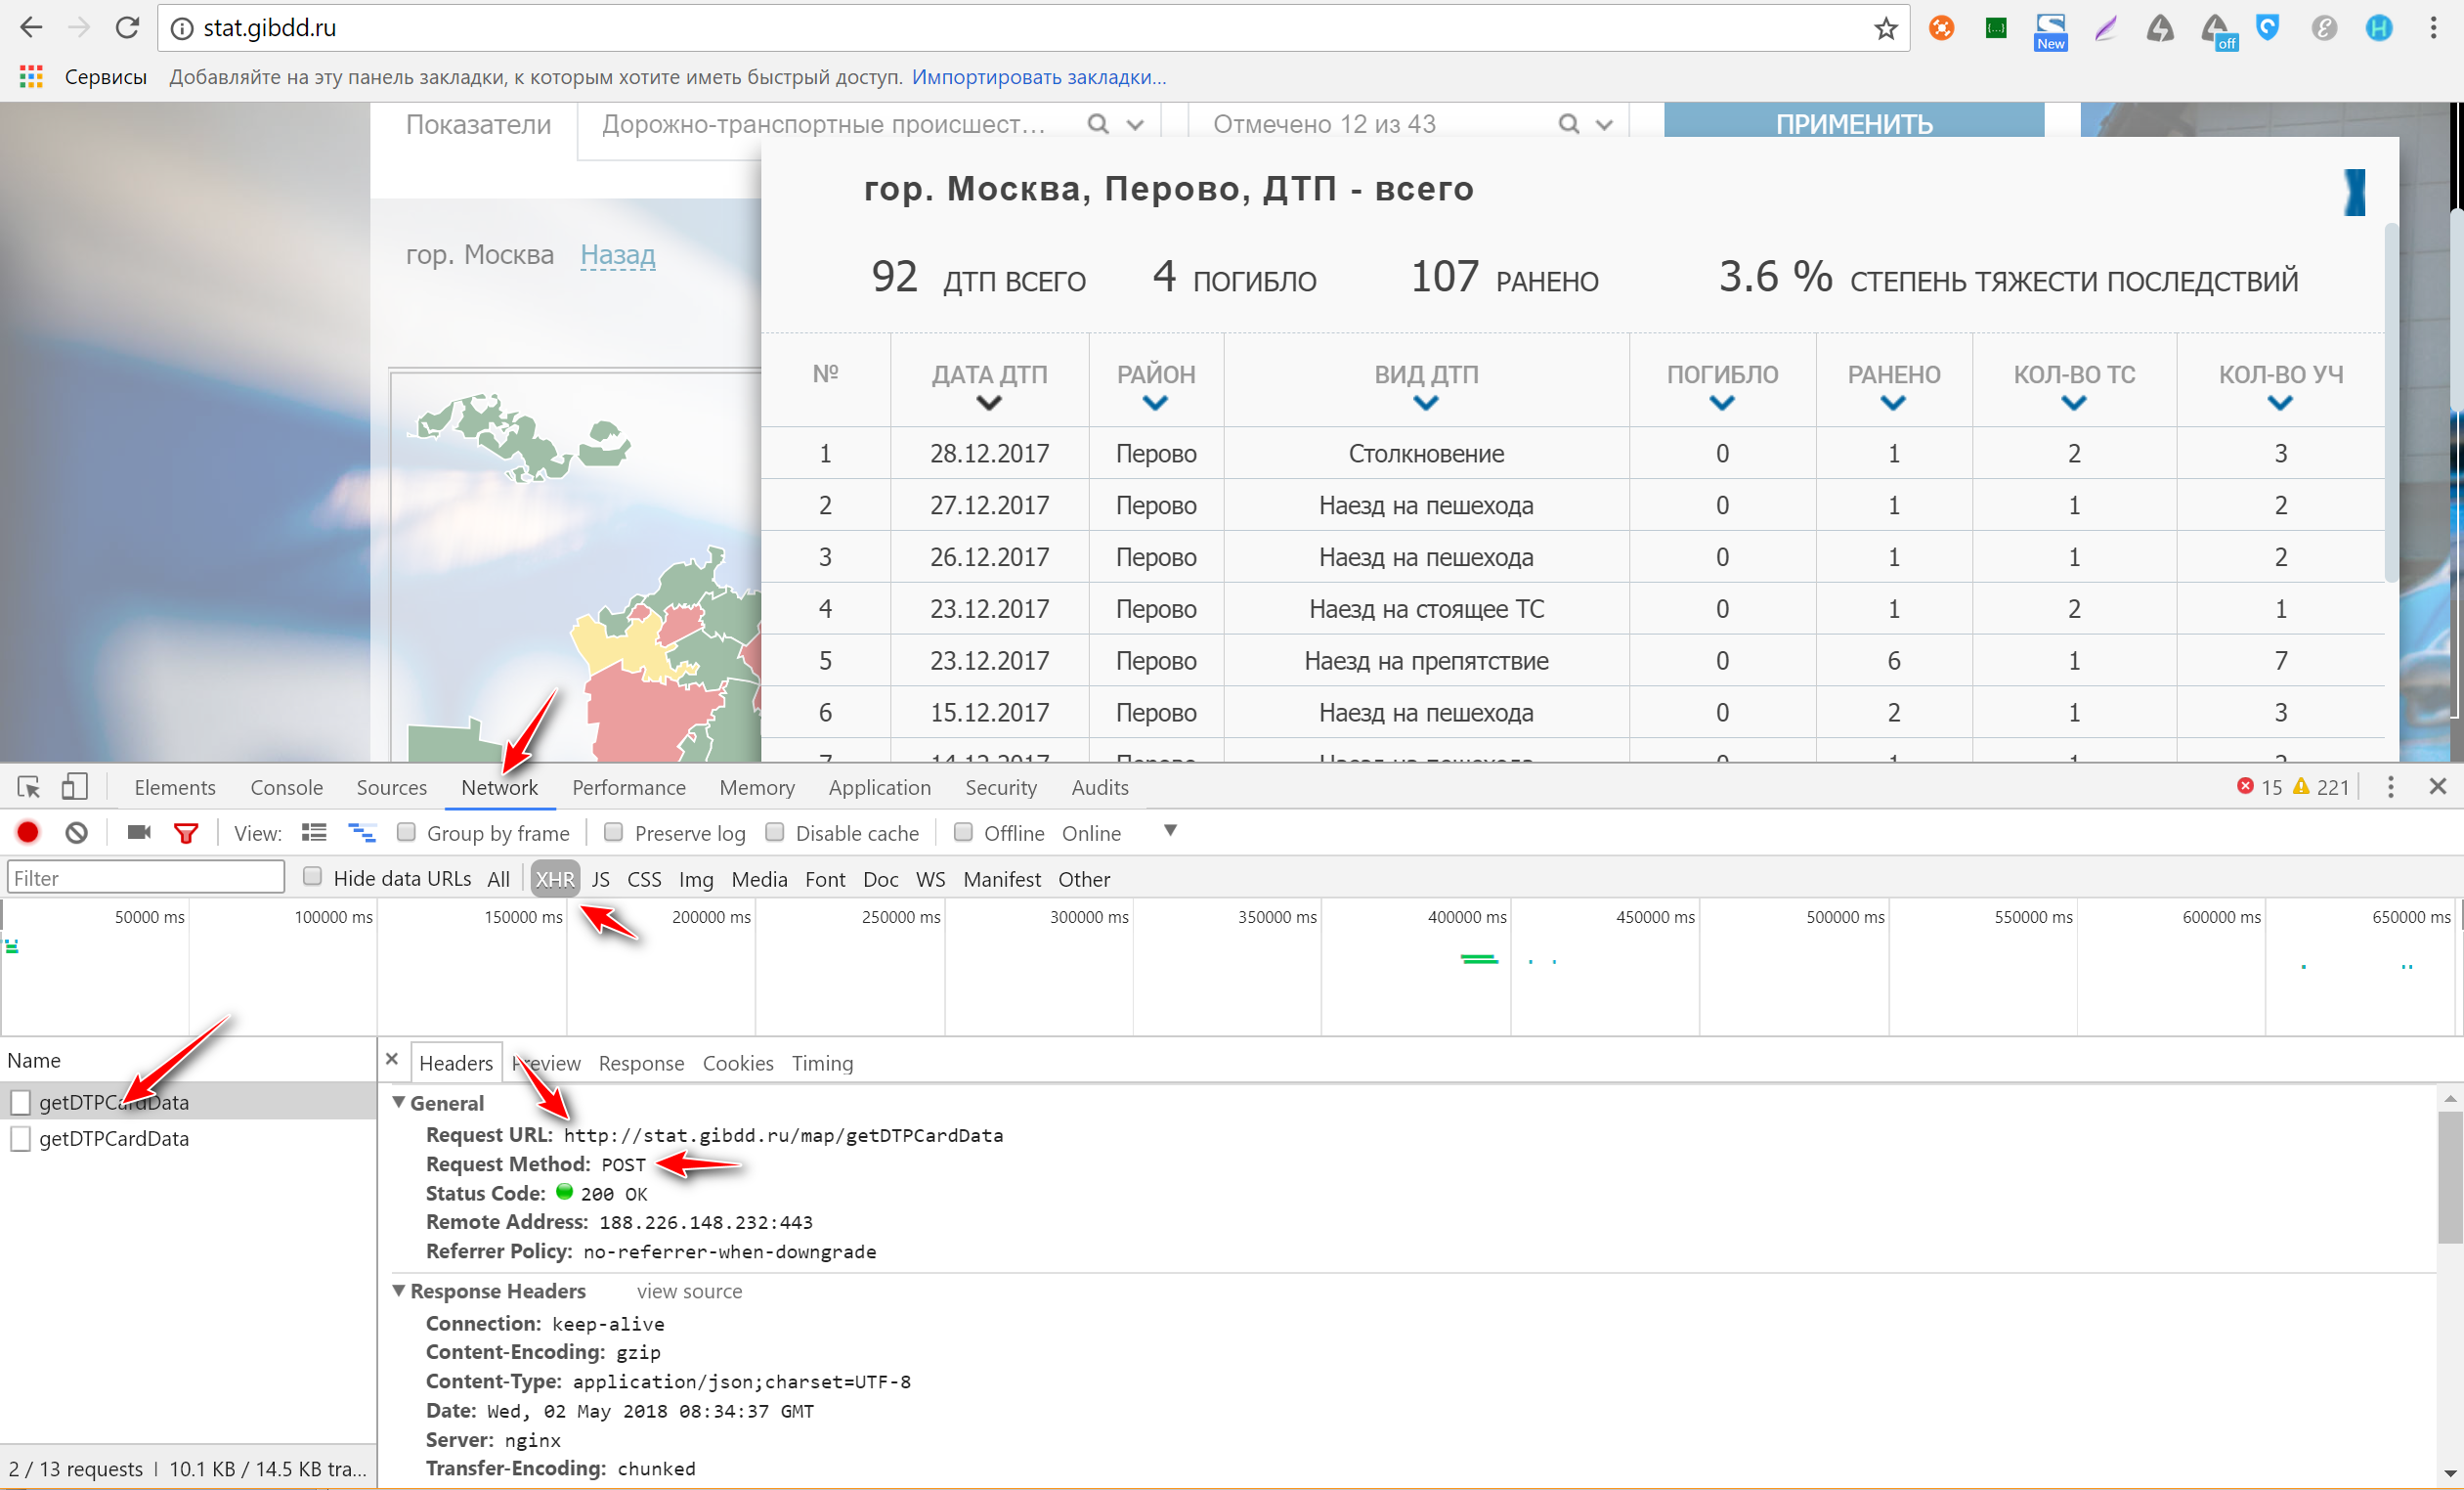
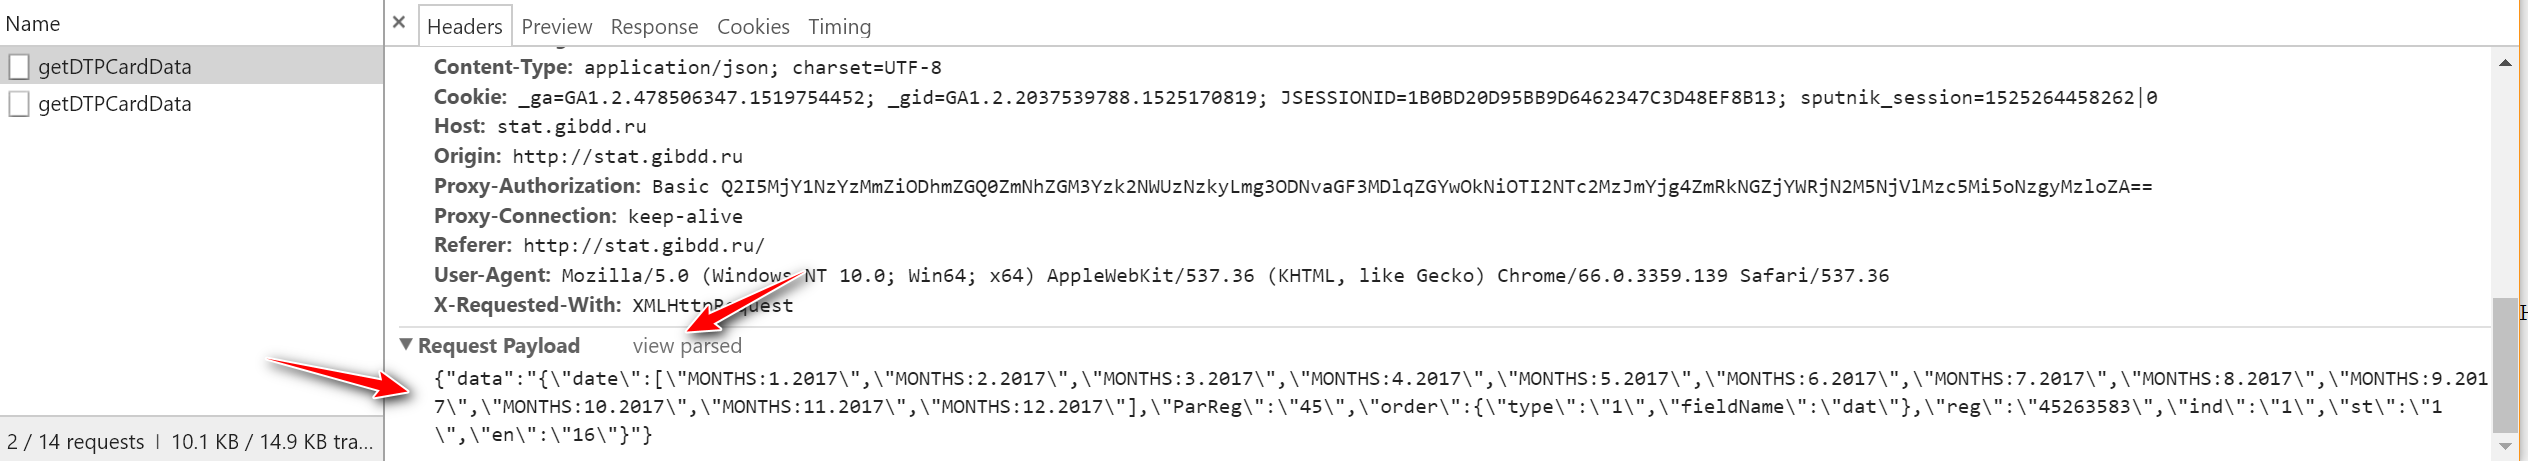
We choose the area we like (I have Perovo). We see that in the DevTools window on the left there are two requests called getDTPCardData . If you click on any of them and select the Headers tab in the window on the right, you will see the request header. Here we are interested in the exact url of the request and the method by which the request is sent (this can be GET and POST). For those interested in the details , but in our case we see the inscription POST and agree. Immediately below it should be the value of Status code: 200 - it means that the request was successful and the data came to us. See all at once in the screenshot:
We now have the link, it remains to find the json-package. To do this, scroll down the Headers window to the end and see the Request Payload section. Click the view source next to Request Payload to get the data packet in its original form. Copy it yourself somewhere. Now everything is ready to get data directly from the site engine via Postman .
Start Postman and immediately turn on the Interceptor (the round icon at the top, which is indicated by the arrow). Interceptor intercepts cookies because without them, the site will refuse to fulfill our requests.
Next, you need to configure the request: select POST as the sending method, insert the command url, add a previously copied data packet ( Body -> raw -> JSON (application / json) ). In general, go for the red arrows.
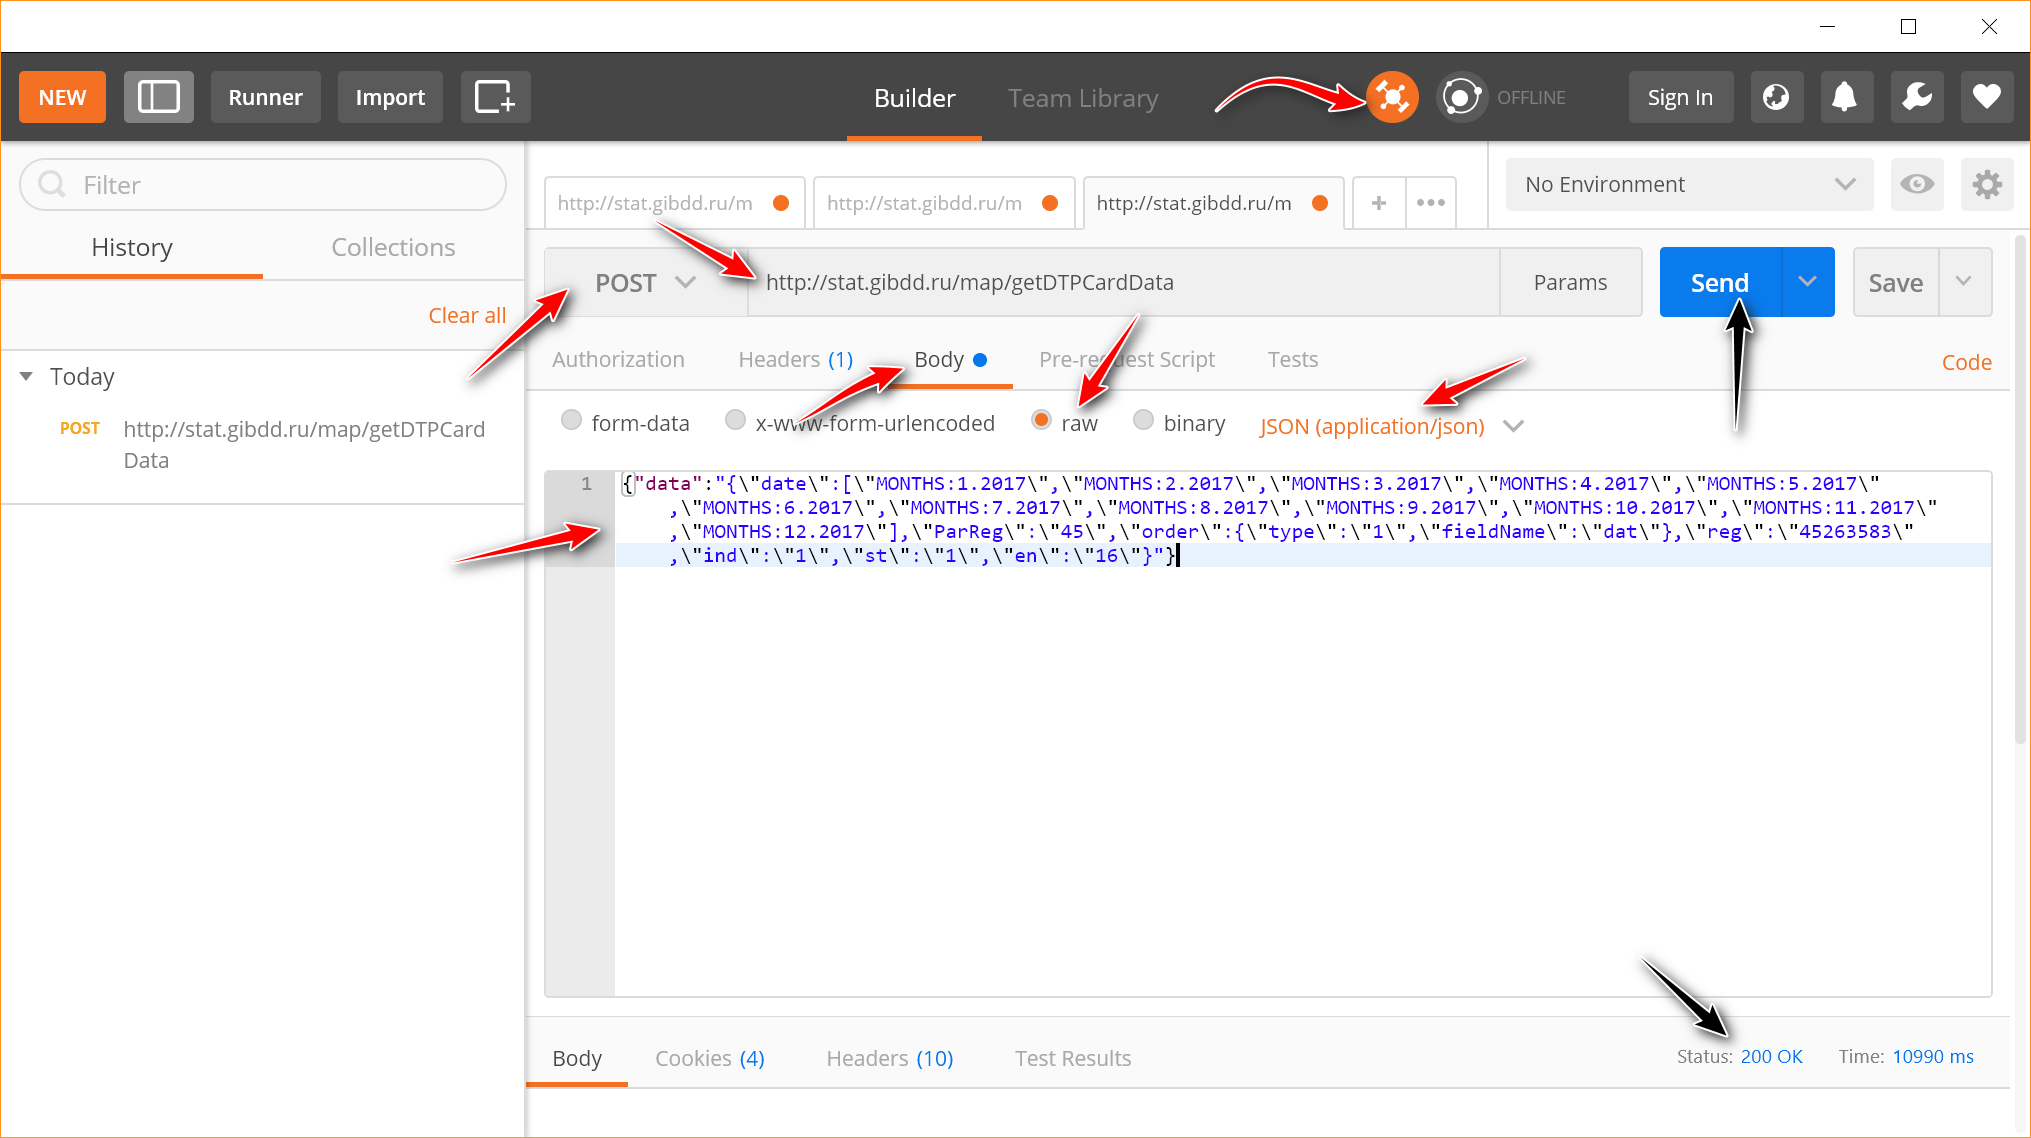
Next, click Send or Send and Download to immediately download the data. At the bottom right in the window, the inscription “Status: 200 OK” will appear and a window will open to download the json file (now all the attention to the two black arrows). In case of an error, the status 500 is most likely displayed, and instead of json, txt with the error text will be downloaded.
I hope everything turned out well, and now let's look at what we have is set in json?
The first is a very long parameter “date” , in which a time period is set, and each month we must register separately. It looks like “MONTHS: 1.2017” , where “MONTHS” is an obligatory key (and necessarily in capital letters), 1 is the number of the month (January), 2017 is obviously a year.
Two more required fields follow: “ParReg” - OKATO-region code (in our case it is 45 - Moscow code) and “reg” - OKATO-code of municipal formation (in our case 45263583 - Perovo district code).
And two more important fields on which the fate of parsing depends: these are a couple of “st” and “en” fields, that is, the numbers of the first and last crash card that we will take from the resource. By default, the site puts 16 cards (this can be checked in the pop-up window on the site), but you can easily specify st = 1, en = 100 and get 100 accidents at once, you just have to wait a little longer. I recommend not to be greedy and not to put a lot (for example, 1000), because The site may interrupt your request by timeout. If you need the following cards, just write like this: st = 101, en = 200 .
It will be good if you are already wondering why there is a "\" everywhere? These are the details of the json package for transmission to the server, but it can be briefly explained as follows: all that comes after “data” with a colon is a string. You cannot just write quotes in the string, so the backslash is placed before it. For Postman and other shells, this is critical, but if you send a request through Python, it will do everything for you.
And one more important detail that will add pain to inattentive researchers. There is a so-called “compact record” in order for the data sent to the server to weigh as little as possible. For us, this means that all spaces that we set “for beauty” are prohibited. stat.gibdd.ru is very sensitive to this, so if the request seems to be correct, and returns HTTP 500 instead of 200, check to see if you have any spaces.
Ready and (hopefully) well-commented parser here .
The most important thing to know about him:
1) Receive data: r = requests.post (url, json = payload) . Here, url and payload are exactly the values that we captured via DevTools and added to Postman .
A piece of pseudocode, thanks to which we receive an accident card:
2) To work with the data that came from the site, you need to turn it back to json: json.loads (r.content) :
3) To save the data to a file, write it like this: json.dump (json_data, f, ensure_ascii = False, separators = (',', ':')) , where json_data is your data, f is the file to which write, ensure_ascii = False - will save, if you, like me, do not like to read this instead of Cyrillic in the file: \ u043D \ u0435 \ 20 \ u043D \ u0440 \ u0430 \ u0432 \ u0438 \ u0442 \ u0441 \ u044F .
json often comes with escaped control characters. To remove the screening, there is an online service .
In order to make it easier to read information about the accident in the raw, useful json parser . In addition, it has a validator - it is convenient when you need to throw out most of the file and at the same time the brackets stop converging.
If someone also wondered how to make explanations on screenshots - I recommend FastStone Capture .
And if you do not want a parser, and you want to immediately and the data, then here. This is all the statistics of the accident from January 1, 2015 to April 3, 2018. By the way, the parser gives a small bonus compared to the traffic police website: the site upload is limited to exactly one month, but the parser takes away all the data that was put there. Therefore, users have data for March, and we have - a little bit for April.
Good data and research. Take care and do not drop state sites.
upd according to the results of the comments: if you also parsed the data or made a project on an accident, please write me in any way (comment, lichka, nike64@gmail.com). My colleagues and I are collecting the experience of such projects. You can chat about these and other open data in the OpenDataRussiaChat telegram chat.
Therefore, I have two lives: in one I help officials open data that people or organizations ask for, and in the other I write parsers that convert public databases of particularly “stubborn” government bodies into open data and teach others that, There will be a lot of projects, the state will accept the inevitable and put everything in a convenient form.
This article will be the first manual in the series “How to get machine readable data from state sites”. So, today - about the statistics of the accident, and since the state does not give it to us, we will learn to take it on our own. By tradition, the code and data are attached.
')
About the accident
According to the report of the World Health Organization, in Russia in 2013, accidents accounted for 18.9 deaths per 100 thousand people, in Sweden - 2.8, and in Belarus - 13.7.
However, in 2017 in Belarus, the mortality rate dropped lower than in the EU countries, but in general for 10 years has decreased threefold. The pictures show another interesting point: while for Russia the situation has hardly changed since 2010, in Belarus and Sweden the red line of death is persistently downward.
The reason for the miracle is in the Swedish program Vision Zero , which says that it is difficult to get people to be more attentive and responsible, but you can make sure that the environment itself ensures the safety of people.
In Belarus, on the basis of this idea, the Minus One Hundred program was launched (minus 100 deaths every year), but at some point the capabilities of speed bumps, speed reduction and traffic control ceased to produce a noticeable effect.
Then I had to turn to the data. The findings of this analysis were unexpected: in Minsk, for example, they struggled with drunk drivers with might and main, and there were 2% of them. Yes, and the people kept the speed, so that was not the case. The real reason turned out to be pedestrians invisible in the dark and the morning distraction of drivers (32 of 41 deaths in Minsk in 2017 were pedestrians, and the most frequent fatal accidents occurred between 00: 00-03: 00 and 06: 00-09: 00).
Of course, in Russia, researchers more than once came to the idea that, having studied the statistics of road accidents, it would be possible to find and explain “bad” places on the roads. Back in 2012, Novosibirsk activists created a map of an accident involving pedestrians, daily from October 2012 to March 2013 collecting reports of local traffic police, and in general the idea was constantly in the air.
Data Sources in Russia
Opportunities to conduct an adequate analysis of accidents in Russia appeared along with the traffic statistics statistics from the traffic police, under which at least in 2016 it was already possible to find data with reference to the exact address and time, and in 2017 there appeared information in total (!) Access one can only dream: the details of the road situation, the time of day, the details of the accident and the damage and so on. In all this there was only one “but”: the data could be downloaded only ... one municipality at a time. The municipality is, for example, one district of Moscow.
So, Method 1 : three mouse clicks to get to the data on some district of Moscow on stat.gibdd.ru , and three more - to download them (thanks, at least in xml, but about json, dear pythonists, in forget this version). Let's calculate: in 85 regions of Russia we have 2423 municipalities, in total:
2423 * 6 = 14538 mouse clicks
Meditate:
So that you are not upset, there is also Method 2 : Responsible Safety Roads . The Ministry of Communications and Mass Media (there is a suspicion that they also download stat.gibdd.ru ).
In the “Open data” section, incomplete statistics first appeared in the “flat” form in csv, in 2017 it became detailed in json, but ... Something constantly happens to this resource: in July 2017 detailed data was posted, but all of August The site did not work due to expired security certificate. Then he earned again, but nobody updated the data. As of the beginning of May 2018, an update appeared, but the detailed data disappeared again - weather conditions, the nature of vehicle damage and much more (in figures it is 90 MB instead of 603 MB for 2017).
But Russian programmers do not give up, and during this time many good projects have been created: road accident statistics for Barnaul and Moscow from Sergey Ustinov jimborobin , detailed research from Alexander Kukushkin alexkuku , visualization from Konstantin Varik.
upd: thanks to HuGo , two more projects were added: “Zero Deaths” in Krasnoyarsk and dtpstat.ru in Kirov.
upd2: I recommend to read a deep study from Alexander Elmekeev. The display on the map is not working now, but the source code remains, incl. to fix geotagging.
And two long-term projects: “Zero Deaths” - our answer to Vision Zero and a very recent project on the analysis and prediction of accidents on the roads of St. Petersburg - you can see here (better through IE), the guys are planning its development in the coming months.
Of course, a new parser was quickly created for each project ...
Parsim alone
The parser , which, I hope, now works completely stably, I actually wrote exactly a year ago (and yes, this article should have been attached to it). Its task is to provide researchers with fresh data, so there is even a command line and manual.
But before proceeding to the code, let's first learn how to independently explore sites. We will need: Chrome browser and Postman application (at the same time install the Postman Interceptor add-on).
After installation, type chrome: // apps in the address bar of the chrome: // apps , a page will open with installed applications, among which will be Postman .
We study the site
There are different site engines. The simplest ones are controlled through the address bar, in which you can set parameters. stat.gibdd.ru is different: it works on the principle of combining a url command and a data packet in json. Nevertheless, the research strategy of all sites is the same: we run Chrome DevTools , we force the site to do what we need, and we closely monitor the changes in the debugger window.
So, let's try to get data for some area of Moscow.
Open stat.gibdd.ru , choose the period, which one you like (I have the whole 2017), press the “Apply” button next to it.
Next on the map, select Moscow and you can run the debugger: right-click somewhere on the map, select "View code" and see the DevTools window. We find in it in the menu the Network tab. It is better to immediately change the filter from All to XHR to remove unnecessary requests that we do not need.
We choose the area we like (I have Perovo). We see that in the DevTools window on the left there are two requests called getDTPCardData . If you click on any of them and select the Headers tab in the window on the right, you will see the request header. Here we are interested in the exact url of the request and the method by which the request is sent (this can be GET and POST). For those interested in the details , but in our case we see the inscription POST and agree. Immediately below it should be the value of Status code: 200 - it means that the request was successful and the data came to us. See all at once in the screenshot:
Download data
We now have the link, it remains to find the json-package. To do this, scroll down the Headers window to the end and see the Request Payload section. Click the view source next to Request Payload to get the data packet in its original form. Copy it yourself somewhere. Now everything is ready to get data directly from the site engine via Postman .
Start Postman and immediately turn on the Interceptor (the round icon at the top, which is indicated by the arrow). Interceptor intercepts cookies because without them, the site will refuse to fulfill our requests.
Next, you need to configure the request: select POST as the sending method, insert the command url, add a previously copied data packet ( Body -> raw -> JSON (application / json) ). In general, go for the red arrows.
Next, click Send or Send and Download to immediately download the data. At the bottom right in the window, the inscription “Status: 200 OK” will appear and a window will open to download the json file (now all the attention to the two black arrows). In case of an error, the status 500 is most likely displayed, and instead of json, txt with the error text will be downloaded.
I hope everything turned out well, and now let's look at what we have is set in json?
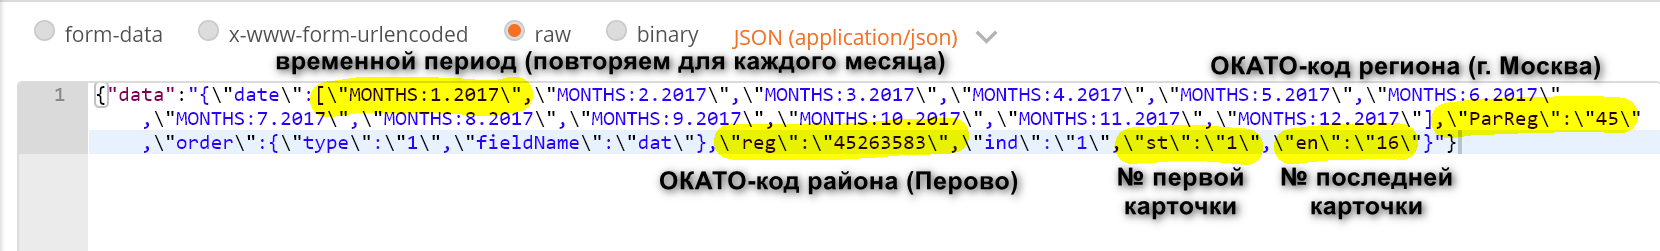
The first is a very long parameter “date” , in which a time period is set, and each month we must register separately. It looks like “MONTHS: 1.2017” , where “MONTHS” is an obligatory key (and necessarily in capital letters), 1 is the number of the month (January), 2017 is obviously a year.
Two more required fields follow: “ParReg” - OKATO-region code (in our case it is 45 - Moscow code) and “reg” - OKATO-code of municipal formation (in our case 45263583 - Perovo district code).
And two more important fields on which the fate of parsing depends: these are a couple of “st” and “en” fields, that is, the numbers of the first and last crash card that we will take from the resource. By default, the site puts 16 cards (this can be checked in the pop-up window on the site), but you can easily specify st = 1, en = 100 and get 100 accidents at once, you just have to wait a little longer. I recommend not to be greedy and not to put a lot (for example, 1000), because The site may interrupt your request by timeout. If you need the following cards, just write like this: st = 101, en = 200 .
It will be good if you are already wondering why there is a "\" everywhere? These are the details of the json package for transmission to the server, but it can be briefly explained as follows: all that comes after “data” with a colon is a string. You cannot just write quotes in the string, so the backslash is placed before it. For Postman and other shells, this is critical, but if you send a request through Python, it will do everything for you.
And one more important detail that will add pain to inattentive researchers. There is a so-called “compact record” in order for the data sent to the server to weigh as little as possible. For us, this means that all spaces that we set “for beauty” are prohibited. stat.gibdd.ru is very sensitive to this, so if the request seems to be correct, and returns HTTP 500 instead of 200, check to see if you have any spaces.
We write a parser
Ready and (hopefully) well-commented parser here .
The most important thing to know about him:
1) Receive data: r = requests.post (url, json = payload) . Here, url and payload are exactly the values that we captured via DevTools and added to Postman .
A piece of pseudocode, thanks to which we receive an accident card:
cards_dict = {"data":{"date":["MONTHS:1.2017"],"ParReg":"71100","order":{"type":"1","fieldName":"dat"},"reg":"71118","ind":"1","st":"1","en":"16"}} cards_dict["data"]["ParReg"] = "45" # cards_dict["data"]["reg"] = "45263583" # cards_dict["data"]["st"] = 1 # cards_dict["data"]["en"] = 100 # cards_dict_json = {} cards_dict_json["data"] = json.dumps(cards_dict["data"], separators=(',', ':')).encode('utf8').decode('unicode-escape') # r = requests.post("http://stat.gibdd.ru/map/getDTPCardData", json=cards_dict_json) # + 2) To work with the data that came from the site, you need to turn it back to json: json.loads (r.content) :
if r.status_code == 200: cards = json.loads(json.loads(r.content)["data"])["tab"] 3) To save the data to a file, write it like this: json.dump (json_data, f, ensure_ascii = False, separators = (',', ':')) , where json_data is your data, f is the file to which write, ensure_ascii = False - will save, if you, like me, do not like to read this instead of Cyrillic in the file: \ u043D \ u0435 \ 20 \ u043D \ u0440 \ u0430 \ u0432 \ u0438 \ u0442 \ u0441 \ u044F .
filename = os.path.join(data_dir, "{} {} {}-{}.{}.json".format(region["id"], region["name"], months[0], months[len(months) - 1], year)) with codecs.open(filename, "w", encoding="utf-8") as f: json.dump(dtp_dict_json, f, ensure_ascii=False, separators=(',', ':')) Some more useful links
json often comes with escaped control characters. To remove the screening, there is an online service .
In order to make it easier to read information about the accident in the raw, useful json parser . In addition, it has a validator - it is convenient when you need to throw out most of the file and at the same time the brackets stop converging.
If someone also wondered how to make explanations on screenshots - I recommend FastStone Capture .
And if you do not want a parser, and you want to immediately and the data, then here. This is all the statistics of the accident from January 1, 2015 to April 3, 2018. By the way, the parser gives a small bonus compared to the traffic police website: the site upload is limited to exactly one month, but the parser takes away all the data that was put there. Therefore, users have data for March, and we have - a little bit for April.
Good data and research. Take care and do not drop state sites.
upd according to the results of the comments: if you also parsed the data or made a project on an accident, please write me in any way (comment, lichka, nike64@gmail.com). My colleagues and I are collecting the experience of such projects. You can chat about these and other open data in the OpenDataRussiaChat telegram chat.
Source: https://habr.com/ru/post/354782/
All Articles