Bioyino - a distributed, scalable metric aggregator
So, you collect metrics. As we are. We also collect metrics. Of course, necessary for business. Today we will tell about the very first link in our monitoring system - a statsd-compatible bioyino aggregation server , why we wrote it and why we refused brubeck.
From our previous articles ( 1 , 2 ) one can find out that until some time we collected tags using brubeck . It is written in C. From the point of view of the code, it is simple as a cork (this is important when you want to contribute) and, most importantly, it copes with our volumes of 2 million metrics per second (MPS) in peak without any particular problems. The documentation claims support for 4 million MPS with an asterisk. This means that you will receive the stated figure if you configure the network correctly on Linux. (How many MPS can be obtained if we leave the network as it is, we do not know). Despite these advantages, we had several serious complaints against brubeck.
Claim 1. Github - the project developer - stopped supporting it: publish patches and fixes, accept ours and (not only ours) PR. In the past few months (somewhere from February-March 2018), activity has resumed, but before that there was almost 2 years of complete calm. In addition, the project is being developed for the internal needs of Gihub , which can be a serious obstacle to the introduction of new features.
Claim 2. Calculation accuracy. Brubeck collects a total of 65536 values for aggregation. In our case, for some metrics in the period of aggregation (30 sec), there can be much more values (1 527 392 in peak). As a result of this sampling, the values of the highs and lows look useless. For example, like this:
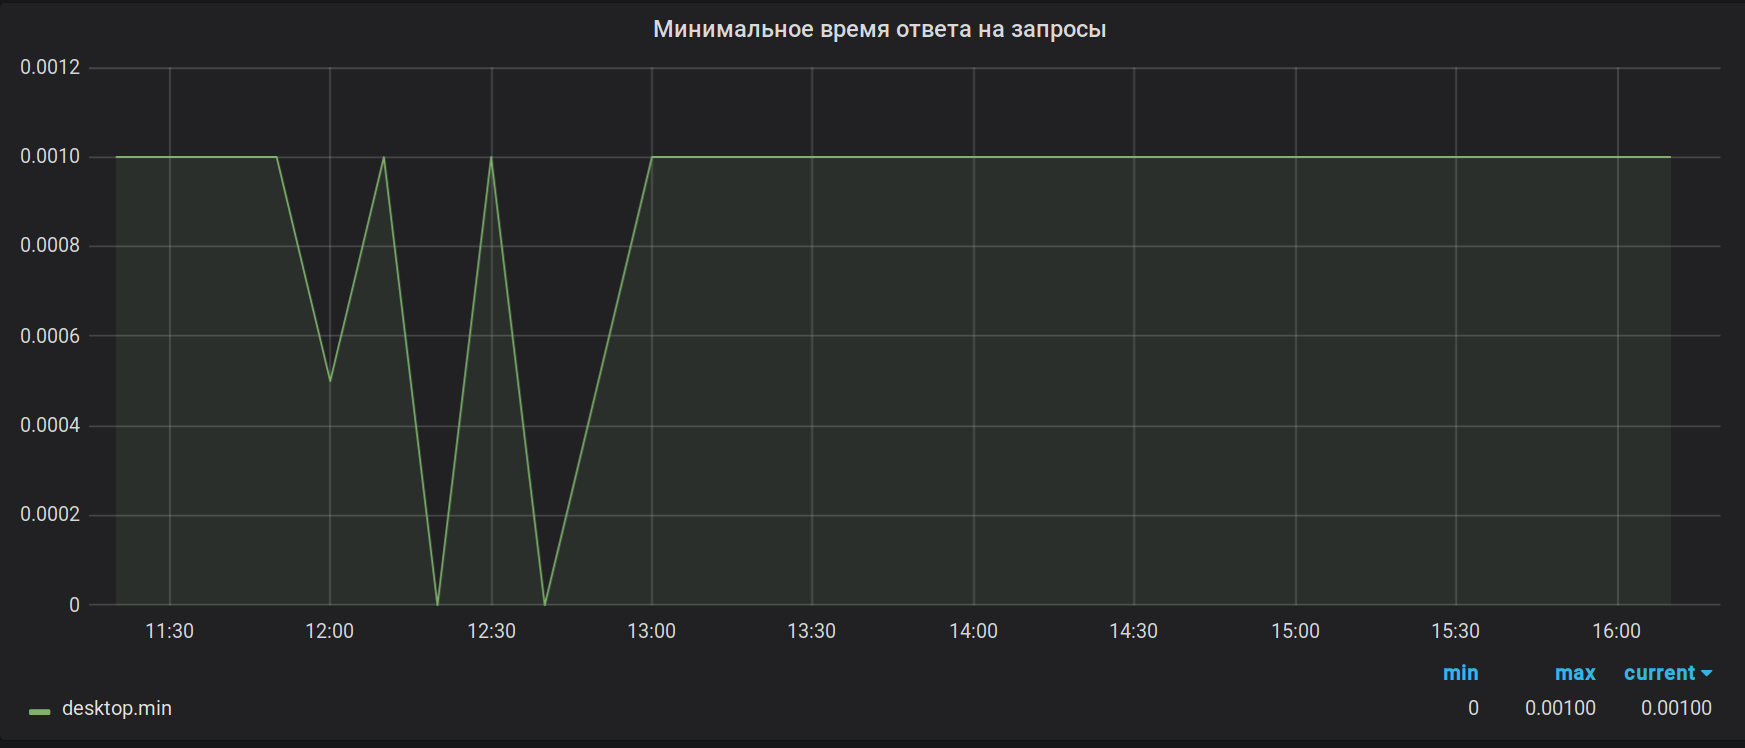
As it was
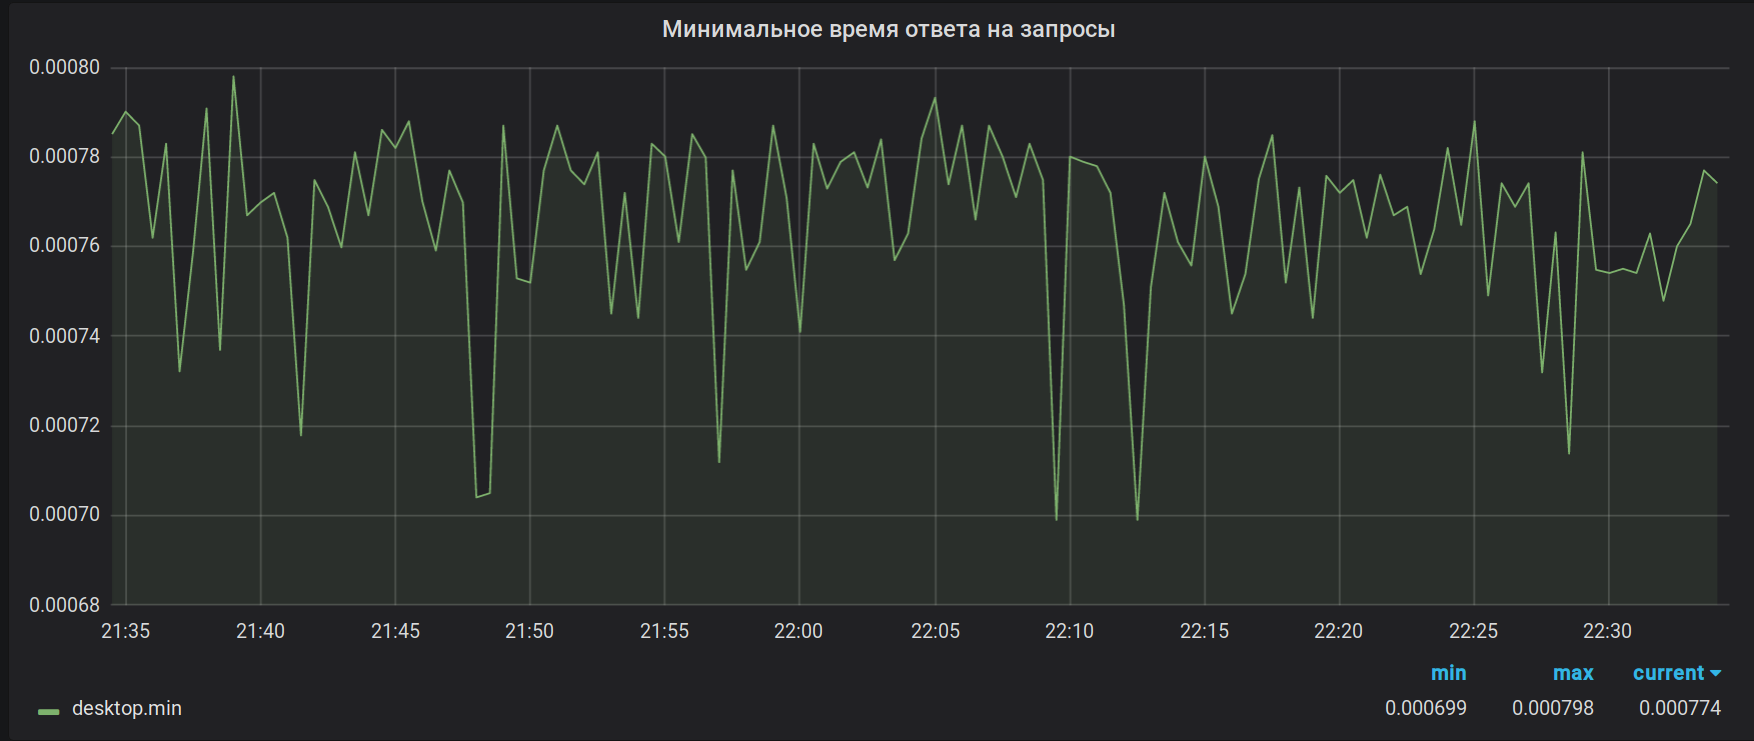
As it should have been
For the same reason, amounts are generally considered incorrect. Add to this a bug with overflowing a 32-bit float, which the server generally sends to segfault when it looks like an innocent metric, and becomes generally excellent. The bug, by the way, has not been fixed.
And finally, Claim X. At the time of this writing, we are ready to present it to all 14 more or less working implementations of statsd, which we managed to find. Let's imagine that some individual infrastructure has grown so much that taking 4 million MPS is not enough. Or even if it has not yet grown, the metrics are already so important for you that even short, 2-3 minute dips on the charts can already become critical and cause bouts of irresistible depression in managers. Since the treatment of depression is a thankless task, technical solutions are needed.
First, fault tolerance, so that the sudden problem on the server does not suit the psychiatric zombie apocalypse in the office. Secondly, scaling to get the ability to take more than 4 million MPS, while not digging deep into the Linux network stack and quietly grow "in breadth" to the desired size.
Since we had the reserve for scaling, we decided to start with fault tolerance. "ABOUT! Fault tolerance! It's easy, we can do it, ”we thought and started 2 servers, lifting a copy of brubeck on each. To do this, we had to copy traffic with metrics to both servers and even write a small utility for this. We solved the resiliency problem with this, but ... not very well. At first everything seemed to be great: each brubeck collects its own aggregation option, writes data to Graphite every 30 seconds, overwriting the old interval (this is done on the Graphite side). If suddenly one server fails, we always have a second one with its own copy of the aggregated data. But here's the problem: if the server fails, a “saw” appears on the charts. This is due to the fact that the 30-second intervals for brubeck are not synchronized, and at the time of the fall one of them is not overwritten. At the time of launching the second server, the same thing happens. It is quite tolerable, but I want better! The problem of scalability also has not gone away. All metrics are still “flying” to a single server, and therefore we are limited to the same 2-4 million MPS, depending on the flow of the network.
If you think a little about the problem and at the same time dig a snow with a shovel, then such an obvious idea might come to mind: you need a statsd who can work in distributed mode. That is, one that implements synchronization between nodes in time and metrics. "Of course, there is probably already such a solution," we said, and went to google ... And found nothing. Having passed through the documentation on different statsd ( https://github.com/etsy/statsd/wiki#server-implementations at the moment of 12/12/2017), we did not find anything. Apparently, neither the developers nor the users of these solutions have yet come across such a number of metrics, otherwise they would have invented something.
And here we remembered the “toy” statsd - bioyino, which was written on the hackathon just for fun (the name of the project generated the script before the hackathon started) and realized that we urgently need our own statsd. What for?
- because there are too few statsd clones in the world,
- because it is possible to provide the desired or close to the desired resiliency and scalability (including synchronizing the aggregated metrics between the servers and solving the problem of sending conflicts),
- because metrics can be considered more accurate than brubeck does,
- because you can collect more detailed statistics yourself, which brubeck almost never provided us,
- because I had a chance to program my own high-format distributed distributor, which would not completely repeat the architecture of another such hyper-type ... noob.
What to write? Of course, on Rust. Why?
- because there was already a prototype solution,
- because the author of the article at that time already knew Rust and was eager to write something on it for production with the ability to put it in open-source,
- because languages with GC are not suitable for us due to the nature of the traffic received (almost realtime) and GC pauses are practically unacceptable,
- because you need maximum performance, comparable to C
- because Rust gives us fearless concurrency, and starting to write it in C / C ++, we would have more vulnerabilities, buffer overflows, race conditions and other scary words than brubeck.
There was also an argument against Rust. The company had no experience in creating projects at Rust, and now we also do not plan to use it in the main project. Therefore, there were serious concerns that it would not work, but we decided to take a chance and tried.
As time went on ...
Finally, after several unsuccessful attempts, the first working version was ready. What happened? It turned out like this.
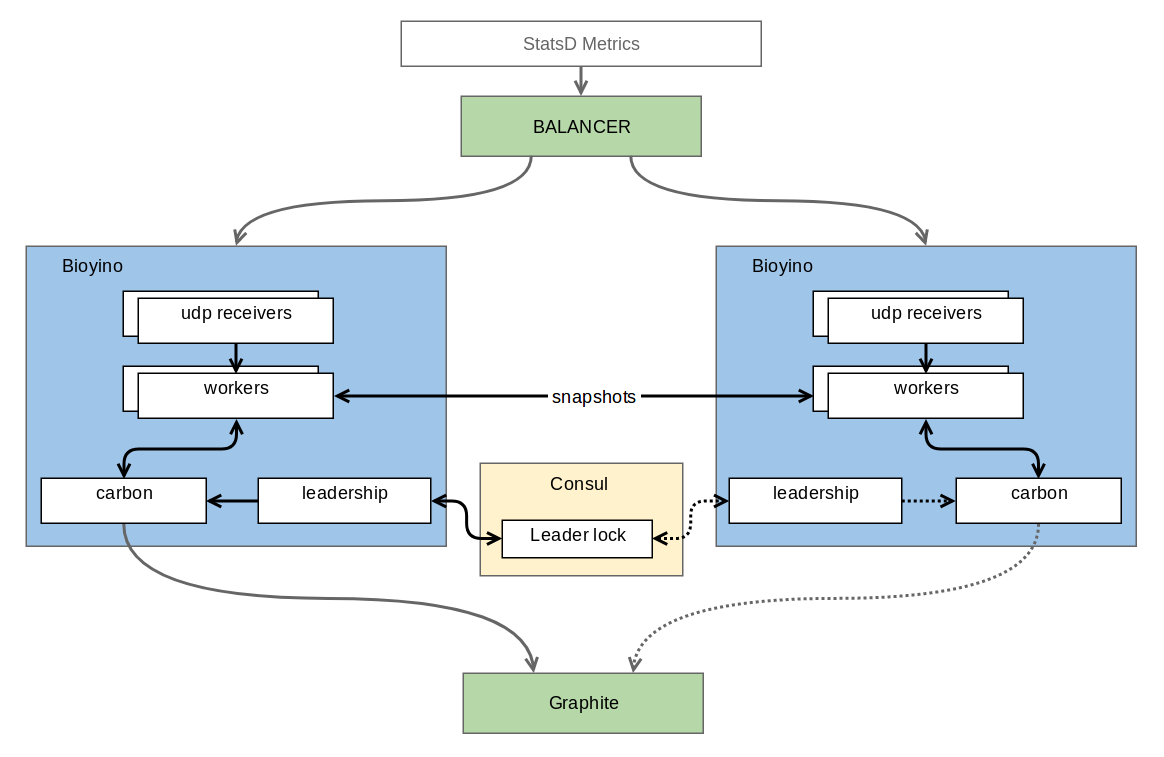
Each node gets its own set of metrics and accumulates them, and does not aggregate the metrics for those types where the full aggregation is required for the final aggregation. Nodes are interconnected by some distributed lock protocol (distributed lock), which allows you to choose the only one among them (we were crying here), which is worthy of sending metrics to the Great. At the moment, this problem is solved by means of Consul , but in the future the author's ambitions extend to his own realization of Raft, where the most worthy will be, of course, the node-leader of consensus. In addition to consensus, the nodes quite often (by default once per second) send to their neighbors those parts of pre-aggregated metrics that they managed to gain in that second. It turns out that scaling and fault tolerance are preserved - each node still holds a full set of metrics, but the metrics are sent already aggregated via TCP and with coding into the binary protocol, therefore the cost of duplication is significantly reduced compared to UDP. Despite the fairly large number of incoming metrics, the accumulation requires very little memory and even less CPU. For our well-compressible mertik, these are just a few tens of megabytes of data. An additional bonus is the absence of unnecessary overwriting of data in Graphite, as was the case with burbeck.
UDP packets with metrics are unbalanced between the nodes on the network equipment through simple Round Robin. Needless to say, the network piece of hardware does not parse the contents of the packets and therefore can pull much more than 4M packets per second, not to mention the metrics about which it does not know anything at all. If we consider that the metrics do not come one by one in each package, then we do not foresee performance problems in this place. In the event of a server crashing, the network device quickly (within 1-2 seconds) detects this fact and removes the fallen server from the rotation. As a result, passive (i.e. non-leader) nodes can be turned on and off almost without noticing drawdowns on the graphs. The maximum that we lose is part of the metrics that came in the last second. The sudden loss / shutdown / switching of the leader still draws a slight anomaly (the 30-second interval is still out of sync), but if there is a connection between the nodes, you can minimize these problems, for example, by sending synchronization packets.
A little about the internal structure. The application is, of course, multi-threaded, but the thread architecture is different from the one used in brubeck. The flows in brubeck are the same - each of them is responsible for both the collection of information and the aggregation. In bioyino, workflows (workers) are divided into two groups: those responsible for the network and those responsible for aggregation. This separation allows the application to be managed more flexibly depending on the type of metrics: where intensive aggregation is required, you can add aggregators, where there is a lot of network traffic, add the number of network flows. At the moment we are working on our servers in 8 network and 4 aggregating streams.
The counting (responsible for the aggregation) part is quite boring. Buffers filled with network streams are distributed between the counting streams, where they are further parsed and aggregated. Upon request, metrics are sent to be sent to other nodes. All this, including data transfer between nodes and work with Consul, is performed asynchronously, it works on the tokio framework.
Much more development problems were caused by the network part responsible for receiving metrics. The main task of separating network flows into separate entities was the desire to reduce the time that the thread spends not on reading data from the socket. The options for using asynchronous UDP and normal recvmsg quickly disappeared: the first one eats too much user-space CPU for event handling, the second one eats too many context switches. Therefore, recvmmsg with large buffers is now being used (and buffers, gentlemen officers, this is not something for you!). Normal UDP support is left for unloaded cases when recvmmsg is not necessary. In the multimessage mode, it is possible to achieve the main thing: the vast majority of the time the network thread clears the OS queue — it reads the data from the socket and puts it into the userspace buffer, only occasionally switching to giving the filled buffer to the aggregators. The queue in the socket practically does not accumulate, the number of dropped packets almost does not grow.
In the default settings, the buffer size is set large enough. If you suddenly decide to try the server yourself, then you may encounter the fact that after sending a small number of metrics, they will not fly to Graphite, remaining in the network stream buffer. To work with a small number of metrics, you need to set smaller values in the bufsize and task-queue-size config.
Finally, some charts for chart lovers.
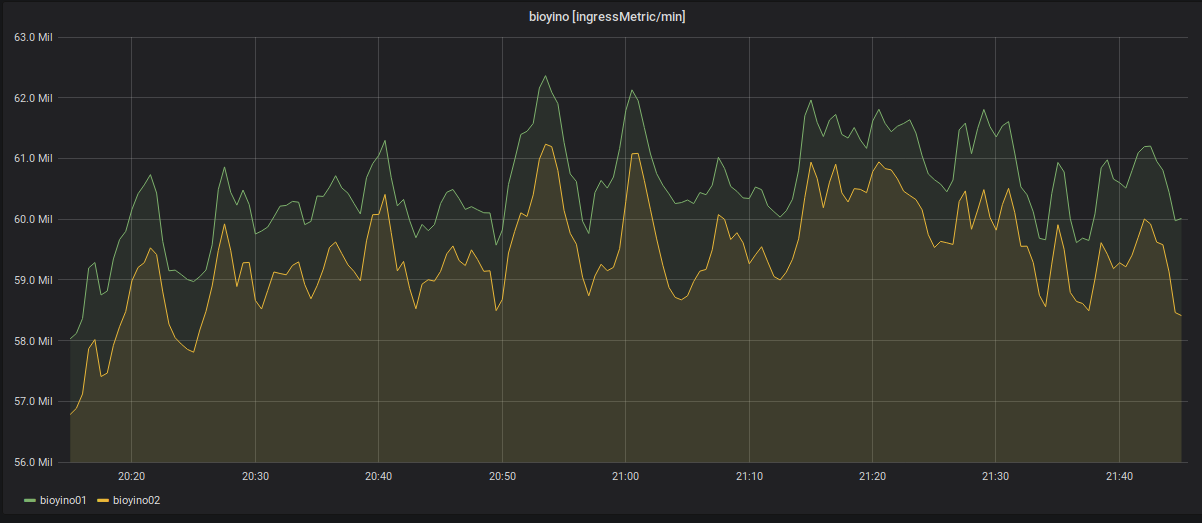
Statistics of the number of incoming metrics for each server: more than 2 million MPS.
Disabling one of the nodes and redistributing incoming metrics.

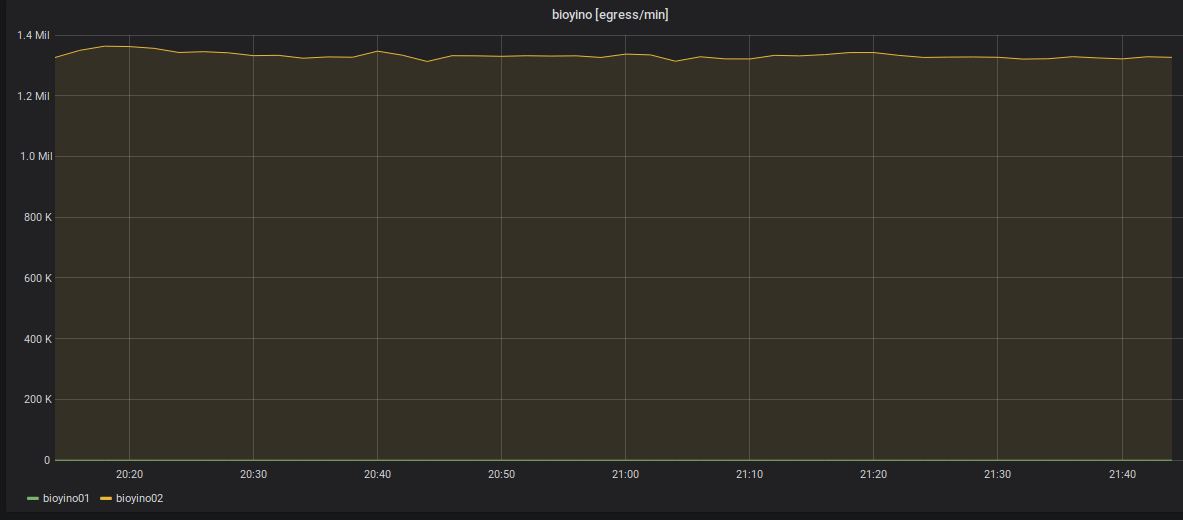
Statistics on outgoing metrics: always sends only one node - raidboss.
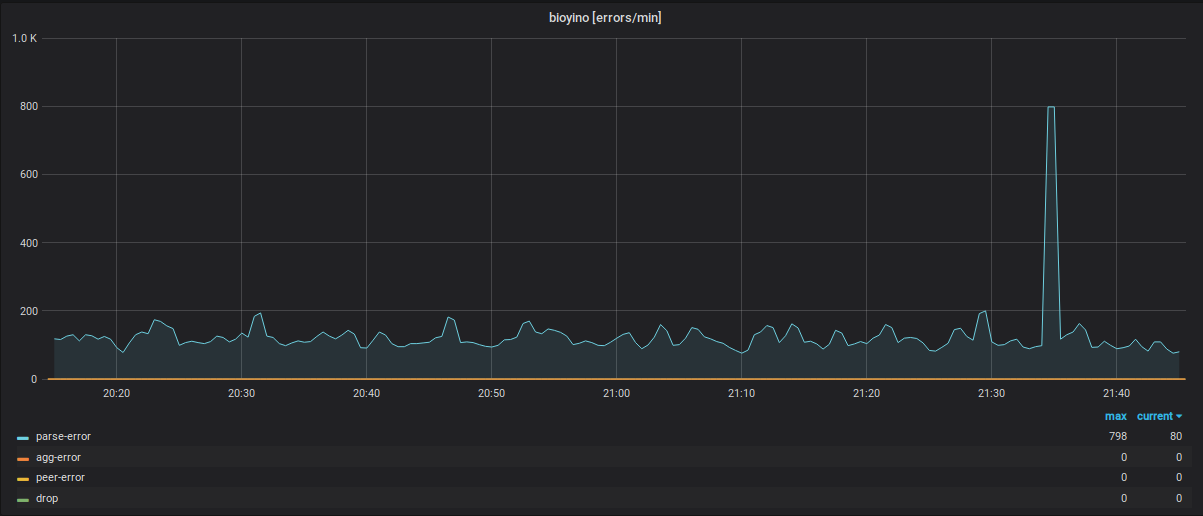
Statistics of operation of each node taking into account errors in various modules of the system.
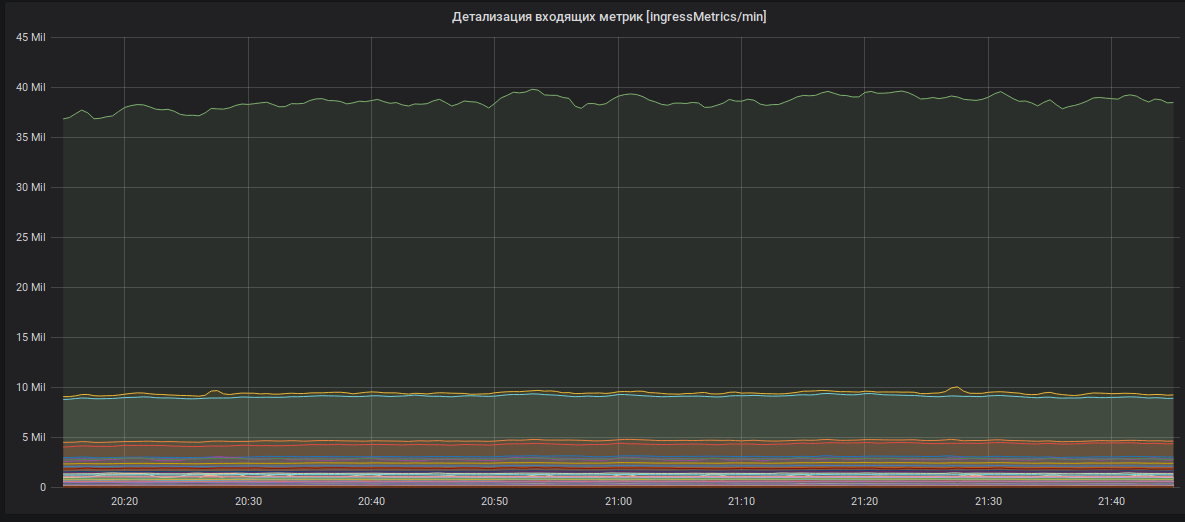
Detailing incoming metrics (metric names are hidden).
What do we plan to do next with this? Of course, write code, bl ...! The project was originally planned as open-source and will remain so all his life. In the near future we are going to switch to our own version of Raft, change the peer protocol to a more portable one, add additional internal statistics, new types of metrics, correct errors and other improvements.
Of course, everyone is welcome to assist in the development of the project: create PR, Issues, where possible we will respond, refine, etc.
On this, as they say, that's all folks, buy our elephants!
')
Source: https://habr.com/ru/post/354714/
All Articles