About memory leak in one server application

After reading this note, you will learn what you had to go through after an unexpected memory leak of the server application in the FreeBSD OS. What modern means of detecting such problems exist in this environment, and why the most powerful of them can be completely useless
One fine afternoon of Thursday, on 5 of 50 servers Zabbix sent notifications about the ending place on the swap-section. The graph of the KPV (free memory) clearly demonstrates the scale of the problem (the mounds on the right are the release of memory due to crowding in the swap). Fortunately, it's Friday ahead, and you can calmly fix everything over the weekend. At that moment no one had imagined that it would take more than 6 days to find and eliminate the cause.
About servers. Typical server generation tenth-eleventh with 8GB of memory (almost completely identical, and even one brand). Servers are divided into groups to serve different sets of user accounts.
')
About the application. Ad-server, HTTP (libh2o) with C \ C ++ logic, a bunch of third-party libraries and bicycles like standard C ++ containers in shared memory, etc. Accepts an incoming request, redirects to several upstream servers, conducts an auction for the answers and returns the answer to the client. Everything revolves on FreeBSD 11.0 \ 11.1.
Who is guilty?
The latest changes in the code base were about ten days ago, all these days nothing remarkable happened to the memory. A quick analysis gave such a list of the most likely reasons:
- the qualitative or quantitative characteristics of incoming / outgoing requests have changed, which led to errors in the allocation / release of memory;
- bicycles with containers in shared memory. They are always suspicious if something goes wrong;
- there is no leakage, just more data has become available and they have now ceased to intervene;
- the result of updating the kernel OS \ libraries. But there are no auto-updates by default, this is not some kind of Windows that, God forgive me, can roll updates whenever it pleases and, in addition, restart the machine. A couple of months ago, so many services collapsed on a nearby project.
- someone conducts a targeted network attack that causes overflow;
- Meltdown \ Specter. Yes! Surely. I do not remember that we were rolling out any updates, fearing a slowdown, but such an item today simply must have a place to be in any abnormal situation;
But the characteristics of the requests / responses have not changed (at least for all metrics collected). No more data, network order, a lot of free resources, the server responds quickly ... Has the external environment changed?
What to do?
A couple of years ago something like this popped up, but almost all the tools that had helped to solve the problem at that time were forgotten. I just wanted to get rid of it in just a couple of hours, so the first naive attempt was to find an answer to StackOverflow ... Mostly people recommend Valgrind and some unknown crafts (apparently the authors themselves) or plug-ins to VisualStudio (irrelevant). Crafts fell almost everything, even without starting to work properly (memleax, ElectricFence, etc.), we will not dwell on them in detail.
Along the way, we recall all the recently released features, thankfully, there have been few changes over the past month, of the main ones - to attach GeoIP databases, and so, in trivia ...
We are trying to disconnect clients and upstream servers in turn (this method was tested one of the first, but for some reason did not give any result, the leak manifested itself in all combinations with varying degrees of intensity, only a linear dependence on incoming requests was observed).
There were also attempts to roll back to the old version, up to a revision two months ago. Memory continued to flow away there. Rollback to even earlier versions was not possible due to incompatibility with other components.
The main question is why these 5 servers? All machines are almost identical (except for the difference in OS version 11 \ 11.1). The problem occurs only on a specific group of accounts. There is not even a hint of such behavior on the others, which means that it must be exactly dependent on incoming requests ...
Lyrical digression
Repeatedly faced with leaks in different projects, it was possible to listen to terrible stories about the most popular and effective method of treatment - periodically reload the defective application. Yes, yes, it turns out, this works for years in highly respected companies. It always seemed to me to be a complete game, and that I would never go down to this in my life, whatever the scale of the problem. However, already on the second day I had to register a shameful restart in the cron, because restarting the application every few hours was quite tedious (especially at night).
For some reason, I wanted to make everything beautiful, namely, to find a leakage place by universal means. It was probably one of the main mistakes made at an early stage.
So, what universal means of solving the described problem exist today? Basically, these are third-party libraries that wrap calls to malloc \ free and follow all memory operations.
valgrind
Excellent tool for detecting problems. Indeed, it catches almost all types (double release, overflow, leakage, etc.). There would be this whole story and ended without starting. But with valgrind there is one problem - almost complete uselessness for high-load applications. It looks like this: the program starts 20-50 times longer than usual, then it also works, with the majority of requests, of course, do not have time to work out and end with timeouts. The CPU cores are loaded 100%, while the application does not produce any useful actions, spending all resources on the valgrind virtual machine. In the logs you will find a measly percentage of the percentage of all requests that pass normally. After pressing Ctrl + C, if you are lucky, a log will appear in a few minutes, or else everything will fall down (I often had the second one, or a nearly empty log). In general, it did not take off.
tcmalloc
The library is available from the google-perftools port. According to the developers :
This is the heap profiler we use at Google.Like most similar tools, it is connected either using the environment variable (LD_PRELOAD) or by compiling the library itself (-ltcmalloc). Neither method worked. In the process, another way came up - calling the static method HeapLeakChecker :: NoGlobalLeaks () from the code. But for some reason it was not exported in any version of the library. Later it turns out :
[on FreeBSD] libtcmalloc.so successfully builds, and the "advanced" tcmalloc functionality all works for the leak-checker, which has a Linux-specific code.: (Let's go further.
libumem
Available from umem port. A smart way to detect memory problems. Especially in combination with MDB . Unfortunately, all this is available only in the Solaris OS, and on FreeBSD MDB it would be nice to port . Launching the application with it failed. At the start, before the call to main, calloc from libthr.so is called, which is already intercepted by libumem. In turn, libumem tries to initialize work with threads in its code. Recursion, s. In general, the stack long before the call to main looks like this:
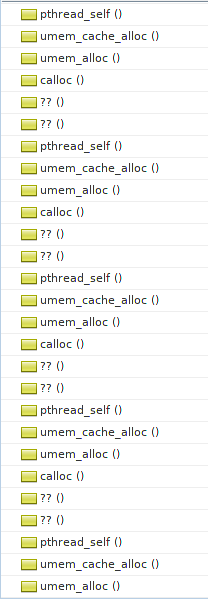
The typical problem of eggs and chicken, which is not clear how to get around. It was decided to postpone the idea of cutting out a lot of threading (fortunately, it is used only somewhere in boost dependencies and in a wrapper over getaddrinfo). Well, let's write to the developers (if there are still alive ) in the open by someone like a similar ticket and go further.
dmalloc
Available from the same port. It has good documentation. The startup stack surprisingly recalls the previous case:
(gdb) bt
#0  0x0000000802c8783e in dmalloc_malloc ()
   from /usr/local/lib/libdmallocthcxx.so.1
#1  0x0000000802c88623 in calloc () from /usr/local/lib/libdmallocthcxx.so.1
#2  0x00000008038a8594 in ?? () from /lib/libthr.so.3
#3  0x00000008038a98d4 in ?? () from /lib/libthr.so.3
#4  0x00000008038a58fa in pthread_mutex_lock () from /lib/libthr.so.3
#5  0x0000000802c87641 in ?? () from /usr/local/lib/libdmallocthcxx.so.1
#6  0x0000000802c87bb3 in ?? () from /usr/local/lib/libdmallocthcxx.so.1
#7  0x0000000802c8787a in dmalloc_malloc ()
   from /usr/local/lib/libdmallocthcxx.so.1
#8  0x0000000802c88623 in calloc () from /usr/local/lib/libdmallocthcxx.so.1
#9  0x00000008038a8594 in ?? () from /lib/libthr.so.3
#10 0x00000008038a98d4 in ?? () from /lib/libthr.so.3
#11 0x00000008038a58fa in pthread_mutex_lock () from /lib/libthr.so.3
#12 0x0000000802c87641 in ?? () from /usr/local/lib/libdmallocthcxx.so.1
#13 0x0000000802c87bb3 in ?? () from /usr/local/lib/libdmallocthcxx.so.1
#14 0x0000000802c8787a in dmalloc_malloc ()
: - malloc-, ( ):
You know its too low if your program immediately core dumps and too high if the dmalloc library says its gone recursive although with low values, you might get either problem.. , core-dump- .
, . 5-6 , . cron :( , , , . , . , .
, , , « » (, , ). 8, . .
dtrace
D. , — dtrace, IDDQD . , .
.. libc, , malloc\free, (probes), , , ! , :
sudo dtrace -n 'pid$target::malloc:entry { @ = quantize(arg0); }' -p 15034— ( — pid=15034). :
value  ------------- Distribution ------------- count
               2 |                                         0
               4 |                                         1407
               8 |                                         455
              16 |@@                                       35592
              32 |@@@@@@@@@@@@@@@@                         239205
              64 |@@@@@@@                                  112358
             128 |@@@@                                     55813
             256 |@@@@@@                                   91368
             512 |@                                        17204
            1024 |@                                        19751
            2048 |@@                                       33310
            4096 |                                         2082
            8192 |                                         554
           16384 |                                         15
           32768 |                                         0
           65536 |                                         3960
          131072 |                                         0
, ? , ! , , - .
, ! , -O1 , «» «».
(Brendan Gregg), dtrace, :
In some cases, this [dtrace] isn’t a better tool – it’s the only tool.— .
, , :
FreeBSD: DTrace can be used as with Solaris. I'll share examples when I get a chance., , . - , Solaris, sbrk mmap\munmap.
D. , , , , .
:
#!/usr/sbin/dtrace -s
/*#pragma D option quiet*/
/*#pragma D option cleanrate=5000hz*/

pid$1::mmap:entry
{
    self->addr = arg0;
    self->size = arg1;
}

pid$1::mmap:return
/self->size/
{
   addresses_mmap[arg1] = 1;
   printf("<__%i,%Y,mmap(0x%lx,%d)->0x%lx\n", i++, walltimestamp, self->addr, self->size, arg1);
   /*ustack(2);*/
   printf("__>\n\n");
   @mem_mmap[arg1] = sum(1);
   self->size=0;
}

pid$1::munmap:entry
/addresses_mmap[arg0]/
{
   @mem_mmap[arg0] = sum(-1);
   printf("<__%i,%Y,munmap(0x%lx,%d)__>\n", i++, walltimestamp, arg0, arg1);
}

pid$1::malloc:entry
{
    self->size = arg0;
}

pid$1::malloc:return
/self->size > 0/
{
   addresses_malloc[arg1] = 1;
   /*
   printf("<__%i,%Y,malloc(%d)->0x%lx\n", i++, walltimestamp, self->size, arg1);
   ustack(2);
   printf("__>\n\n");
   */
   @mem_malloc[arg1] = sum(1);
   self->size=0;
}

pid$1::free:entry
/addresses_malloc[arg0]/
{
   @mem_malloc[arg0] = sum(-1);
   /*printf("<__%i,%Y,free(0x%lx)__>\n", i++, walltimestamp, arg0);*/
}

END
{
   printf("== REPORT ==\n\n");
   printf("== MMAP ==\n\n");
   printa("0x%x => %@u\n",@mem_mmap);
   printf("== MALLOC ==\n\n");
   printa("0x%x => %@u\n",@mem_malloc);
}
: malloc\free, . malloc — , free — . ( > 0). , ~150 malloc- , ustack() ( , .. ) ( valgrind-). , - ( ?), … dtrace :
dtrace: 3507 dynamic variable drops with non-empty dirty list
dtrace: 2133 dynamic variable drops
dtrace: 120 dynamic variable drops with non-empty dirty list
dtrace: 993 dynamic variable drops
dtrace: 176 dynamic variable drops with non-empty dirty list
dtrace: 1617 dynamic variable drops
dtrace: 539 dynamic variable drops with non-empty dirty list
dtrace: 10252 dynamic variable drops
dtrace: 3830 dynamic variable drops with non-empty dirty list
dtrace: 17048 dynamic variable drops
dtrace: 39483 dynamic variable drops
dtrace: 1121 dynamic variable drops with non-empty dirty list
dtrace: 35067 dynamic variable drops
dtrace: 32592 dynamic variable drops
dtrace: 10081 dynamic variable drops with non-empty dirty list
.
, , … \. , free 1.5 , malloc- (, -, ?)
dtrace.

, . , , . , - : ustack(nframes). , ustack(1) . libumem (, , Solaris-).
, : , malloc-, , - . , , ustack() , , 100 . , - , . , , .
— , . . , , , «» , .
demangle
.
, dtrace , , \ . , , . .
.
jemalloc
, FreeBSD , 7- . , … - . , :
setenv MALLOC_CONF utrace:true, (ktrace) (kdump) . realloc-, , ( realloc-) ( «Wayback Machine» ). realloc-, , , , , - , .
By skimming through nearby trace output, we may be able to understand a bit more about the location of the leak in the source too :-)— .
jemalloc- (-: , , ..), . , CURRENT (, man-). , jemalloc , (, ).
. — , !
.
- ( ) , , , ;
- ARC ZFS ( HTTP , , , );
- C++;
- D, - ( dtrace);
- malloc\free, arenas slabs;
- , , ;
- , Solaris ;
- \ GDB.
,
- . , . — - . , , . — \ ;
- — , high-load ;
- dtrace . post-mortem .. , , .
. , . . , -, …
, -, ?
, . , «» ( top N results).
std::list, — -. : list.resize(max_results). , list.resize delete -. resize.
?
top N results . - .
?
. , , . , , , .
?
- . - , . , , , . .
, . « N » ? Linux «tcmalloc co.» « »?
UPD1: , clang, …
, !
Source: https://habr.com/ru/post/354370/
All Articles