Make Windows slower! Part One: File Access
 Windows OS has long been reproached for the slowness of its file operations and the slow creation of processes. Why not try making them even slower? This article will show ways to slow down file operations in Windows by about 10 times their normal speed (or even more), and these methods are practically impossible to track by an ordinary user.
And yet, of course, we will learn to detect and correct such situations. The entire text is based on the problem I encountered a couple of months ago, so everything written below is completely real.
Something went wrong
Sometimes the most valuable information that you have when trying to speed things up is the very knowledge that it can be speeded up for sure. Well, you know, like in school, the problem is solved because it is a problem, which means it must have a solution.
When it comes to code that is completely under your control, it's easier here. You can compare the speed of different versions, rummage, talk to its authors, from a certain stage the intuition led by experience also begins to work.
')
When it comes to the "black box", which, for example, is the implementation of the file system NTFS from Microsoft, it becomes more difficult. But here you can find some tips:
- You notice that some file operations that used to work quickly suddenly began to work slowly. They can probably be made to work quickly again.
- The same file operations sometimes work quickly and sometimes slowly. Perhaps they can be made to work fast always.
- When profiling your application, you see good performance of file operations in most cases, except for a few “hot” places, where everything for some reason works much worse than average. Perhaps you can change your code to avoid this problem.
In my case, I noticed all three of the above tips at once, which gave me the opportunity to find the cause of the problems - it turned out to be in one of the tools I used, which was able to slow down file operations in the entire OS. Together with the author of this tool we managed to figure out what was in the works and release the fix.
Slow file deletion
Again and again collecting from the Chromium source , I noticed that cleaning the directory with the build results took a few minutes to complete - this is quite a significant part of the build cycle. I was sure that this should happen faster. I also noticed that this problem does not happen if Visual Studio is not running at the time of deleting these files.
Spoiler
Visual Studio was not to blame!
Profiling with ETW did not reveal the obvious culprit, but gave a few tips that led me to believe that VsChromium could be an extension for Visual Studio, which makes working on the Chromium project in Visual Studio more convenient. One of its important features is to load the entire source code of the project into RAM (for further quick search). In the case of Chromium, this is several gigabytes of RAM, but the search works in milliseconds. This extension helps me a lot in my work, but a tenfold slowdown in file operations is not the price I’m willing to pay for it.
Reproduction problems
To write this article, I emulated a problem by writing a Python script that creates and deletes thousands of files in a folder that is monitored by VsChromium. By running this script, I collected the event trace with ETW. Here is a graph of processor usage in WPA ( Windows Performance Analyzer ) and a table with time (in milliseconds). In total, the script worked for about 5 seconds:
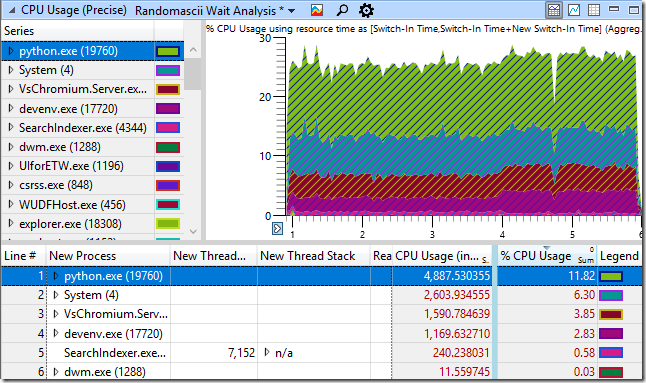
It seems reasonable that the python.exe process that runs my script uses a significant portion of the CPU resources. It is also clear that the System process will also be busy with some work, since we are engaged in adding and deleting files. In addition, we see in the table the work of the VsChromium extension, since it observes the folder in which we create and delete files, and therefore must respond to this (add and remove files from the index). Finally, SearchIndexer.exe uses few resources to index new files. It seems that everything looks good. And yet - we know that the code is too slow.
Here, for contrast, a graph of processor usage in the case of creating and deleting files in a directory that is not under the supervision of VsChromium. Performance has risen almost 10 times! It is clear that the download from VsChromium.Server.exe and devenv.exe has completely disappeared, but that’s not the end of it. Python itself, running my script, also began to work much faster (script execution time dropped from 4888 ms to 561 ms). The System process has generally accelerated from 2604 ms to 42 ms. What is going on here?

The CPU Usage (Precise) graph, which is based on context switching information, provides a good opportunity to tell how many processor resources a particular process uses. But in order to understand what the process is wasting time on, you need to use the CPU Usage (Sampled) schedule . It is based on “snapshots” of the function call stack (by default, made at a frequency of 1000 times per second).
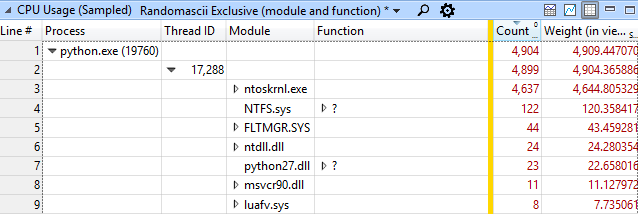
This type of data view groups data by process, then by stream, then by module, and finally by function. In this case, for the python.exe process, we see that in 4637 snapshots from 4904, some work took place in the ntoskrnl.exe module. This is much more than the execution time of the code in python27.dll (which can be neglected at all).
Delving into the study of what ntoskrnl.exe was doing, we see exactly what functions were called in it:
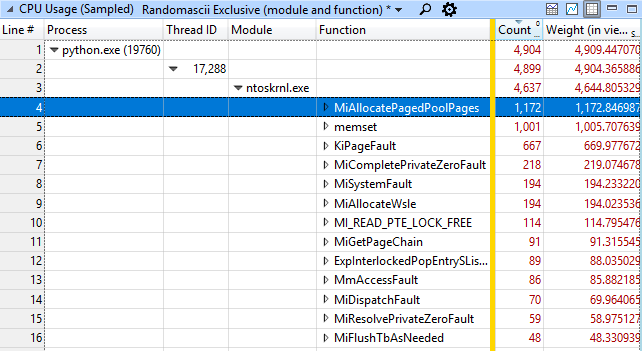
Most often, the memory allocation function MiAllocatePagedPoolPages and memset memory functions, MiCompletePrivateZeroFault, and page faults associated with them were called. It seems a little strange that in the test of the file system the most resources are occupied by the task of allocating and cleaning memory, right? But wait, that's not all. The second in terms of employment in the system is the System process, and it is busy (what would you think?) Resetting the newly freed memory pages. What, after all, is happening?
Returning to the snapshot snapshot analysis of the python.exe process, I searched for the memset function and found it somewhere 70 levels lower than the olligus (not surprisingly, I missed it earlier). Right click on it, select View Callers-> By Function and see that the total cost of calling it (including the execution time of the "child functions") is about half of the total processor load - 2971 snapshots of 4904 taken.
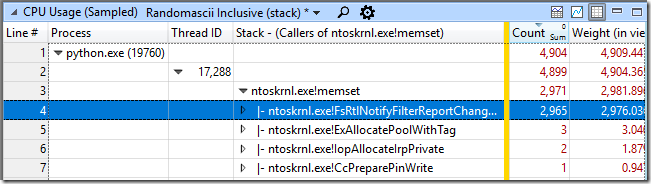
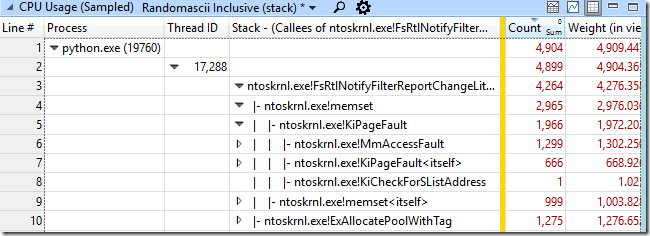
FsRtlNotifyFilterReportChangeLiteEx has almost always been the caller. Right click on it, View Callees-> By Function. This showed me that this function allocated memory, called memset for it, and consumed about 83% of the CPU time in the python.exe process.
In search of a problem
At this point in my research, I had several, as it turned out later, incorrect guesses. One of them concerned the frequent calls to wcifs.sys! WcGenerateFileName - I thought that the generation of file names in the “8.3” format was too slow, but disabling it did not change anything. In the end, I stopped my attempts to comprehend incomprehensible tricks and instead thought about how the VsChromium extension works. When downloading, it simply has to read and load into memory all the contents of the files in the monitored folder. But after that, he only needs to track changes and I assumed that it has something like a file system change monitor. I knew that the extension had recently received an update and in it the author increased the buffer in which notifications about file changes were stored, from 16 KB to 2 MiB. And for some reason, the operating system did not like it very much. I tried to roll back to the previous version of the extension (with a smaller buffer) - and this really fixed the problem.
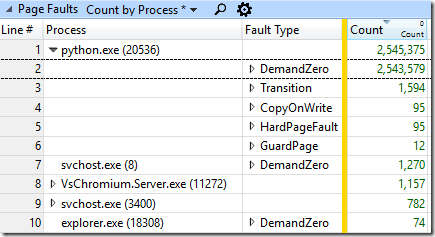
This buffer was allocated using the ExAllocatePoolWithTag function, and then filled with information about changes in the file system. To avoid data leakage from the OS kernel, the entire unused part of the buffer was reset. If the buffer is large enough and the amount of information sent is relatively small, resetting will take most of the time. I added the data provider ALL_FAULTS (which I found by looking at the result of the “xperf -providers k” call) to my ETW session to see how often the pages failed. And it was impressive! There were 2,544,578 page failures when attempting to reset the data, which corresponds to 9.7 GiB data or about 4970 times in 2 MiB buffer. This is 4.97 buffers for every thousand files created and deleted. I was told that VsChromium should create about 5 events for each created and deleted file, which means most of the buffers with notifications will contain only one record. Here are page failures by process and type:
Why such a big buffer?
The documentation for FileSystemWatcher recommends that you do not use a large buffer , but it doesn’t go into details about how this threatens. Chrome developers' machines have a lot of RAM, so when once very frequent file operations (a bug in the Windows kernel, which I wrote about earlier ) caused the previously used 16 KV buffer to overflow, it was simply significantly increased. And this, at first glance, helped. At least then, to solve that problem. Although slowed down file operations many times.
When the author of the VsChromium extension learned about the problem, he decided to reduce the buffer back and handle the errors of its overflow more gracefully (temporarily suspending monitoring).
The irony of this situation is that most of the resources expended here (memset calls, page failures, zeroing) occur because two different parts of the OS kernel do not communicate well enough with each other. The notification system asks for memory, gets it (already zeroed out), and again tries to reset it. If she knew that the memory had already been reset, she would not have tried to do it a second time, and there would have been no extra page failures, and life would have been much better. Hey, Microsoft, I have a cool idea on how to make the notification system about file system changes better!
Armed with this knowledge
It is enough just to write C # code that will monitor file system changes for the root of all the disks we have, using the buffer for notifications, first small and then significantly larger. I’m wondering what will be the impact on system performance with a 10 MiB buffer, and I’m still wondering what its size should be in order to use this seemingly innocent user mode feature to slow down Windows to the greatest possible extent?
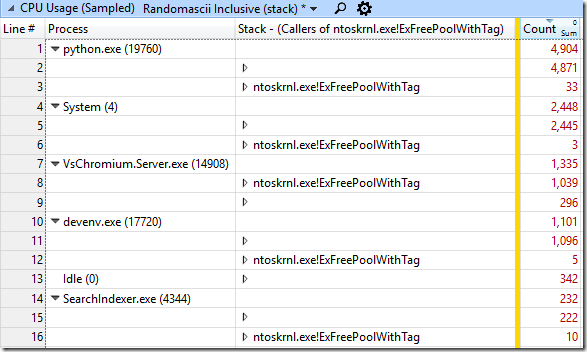
ETW traces allow you to simply understand that the buffers for notifications are a problem - every process that performs some file operations will show an extremely long time spent in ntoskrnl.exe! FsRtlNotifyFilterReportChangeLiteEx. This shows that someone uses a very large buffer for notifications, but how do we find the culprit process? It is very simple - since in our case the memory was allocated using ntoskrnl.exe! ExAllocatePoolWithTag, it will be released using ntoskrnl.exe! ExFreePoolWithTag. We can search for calls to this function in our existing callstacks and find one where there are a lot of them.
Other useful links
C # source code for FileSystemWatcher can be downloaded here . It is implemented using ReadDirectoryChangesW. How it all works is well described here .
An increase in the size of the buffer in VsChromium happened here in this commit , which went into build 0.9.26 . The reverse decrease happened here in this committee , which was included in version 0.9.27 .
I recommend that all VsChromium users upgrade to the latest version.
ETW-traces and the Python script mentioned in the article can be downloaded here . It creates and deletes files twice, once in a directory under the supervision of VsChromium, and a second time in an unobserved directory, with a half-second pause. To play the experiment from the article, you, of course, need the appropriate version of VsChromium, configured to monitor the desired folder.
And in the next article I will talk about how Microsoft allows you to sometimes randomly create N processes in O (N ^ 2) time.
Source: https://habr.com/ru/post/354324/
All Articles