Redefining GPS: Developing a new generation positioning system in Uber
Positioning and navigation using the global positioning system (GPS) has deeply penetrated our daily lives, and they are particularly critical for Uber services. In order to organize fast and efficient rebounds, our GPS technology needs to know the position of the passengers and drivers being mapped, as well as provide navigation guidance from the current position of the driver to the place from which to pick up the passenger, and then to the desired destination. For the smoothest operation of such a system, positioning for passengers and drivers should be as accurate as possible.
After launching (literally) GPS in 1973 , we began to understand our world better, experienced an exponential increase in the computing power available to us, and developed powerful algorithms for modeling uncertainties from areas like robotics. Despite the fact that our lives have become increasingly dependent on GPS, the fundamentals, that is, how GPS works, have not changed much, which leads to significant performance limitations. In our opinion, it is time to rethink some of the initial assumptions that were true in 1973 regarding where and how we use GPS, respectively, and computing power and additional information that we can use to improve results.
GPS works well under a clear sky, but its approaching position may be wildly inaccurate (with an error of 50 meters or more) where we need accuracy most of all: in densely populated and high-rise urban areas, where many of our users are located. To overcome this problem, we developed an upgrade for GPS software on Android, which significantly improved the accuracy of the designated position in the urban environment through a client-server architecture that uses 3D maps and performs complex probabilistic calculations on GPS data available through the Android GNSS API .
')
In this article, we will discuss why GPS can cope poorly in an urban environment and summarize how we fixed it using advanced signal processing algorithms that were deployed to scale on our server infrastructure.

Image 1: The GIF above shows a comparison of standard GPS (red) versus our improved position approximation (blue) for picking from Uber HQ in San Francisco. Our approximate location was very close to the passenger’s real journey, and GPS showed significant deviations.
A bit of GPS / GNSS background
Before discussing our approach in detail, let's briefly summarize how GPS works in order to understand why it may be inaccurate in a high-rise urban environment.
GPS is a network of more than 30 satellites operated by the US government orbiting the earth at an altitude of about 20 thousand kilometers. (Most smartphones today can also receive the signal of similar Russian GLONASS satellites.) These satellites send radio frequency signals that GPS receivers, like those located in smartphones, can record. It is important that these satellites announce the time when they launch these signals.
For each satellite whose signal processes the receiver, the difference between the acquisition time and the launch time (flight time) is multiplied by the speed of light, the resulting value is called the pseudo distance . If the clock of the satellite and the receiver are synchronized, and the signal moves along the line of sight, then this value will be equal to the real distance to the satellite. However, the clock is not synchronized, so the receiver needs to solve an equation of four unknowns, its own 3D coordinates on the sphere, and the deviation of the clock. Thus, we need at least four satellites (four equations) to obtain these four unknowns.
If we ignore the deviation of the clock, we can intuitively interpret the approximation of the location produced by the GPS receiver, the intersection of the spheres centered on the satellites and the radius of each sphere given by the pseudo distance. In practice, a GPS receiver processes signals from a significantly larger number of satellites (up to 20 GPS and GLONASS satellites visible in the open field), and obtaining more than the minimum number of equations provides additional resistance to noise, obstacles, etc. In addition to GPS and GLONASS, some new / future receivers can / can process signals from other satellite systems. Some other launched satellite navigation systems are Galileo , operated by the European Union, IRNSS in India, and BeiDou , operated by China. The more general term GNSS (Global Navigation Satellite System) covers these systems. (We will use this term further.)
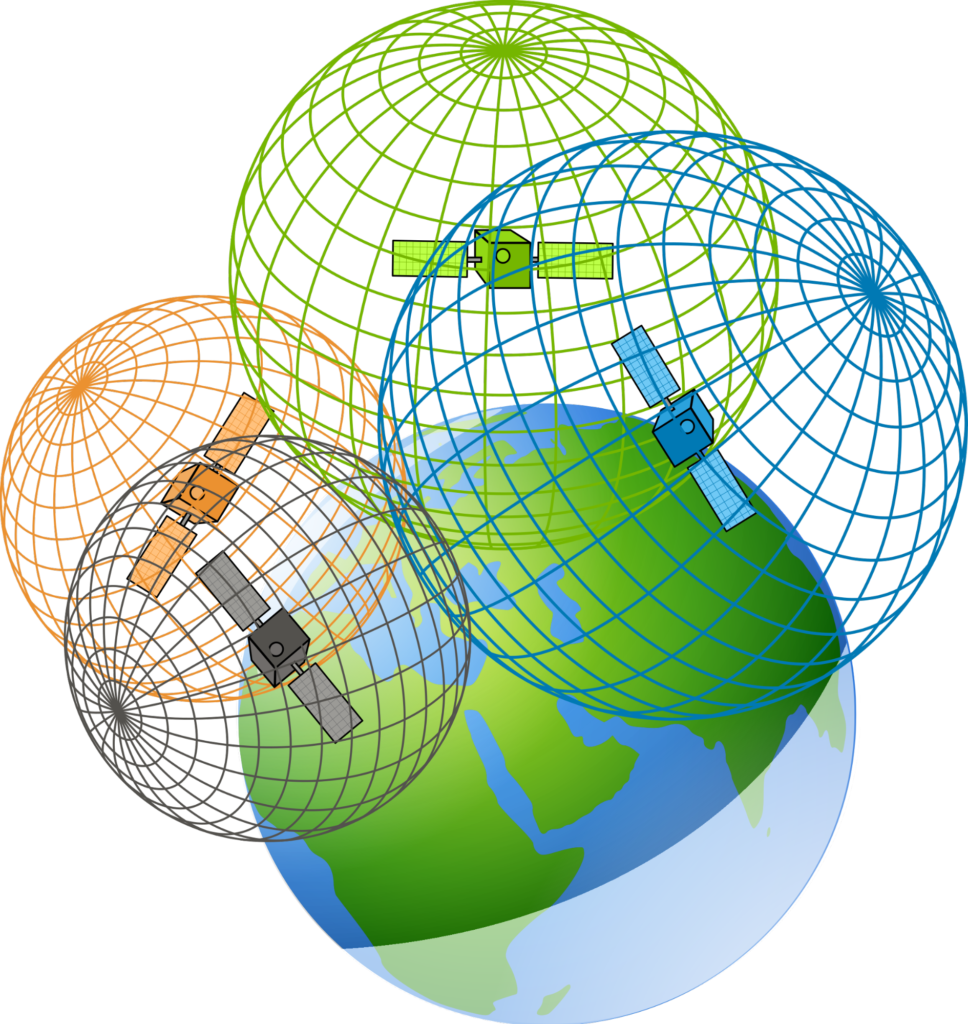
Image 2: In this simplified interpretation of GPS receiver calculations, the spheres intersect at the center of known satellite locations.
Why GNSS location is inaccurate in an urban environment
A very strong statement is behind the GNSS-based positioning, that the receiver has a line of sight to every satellite whose pseudo-range it calculates. This mechanism works well in an open area, but it does not work well in an urban environment, as shown in Figure 3 below:
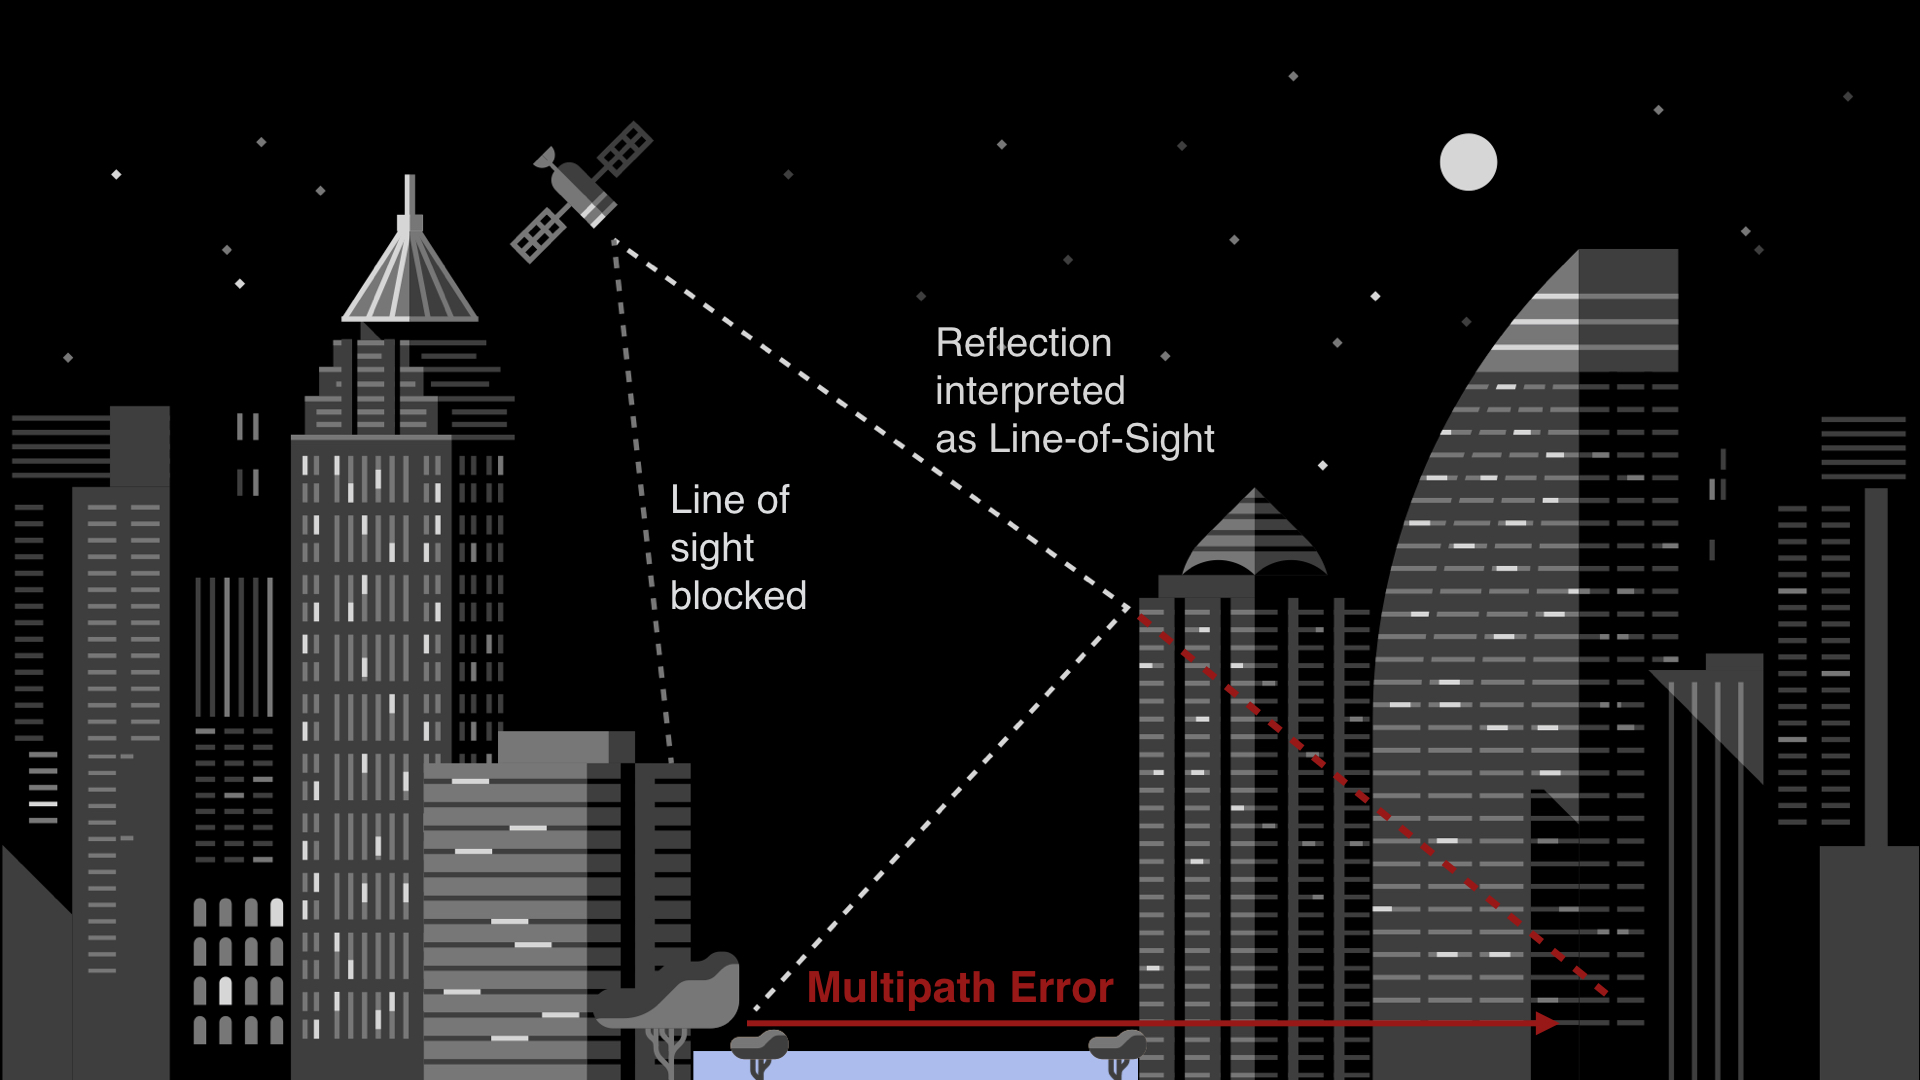
Image 3: The restriction of direct visibility and strong reflection can cause large GPS errors.
Buildings very often limit the direct view of satellites, so that the receiver processes the signals corresponding to the reflection from other buildings. Significant inaccuracy (positive displacement) in the pseudodistance resulting from this phenomenon can lead to errors in the approximation of the situation, which can reach 50 meters or more in urban canyons. Most of us who walked, or by car, or ordered Uber in big cities experienced these problems for themselves.
The strength of satellite signals to the rescue
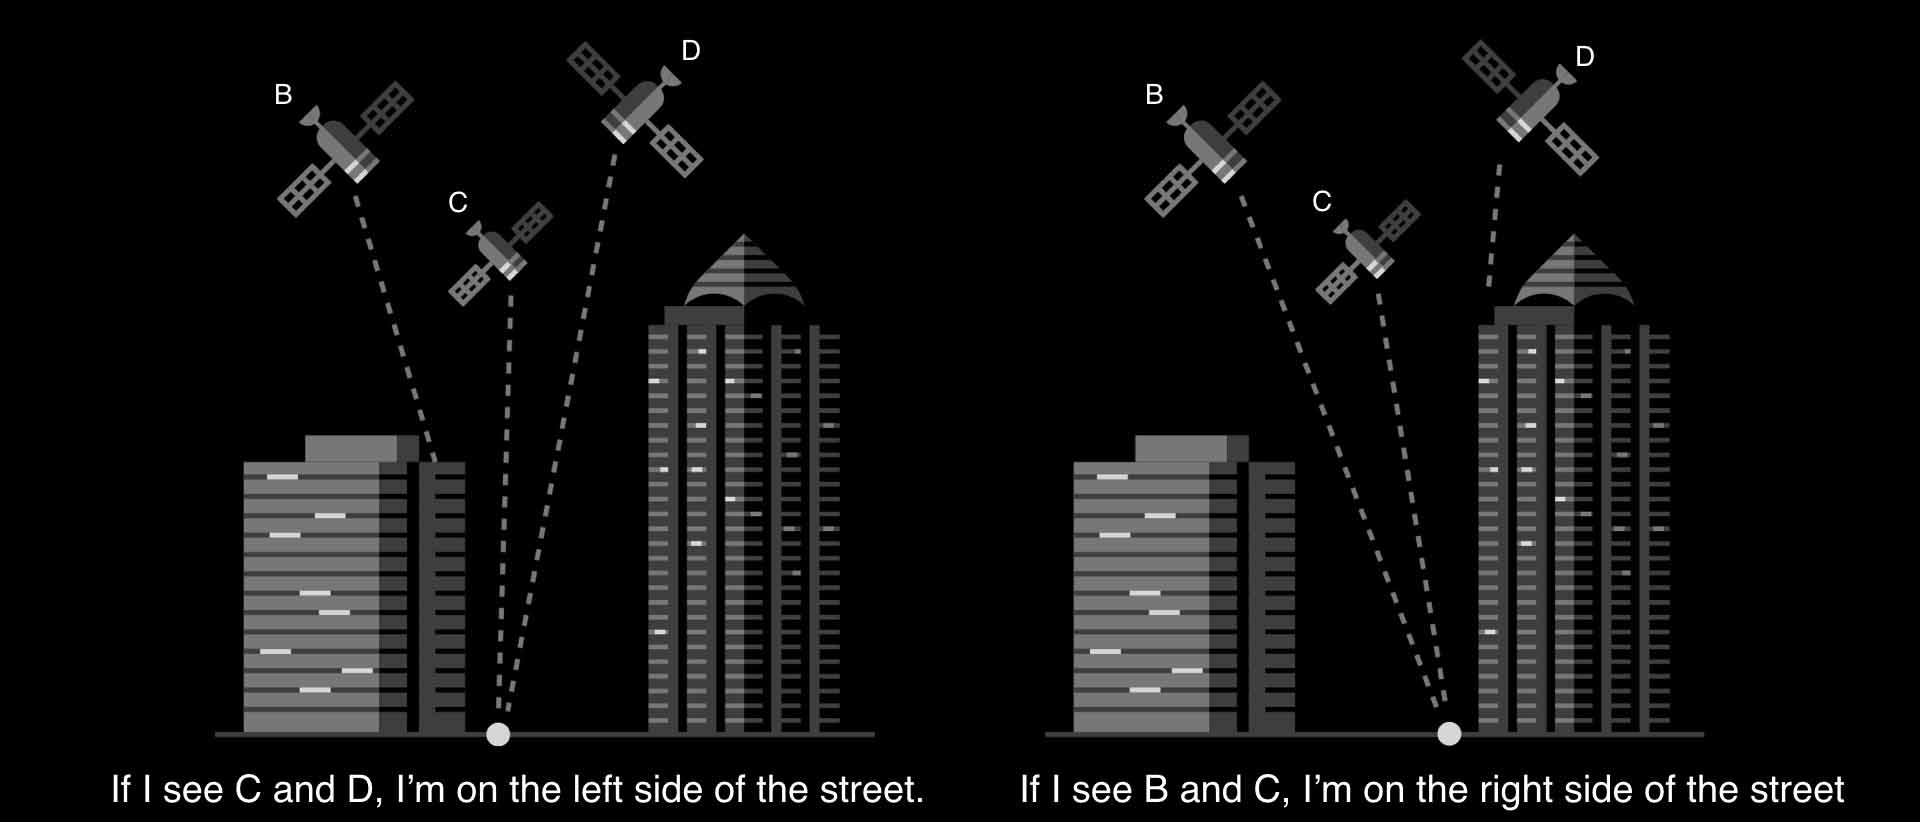
Our approach to increasing the accuracy of determining the location creates a feature of each GNSS signal limitation that creates problems for standard receivers. How? For Android phones, the LocationManager API provides not only the approximate position of the phone, but also a signal-to-noise ratio (SNR) for each visible GNSS satellite. If we compare the “signal strength” information with 3D maps, then we can get very valuable information about the position. Image 4 below shows a simplified version of how SNR satellites and 3D maps can be used to guess which side of the street we are in:
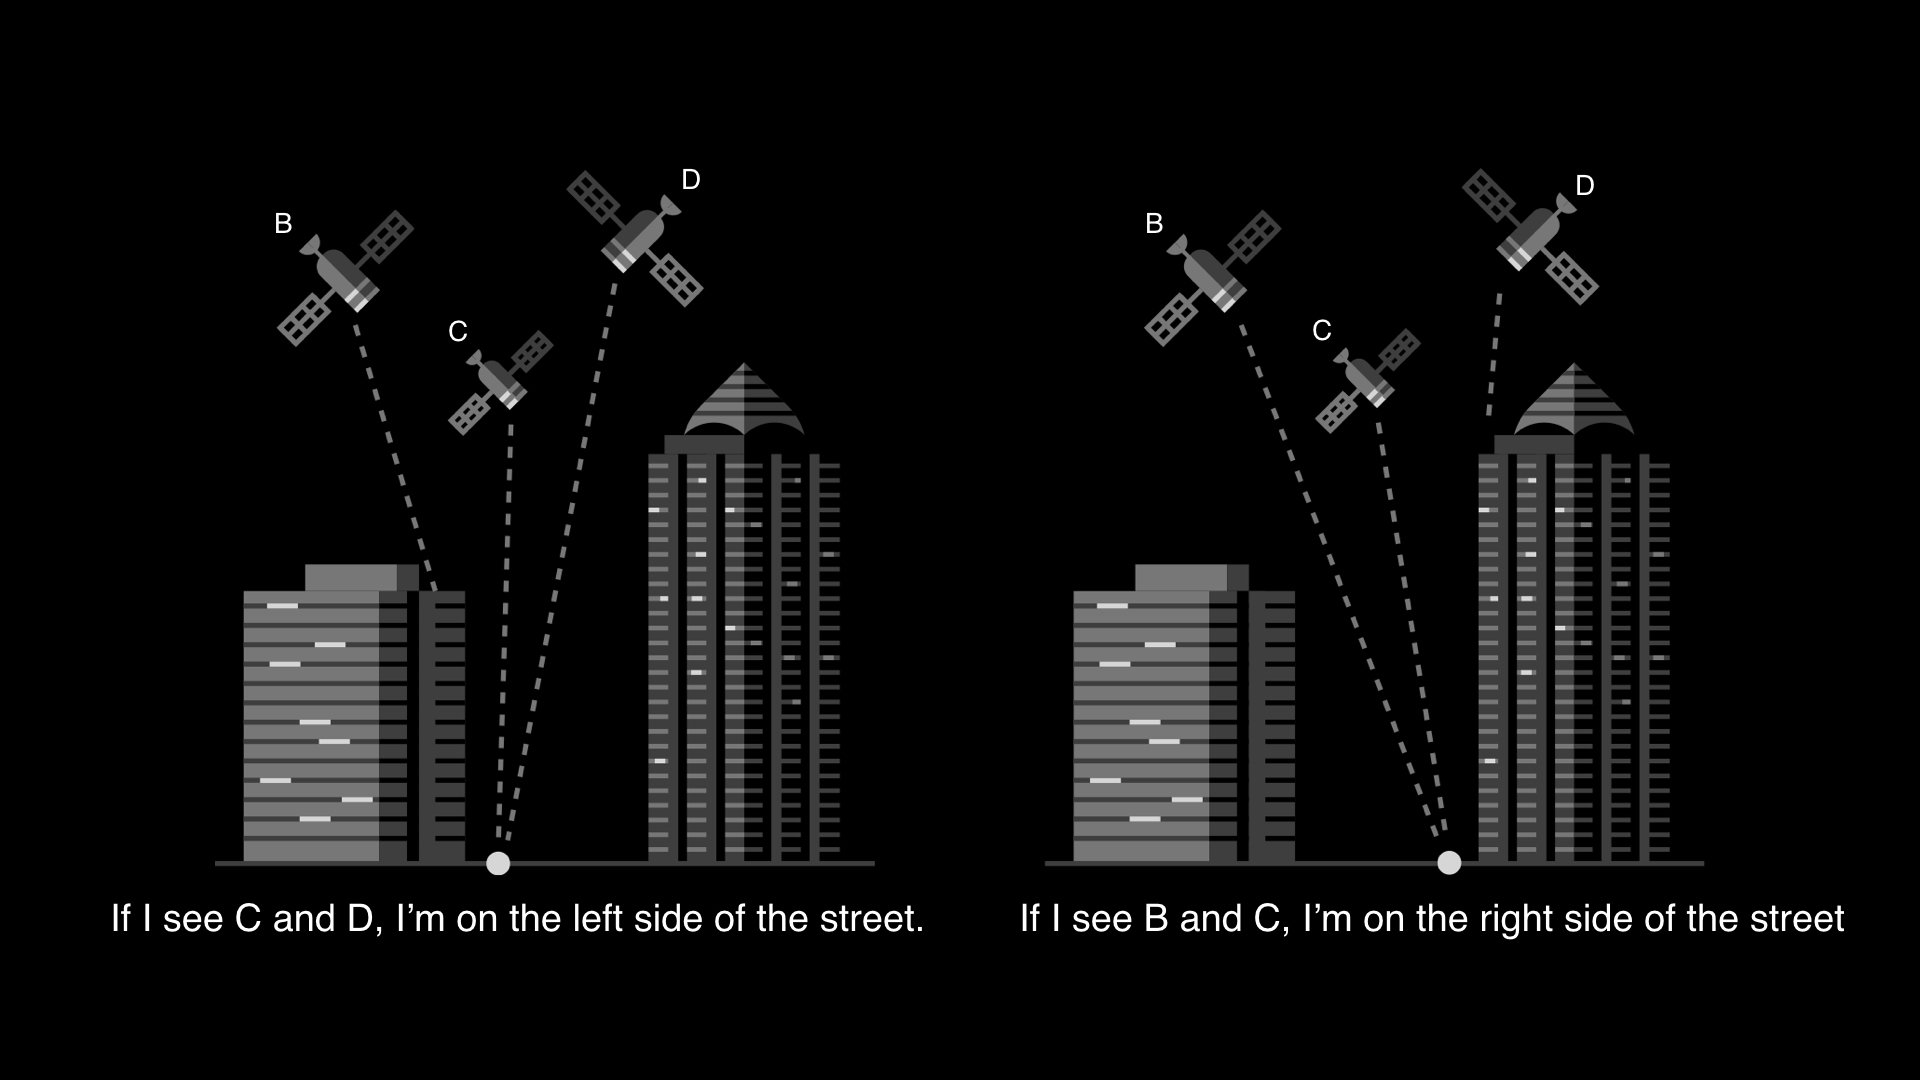
Image 4: Signal strength of satellites, combined with 3D maps, provides very valuable location information.
Plunging into details, our approach is based on placing the following assumption in the mathematical framework: if the SNR for a satellite is low, then the line of sight line may be limited or obscured; if the SNR is high, then the LOS (line of sight) may be clean. The “possibly” specifier is critical here: even if the receiver is in the shadow zone, strongly reflected signals can still reach it, and even if it is in clean terrain, the received signal may be weak (due to destructive interference between LOS and reflected paths , a phenomenon related to multipath attenuation ). Also in most cases, the 3D map is not completely accurate, and definitely does not convey random constraints with large moving objects not reflected on the map, like trucks. This adds uncertainty to the process.
Probabilistic shadow mapping using ray tracing
Although the intuitive assumption that the signal strength of the satellites carries useful location information sounds good, it must be specified using a probabilistic framework. For any possible position of the receiver, we can check whether the beam is blocked from this position to the satellite on our 3D map. Now, using the model for the SNR probability distribution under LOS and shadow conditions, we determine the most likely SNR value for this satellite. For example, if the position is shaded, then the probability of a high SNR is small. The total probability of a given position, based on the SNR of the satellites, is the product of the probabilities associated with different satellites. By doing this on a grid of possible positions, we get a probabilistic surface - or a thermal map of the possible positions of the receiver, based only on the signal strength of the satellites. We call this procedure probabilistic shadow mapping .
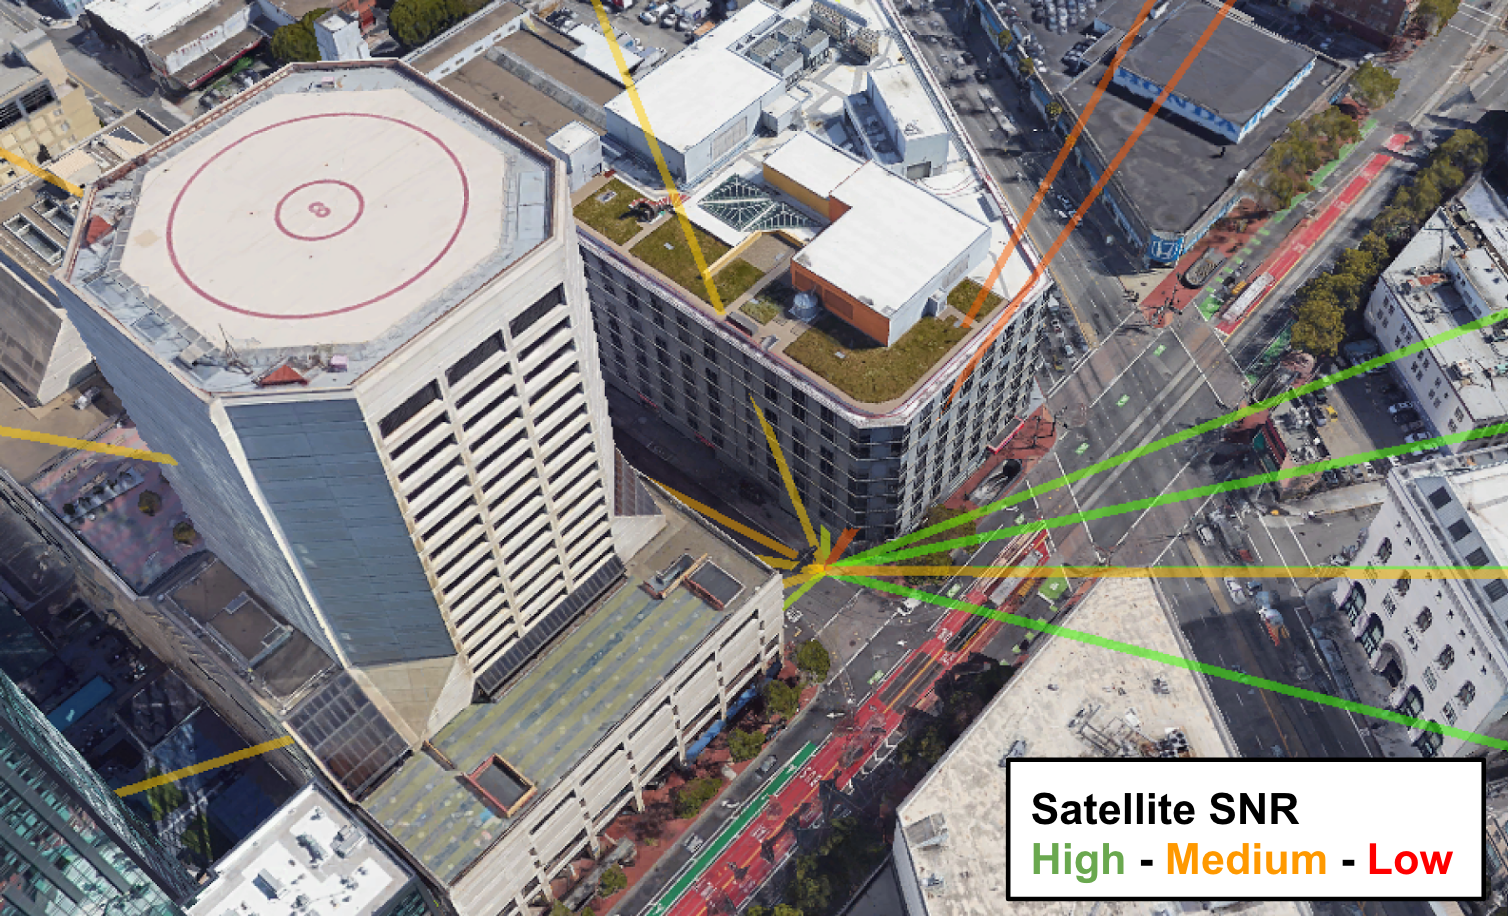
Image 5: Ray tracing from one possible location to each satellite for probabilistic shadow mapping. This is done for thousands of likely locations.
A probabilistic surface, or heat map, from probabilistic shadow mapping combines information from satellite SNR measurements. However, as we see in Image 6 below, this heat map can be very complex. It can have many isolated, strongly separated hot spots (local maxima) often corresponding to a given side of the street, but sometimes to incorrect positions (for example, phantoms). In order to narrow our approach to the position and avoid a tip to phantoms, we must combine this information with even more of it.
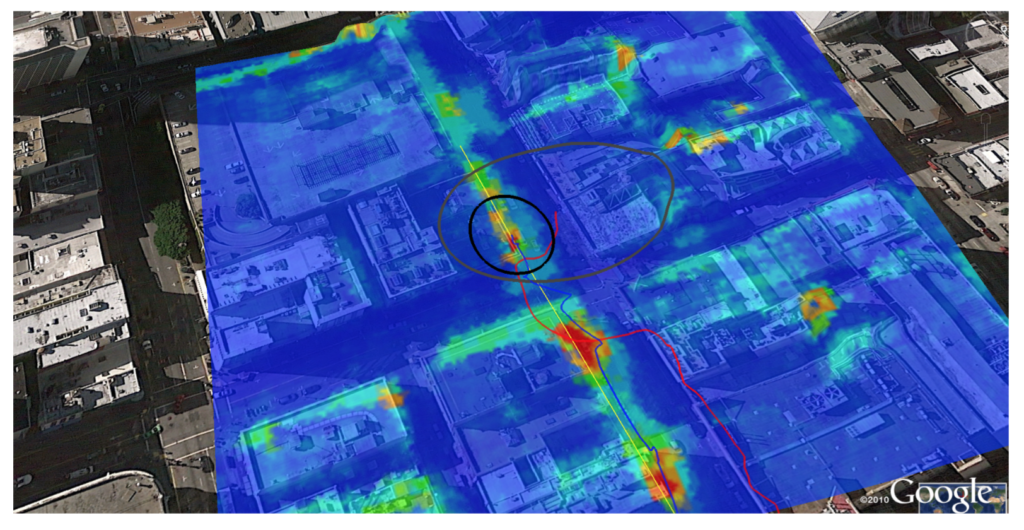
Image 6. A heat map of positions calculated using satellite signal strength can have many hot spots. In the example above, our improved position approximation (blue path, black ellipse with uncertainty) follows the actual path (yellow path), while the usual GPS (red path, gray ellipse with uncertainty) is inaccurate.
Combination of information through a partial filter
For Android phones, the information we use in addition to the signal strength of the satellites is usually the standard GNSS position fix, but there can also be a position on the Android Fused, which may include Wi-Fi-based positioning. Since this location can be quite inaccurate, a one-time instantaneous combination of the standard GNSS fix with a probabilistic shadow mapping usually leads to poor performance. In order to take advantage of information about the strength of satellite signals, we trust GPS less in built-up areas (the gray ellipse of GPS uncertainty in image 6 is the usual model we use, and the black ellipse of uncertainty for improved GPS is the result of our algorithm). Then we use previous measurements and impose restrictions on changes in position over time, using a model adapted for the application (for example, a pedestrian against a car). We achieve this by using a partial filter that approximates the probabilities of the distribution of receiver positions at any given time by a set of suspended particles. In other words, we assume where the phone is located, using thousands of possible locations (i.e., particles).
Over time, the probabilistic weights and locations of particles progress through measurements and a motion model. Because the heat map from probabilistic shadow mapping has so many local maxima, and since the GNSS correction can have such large outliers, we cannot use conventional techniques like the Kalman filter or the extended Kalman filter , which is based on the tracked distribution probability well approximated by the Gaussian handbell. A partial filter allows us to approximate an arbitrary distribution, in exchange for greater complexity, and here our server architecture comes into play.
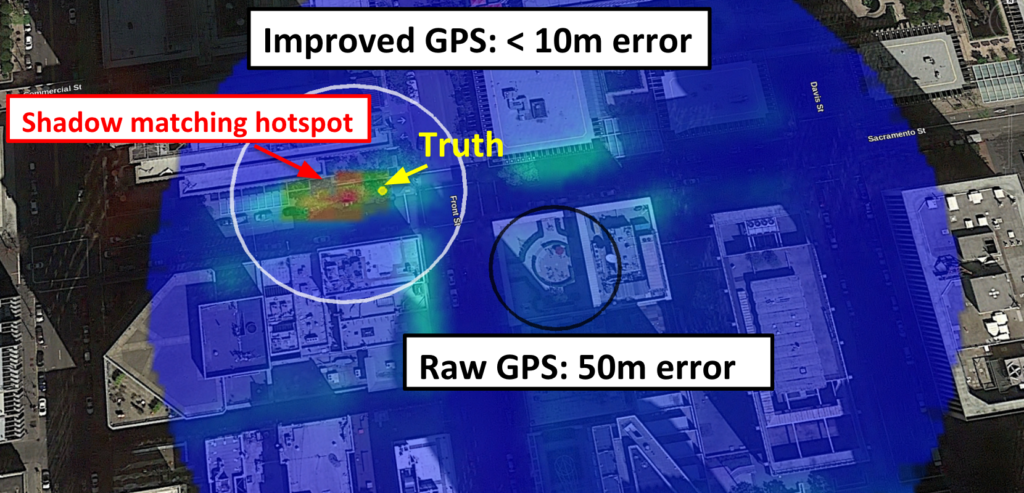
Image 7: The location approximation obtained as a weighted centroid of hot spots provided by a partial filter often corrects very large GPS errors. The radius of inaccuracy (white circle) for improved GPS is based on a slice of a set of particles, and is often a more realistic measurement than the small radius of inaccuracy (black circle) usually returned a clean GPS even when position errors are large.
From signal processing to scale software
The combination of a partial filter and ray tracing adds complexity to the ecosystem of backend servers, with getting very stateful services.
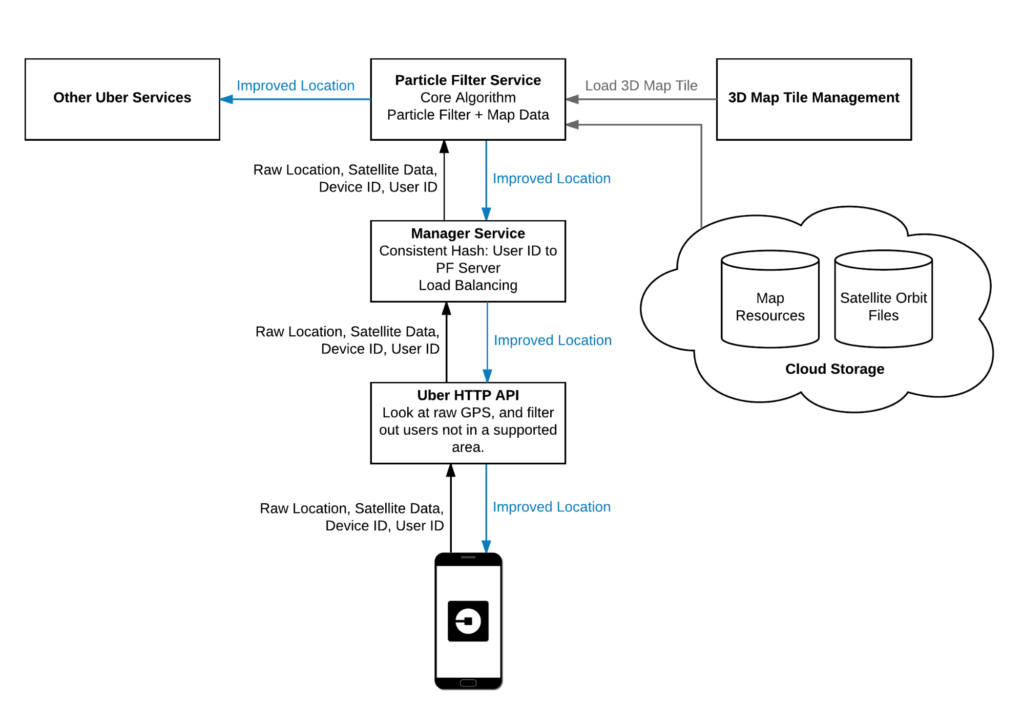
Image 8: The improved GPS Uber system consists of a partial filter service, a 3D tile management service, a service manager, an Uber HTTP API, and cloud storage and integrates with other Uber services.
The game has two types of state: the state of the partial filter for each user and the 3D maps used for ray tracing, regionally. Using a partial filter requires a level of server affinity. Each new request to our service should be sent to the same backend server for processing in order to update the correct partial filter. Additionally, due to the large size of the 3D cards, each backend server may contain some small amount of the 3D world in RAM.
Since each server can contain only a few square kilometers of these cards, not all servers can serve all users. The implementation of the backend system for our solution required the creation of a session routing layer, which takes into account the 3D server map. In addition to internal tests and performance evaluations, we also launched a test on our own Android devices using the internal version of the Uber app for drivers, which is illustrated in Image 9 below:
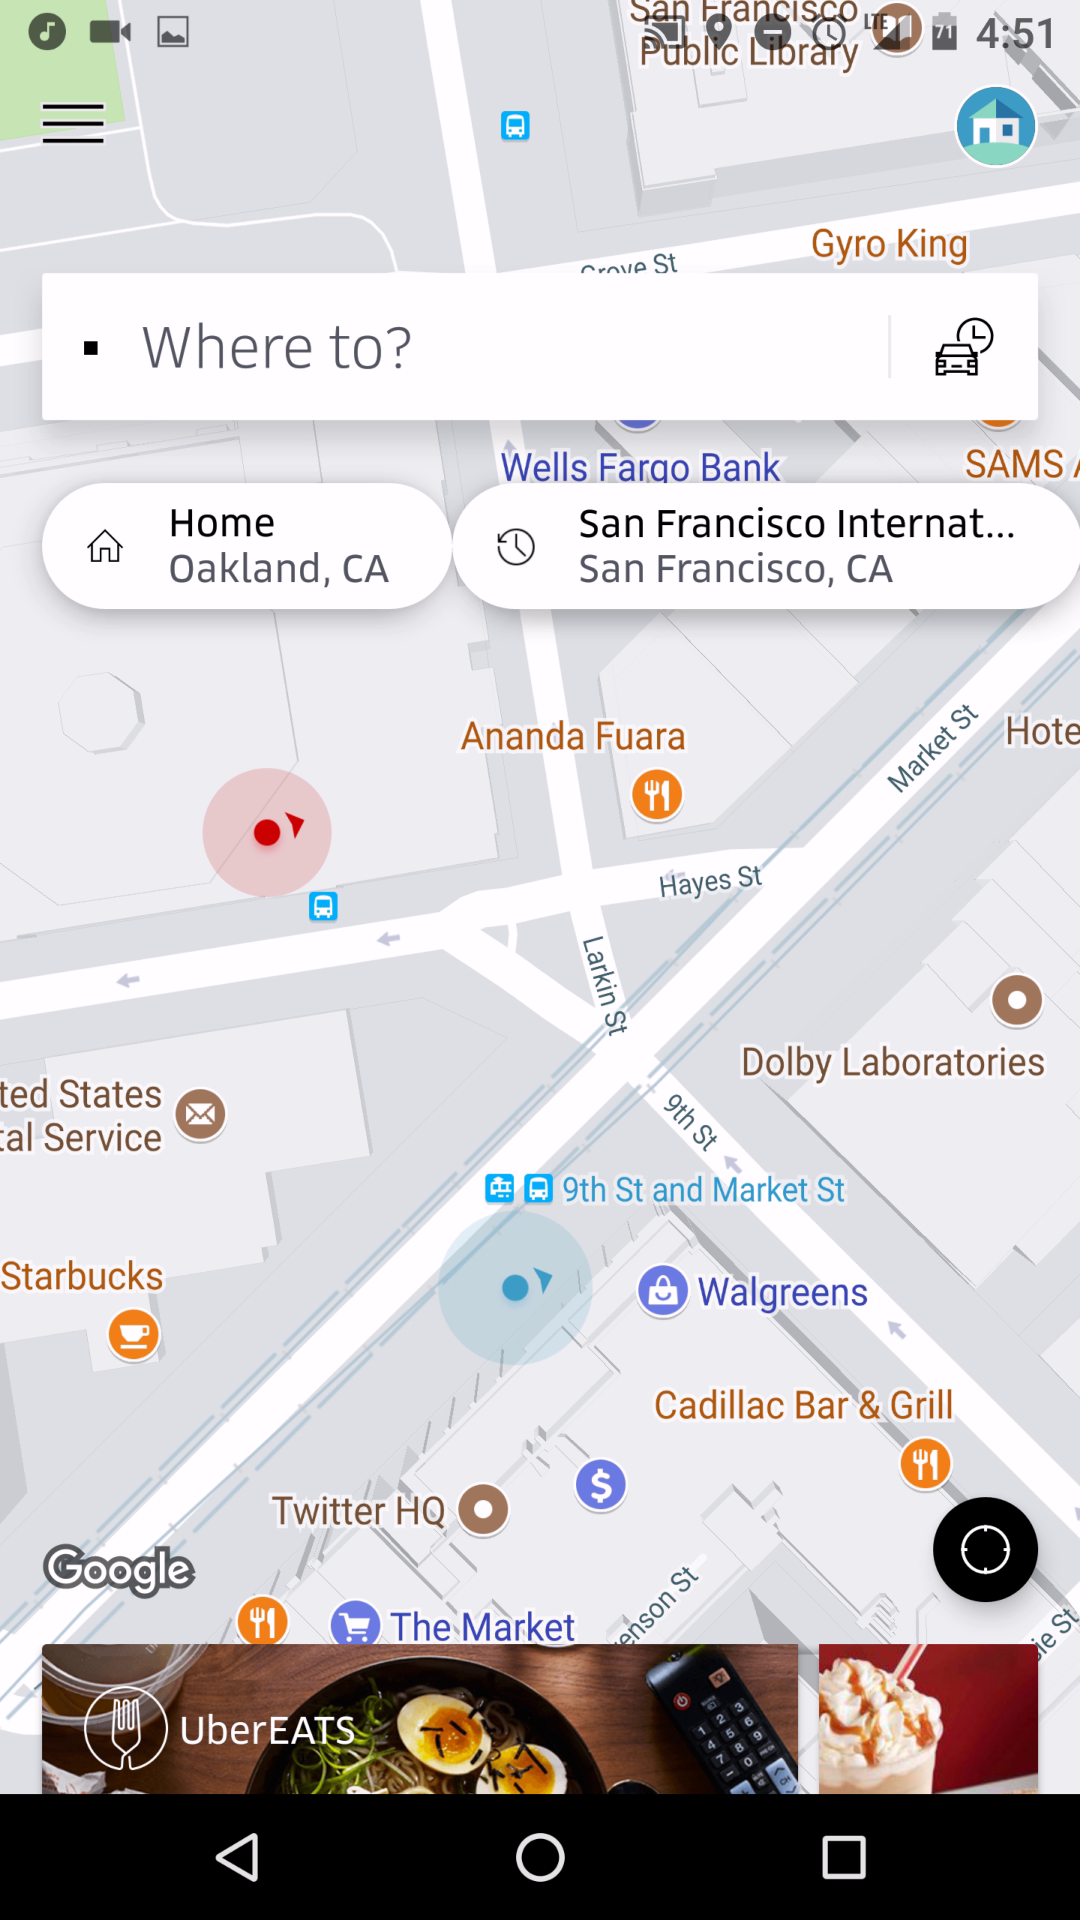
Image 9: Comparing the red / blue point in our internal version of the driver app, allowed Uber employees to test our solution anywhere in the world.
Moving forward
Accurately determining the position of a passenger and a driver is a very important condition for fulfilling a Uber mission in order to provide transportation with the same reliability as water delivery everywhere and for everyone. To achieve our mission, our Sensing, Intelligence and Research teams are working on a range of approaches to improve the position with creative use of sensors and computing on mobile devices, combined with the computing power of our server infrastructure. The combination of advanced signal processing, machine learning algorithms and software on a scale has great potential, and we are always looking for talented and highly motivated individuals (software engineers and algorithms, data visualization engineers and machine learning engineers) to join us and help us realize this potential.
Danny Iland, Andrew Irish, Upamanyu Madhow, & Brian Sandler are members of the Uber's Sensing, Inference and Research team. Danny, Andrew, and Upamanyu were part of the original group that conducted this study at the University of California, Santa Barbara. After launching this work as a startup, they demonstrated server-side partial filtering to improve position detection in San Francisco using 3D maps created using publicly available data from airborne LiDAR. They joined Uber in July 2016.
Source: https://habr.com/ru/post/353978/
All Articles