Fight for a smooth display in the video surveillance system: find jerks and neutralize
It is natural that with the development of a product, attention to its quality also increases. And not only in terms of functioning, but also in relation to user aesthetics.
A few years and versions ago, we were faced with a poor quality video display in Macroscop. There were "jerks", because of which suffered the smoothness of the display, which ultimately worsened the overall visual perception.
When the user sees that the image is not “twitching” on the screen, he doesn’t care much what causes this. The reasons for this may be many, since the video system consists of many components, and software is just one of them. But we had to do everything so that Macroscop, for its part, displays as smoothly as possible.
')
And for this, developers needed to clearly understand the task with measurable requirements, and for the quality group, to have an assessment tool. In this article, we will describe which metric we use to measure smoothness and with the help of which tool we evaluate it.
#spoiler
So, how to determine whether the video is smoothly displayed or not smoothly?
What immediately comes to mind? - compare what we see in the client application with the “native” display of the ip-camera.
And the first decision is an assessment by a group of experts: we select several people, show them the video and ask to rate it for jerks.
This is a head-on decision. To a certain extent, effective, but very time consuming and too subjective for practical use. Gathering experts every time a quality group receives a regular prototype from developers is completely inappropriate.
Instead of a subjective assessment of “like-dislike”, it was necessary to find a criterion of smoothness or the expected behavior of the product, which can be fixed.
This criterion was formulated as follows: for a smooth display, it is enough that each frame is displayed on the monitor screen.
In accordance with it, a second solution appeared. A new method of measuring “non-floating” consisted of the following: creating and displaying a video clip with a sequence of numbers (each digit in the part of the frame reserved for it) or a stopwatch, shooting the displayed video on the IP camera, running it through the Macroscop, displaying it again and again shooting using another camera (smartphone camera, go pro, etc.).
Expectation. The resulting video is parsed frame by frame: we count the number of delayed or missing frames (numbers) and see how many jerks there were. The way is laborious (try to frame video with a standard 25 fps frequency for an IP camera frame by frame! It’s almost 1500 frames per minute), but it would seem to be objective.
Reality. In practice, everything turned out not quite. A standard ip camera delivers a stream with a frequency of ~ 25fps, a monitor of ~ 60fps, a smartphone camera ~ 30fps. It turned out that, besides the frame rates are not multiple, the cameras and monitors do not work synchronously. Therefore, sometimes at the time of reading the video of any of the cameras on the monitor there was a frame change. As a result, it was “smeared” and the figure on the image was impossible to disassemble.
Thus, the second method also did not fit.
There were other options for capturing or collecting statistics by the client application itself, which displays the video stream, but we also discarded them. I wanted to evaluate only the external component - exactly what the user sees, for which the whole system is a “black box”.
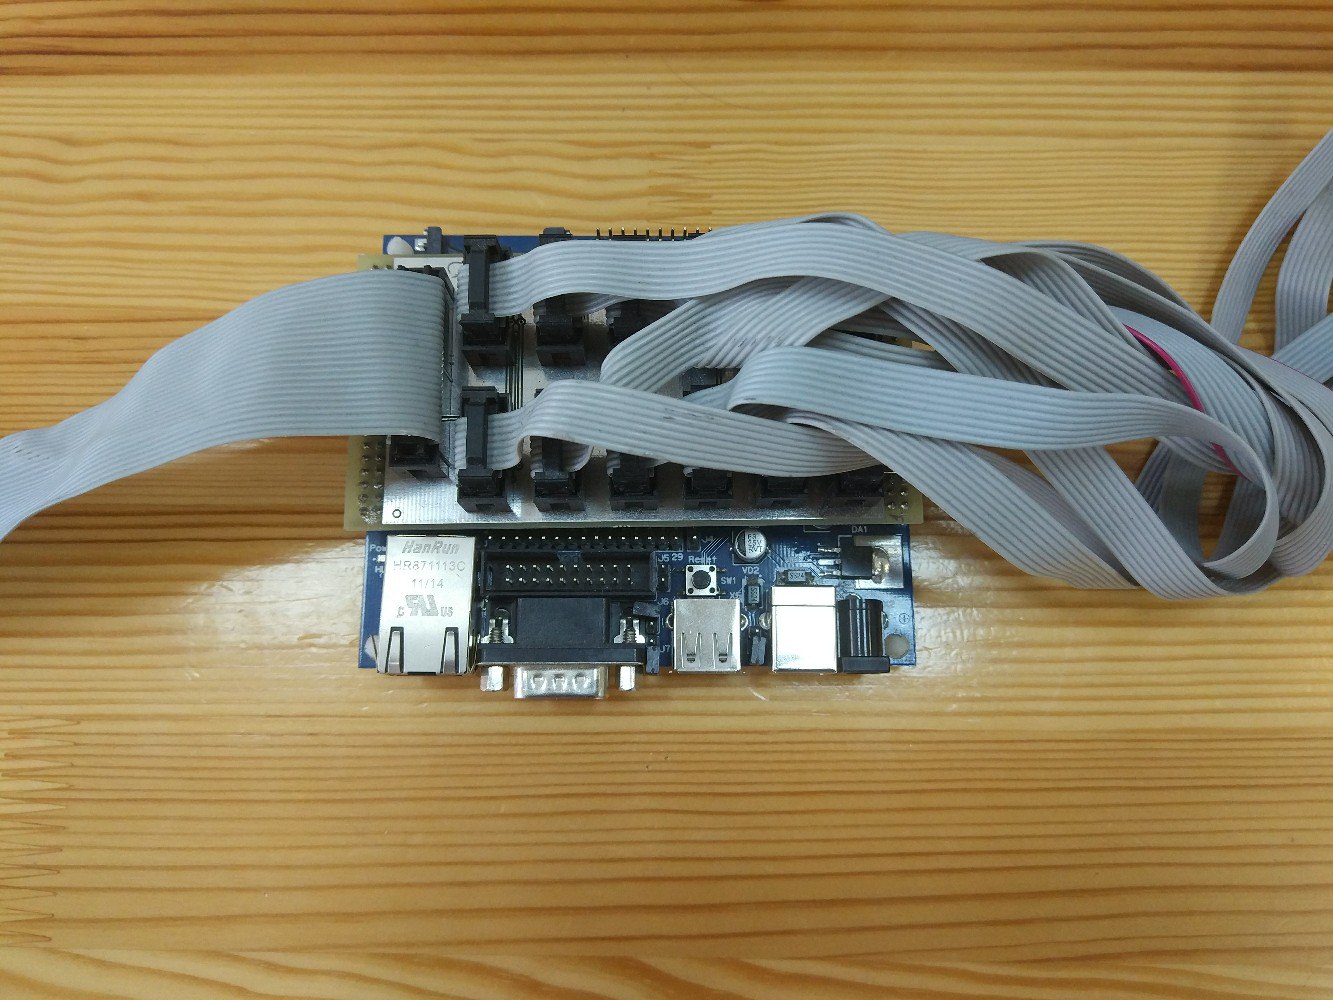
The result of our search was a hardware solution - a stand based on a microcontroller.
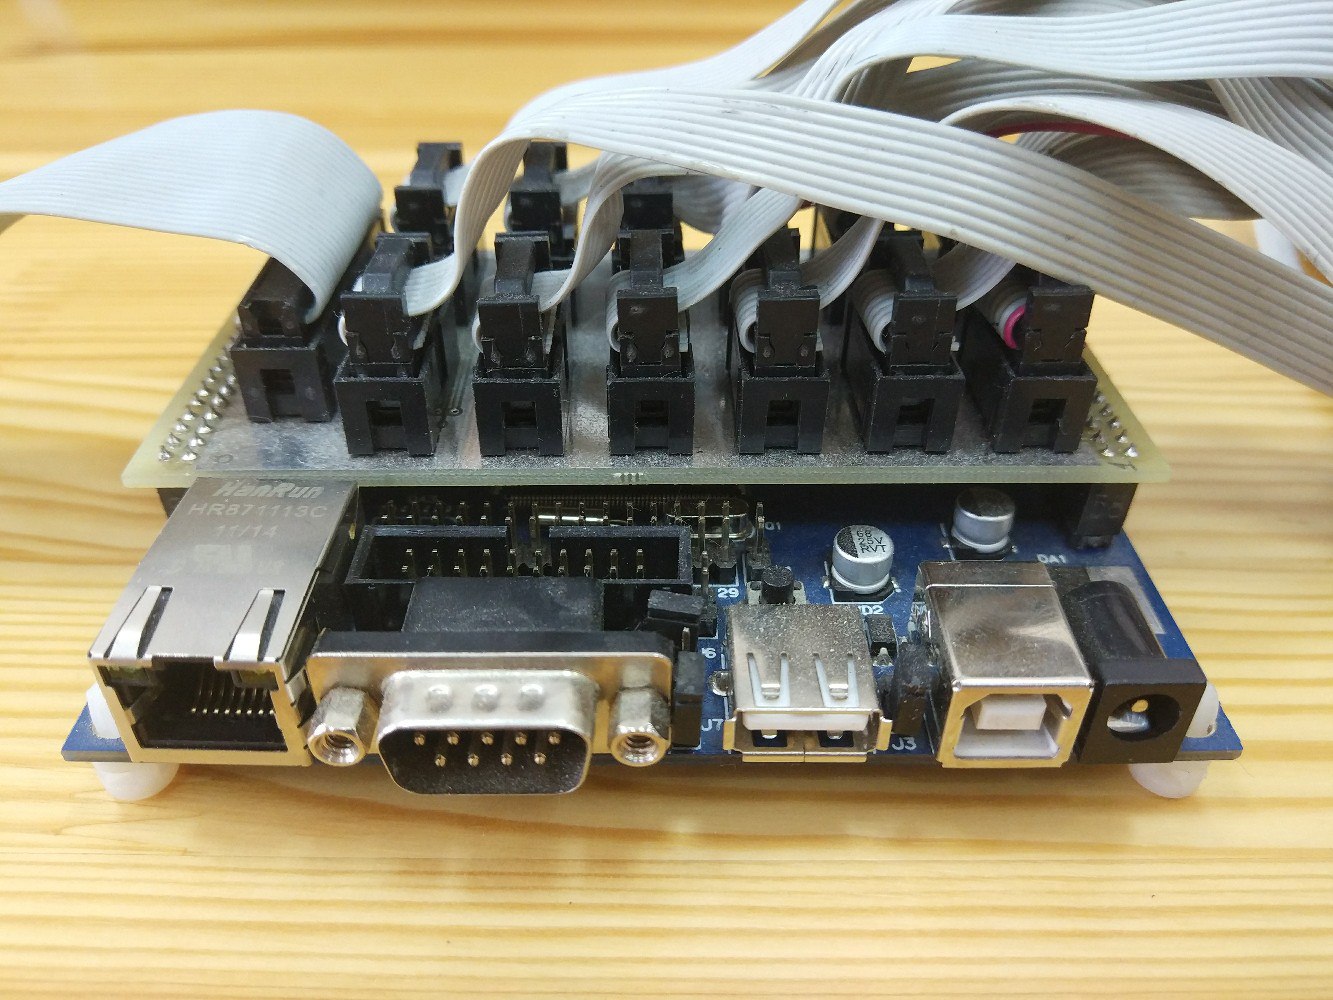
It includes a canvas with 12 LEDs, which captures the video camera, and a canvas with 12 photosensors, which are superimposed on the monitor, which displays the video stream from this camera, and capture light signals. The entire device is placed in a light-tight box to eliminate the influence of external light sources.
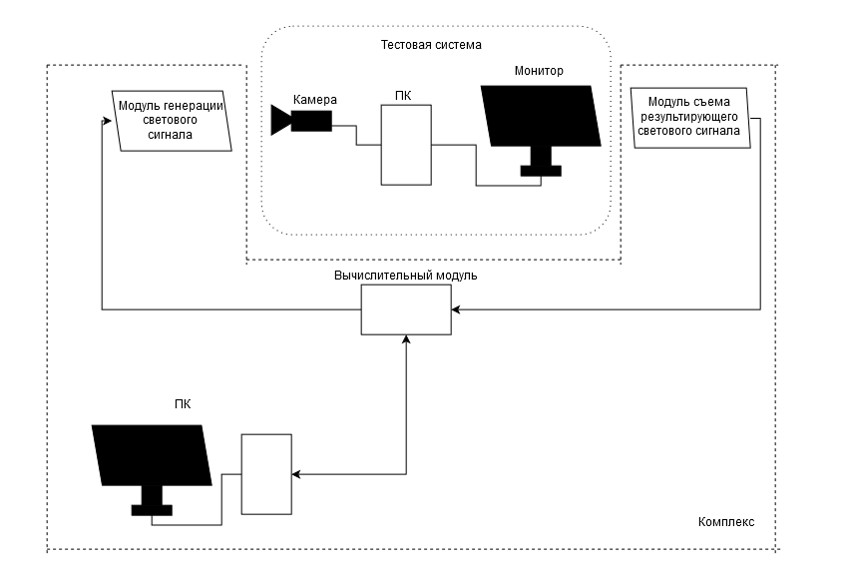
The device displays a specific sequence of patterns on the LEDs, reads the result and writes it into a separate line of the report.
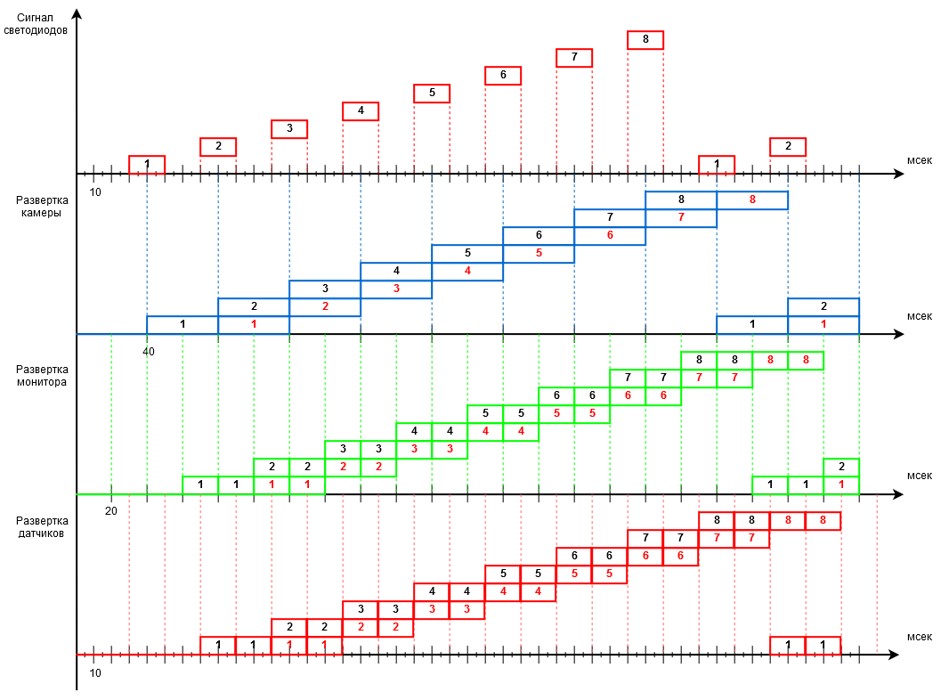
LEDs display a specific pattern of light signals with a certain frequency. For example, for a camera with a frequency of 25 fps, the change occurred once in 1 frame or 40 ms (the pattern lights up for 20 ms, extinguishes for 20 ms, then the next one lights up, etc.)
We expected the camera to capture exactly what the eye sees, or even its own photo sensors of the stand. Here's how, according to our expectations, the fixed sequence of 8 patterns should look like:

Each time the LEDs reproduced the same sequence of signals, but in the reports this sequence was sometimes broken: there were frames that should not be (the LEDs from two adjacent patterns were active on them).
We experimented with different IP video cameras and it turned out that 25 fps camera with progressive scan gave the clearest footage (unlike, for example, the 50 fps version with interlaced scan), while it minimally violated the frame sequence during transmission over the network.
Anyway, we were not able to get rid of artifacts completely - some frames came late or merged with others, but in fact it was not jerky.
The Kotelnikov theorem came to the rescue, according to which a reference frequency of at least 2f is required to reconstruct an analog signal of frequency f. That is, to restore the signal from the LEDs in our case can only be reliably for a frequency of 12.5 fps, which corresponds to 80ms.
As a result
As a result, the hardware solution we implemented made it possible to fix jerks corresponding to frame delays of 80ms and above, which significantly worsen the perception of the displayed video.
The method is effective, solves the problem of detecting jerks, and also thanks to automation, it requires minimal time and effort of the quality group. To date, we regularly apply it to the regression testing of each new release.
As a result (although having spent a lot of time) for the subjective criteria of smoothness / non-smoothness, we obtained a completely objective method of measurement. The assembled stand made it possible to quickly assess the smoothness of the display for any parameters of the system (different network bandwidth, different performance of the equipment for processing and display). In addition, it does not have a binding to the Macroscop application, so with its help we are testing both desktop, mobile and web clients.
A few years and versions ago, we were faced with a poor quality video display in Macroscop. There were "jerks", because of which suffered the smoothness of the display, which ultimately worsened the overall visual perception.
When the user sees that the image is not “twitching” on the screen, he doesn’t care much what causes this. The reasons for this may be many, since the video system consists of many components, and software is just one of them. But we had to do everything so that Macroscop, for its part, displays as smoothly as possible.
')
And for this, developers needed to clearly understand the task with measurable requirements, and for the quality group, to have an assessment tool. In this article, we will describe which metric we use to measure smoothness and with the help of which tool we evaluate it.
#spoiler
So, how to determine whether the video is smoothly displayed or not smoothly?
What immediately comes to mind? - compare what we see in the client application with the “native” display of the ip-camera.
And the first decision is an assessment by a group of experts: we select several people, show them the video and ask to rate it for jerks.
This is a head-on decision. To a certain extent, effective, but very time consuming and too subjective for practical use. Gathering experts every time a quality group receives a regular prototype from developers is completely inappropriate.
Instead of a subjective assessment of “like-dislike”, it was necessary to find a criterion of smoothness or the expected behavior of the product, which can be fixed.
This criterion was formulated as follows: for a smooth display, it is enough that each frame is displayed on the monitor screen.
In accordance with it, a second solution appeared. A new method of measuring “non-floating” consisted of the following: creating and displaying a video clip with a sequence of numbers (each digit in the part of the frame reserved for it) or a stopwatch, shooting the displayed video on the IP camera, running it through the Macroscop, displaying it again and again shooting using another camera (smartphone camera, go pro, etc.).
Expectation. The resulting video is parsed frame by frame: we count the number of delayed or missing frames (numbers) and see how many jerks there were. The way is laborious (try to frame video with a standard 25 fps frequency for an IP camera frame by frame! It’s almost 1500 frames per minute), but it would seem to be objective.
Reality. In practice, everything turned out not quite. A standard ip camera delivers a stream with a frequency of ~ 25fps, a monitor of ~ 60fps, a smartphone camera ~ 30fps. It turned out that, besides the frame rates are not multiple, the cameras and monitors do not work synchronously. Therefore, sometimes at the time of reading the video of any of the cameras on the monitor there was a frame change. As a result, it was “smeared” and the figure on the image was impossible to disassemble.
Thus, the second method also did not fit.
There were other options for capturing or collecting statistics by the client application itself, which displays the video stream, but we also discarded them. I wanted to evaluate only the external component - exactly what the user sees, for which the whole system is a “black box”.
The result of our search was a hardware solution - a stand based on a microcontroller.
It includes a canvas with 12 LEDs, which captures the video camera, and a canvas with 12 photosensors, which are superimposed on the monitor, which displays the video stream from this camera, and capture light signals. The entire device is placed in a light-tight box to eliminate the influence of external light sources.
The device displays a specific sequence of patterns on the LEDs, reads the result and writes it into a separate line of the report.
LEDs display a specific pattern of light signals with a certain frequency. For example, for a camera with a frequency of 25 fps, the change occurred once in 1 frame or 40 ms (the pattern lights up for 20 ms, extinguishes for 20 ms, then the next one lights up, etc.)
We expected the camera to capture exactly what the eye sees, or even its own photo sensors of the stand. Here's how, according to our expectations, the fixed sequence of 8 patterns should look like:
Each time the LEDs reproduced the same sequence of signals, but in the reports this sequence was sometimes broken: there were frames that should not be (the LEDs from two adjacent patterns were active on them).
We experimented with different IP video cameras and it turned out that 25 fps camera with progressive scan gave the clearest footage (unlike, for example, the 50 fps version with interlaced scan), while it minimally violated the frame sequence during transmission over the network.
Anyway, we were not able to get rid of artifacts completely - some frames came late or merged with others, but in fact it was not jerky.
The Kotelnikov theorem came to the rescue, according to which a reference frequency of at least 2f is required to reconstruct an analog signal of frequency f. That is, to restore the signal from the LEDs in our case can only be reliably for a frequency of 12.5 fps, which corresponds to 80ms.
As a result
As a result, the hardware solution we implemented made it possible to fix jerks corresponding to frame delays of 80ms and above, which significantly worsen the perception of the displayed video.
The method is effective, solves the problem of detecting jerks, and also thanks to automation, it requires minimal time and effort of the quality group. To date, we regularly apply it to the regression testing of each new release.
As a result (although having spent a lot of time) for the subjective criteria of smoothness / non-smoothness, we obtained a completely objective method of measurement. The assembled stand made it possible to quickly assess the smoothness of the display for any parameters of the system (different network bandwidth, different performance of the equipment for processing and display). In addition, it does not have a binding to the Macroscop application, so with its help we are testing both desktop, mobile and web clients.
Source: https://habr.com/ru/post/353920/
All Articles