Newman and Continuous Integration on the example of Atlassian Bamboo. The invention of the bicycle
Introduction
In a recent article, our comrade actopolus talked about how we learned to use Postman to implement functional testing of our project API. Having learned how to write functional tests, and having written them about a hundred and fifty, we decided that it was the very time - the time to tie these tests to our CI assemblies.
In general, initially the process of integrating Postman tests into assemblies could be divided into 3 simple steps:
- Building a production-ready test collection for Postman
- Preparing a docker environment image for running tests
- Writing tasks to put everything together and run on agents
However, we did not take into account one very important nuance - we did not have a tool for measuring the coverage of our code with Postman-tests. Without information about how well we cover the test code, it was difficult for us to understand where we are now and what we need to strive for. Consequently, the plan was supplemented by another item:
- Writing tasks to put everything together and run on agents.
1. Test collection
So let's get down to the process itself. Our team coped with the first point heroically quickly, especially since the production-ready version was not so very different from dev, in the sense that the quality of the tests that we wrote in Postman for the “first attempt at writing” turned out to be quite high. How to write Postman-tests correctly and what's what, already told actopolus in his article Introduction to Postman . How to start Postman from the console? The answer is simple - no way. But, fortunately, there is a special console utility that can do almost everything the same as Postman, and her name ... Newman !
It is thanks to Newman that we will integrate Postman tests into CI.
2. Docker
In the meantime, I set about the docker image. First, an alpine based image was assembled on which the initial launches were performed. After that, I found that in the depths of the docker hub there was already a ready-made image with Newman , assembled for all the same alpine, but more lightweight. It seemed that the task was reduced only to merging the already existing image from the docker hub into our local hub, however, it turned out that it does not suit us in its pure form due to non-compliance with the standards adopted within the company. Therefore, I had to collect my image. To do this, we first of all changed the base image to our alpine which is used in all images of this kind. With the next step, we cut out all the unused components and changed the entry point so that it was enough for us to pass on only the parameters for newman to us, without passing the entire launch string. This is exactly how the image turned out, which arranged for us in all respects and got into our docker hub.
')
3. coating shovel
After unsuccessful attempts to give birth to a hedgehog to fasten the c3 library from codeception to the newman-tests, I decided that it would be faster to invent a bicycle to write my library to collect newman test coverage (I agree, it sounds very profane).
Why I decided to invent a bicycle:
- Ease of use. If you need to give birth to a pair of hedgehogs against wool in order to connect the measurement of code coverage by tests in your application, most likely there is something wrong with the implementation. Our library is connected by the 1st line.
- Since we have not one, but many projects, we can take into account all their features in the library, which in consequence will make it easy to use.
- We ourselves guarantee the support of the library. It will not disappear anywhere in six months and we can always transfer it to the new version of php.
“Why pull a cat by the balls?” - I thought and decided to start writing a scoop to measure coverage, especially since most of the work (perhaps all 90%) for this purpose is already implemented in the php-code-coverage library, which uses basically xDebug . It remains only a little to shift it in their own way.
So, our shocker will consist of 2 parts. The first will be responsible for collecting and preparing reports on the files and lines launched during the test, the second will be a CLI application that will collect all the reports together and format it in the specified format.
How does this work in the SebastianBerghmann library?
In fact, php-codecoverage is an add-on over a pair of drivers to choose from (phpdbg, xDebug). The point is simple, you initialize the script to collect information about the lines being executed (and not being executed), and at the output you get an array with this data. The php-codecoverage library is designed to make sexual arrays of these arrays in xml, html, json and text formats from these arrays. It is also divided into 2 parts, and also one part is engaged in collecting information, and the second is formatting.
What makes our bike?
- Connects in one line
$coverage = new Coverage(); - It has a default configuration
- It starts listening if and only if it encounters a certain flag in the request header.
- Add all the reports to where we tell him.
- CLI - can not only collect reports, but also to clean it after itself.
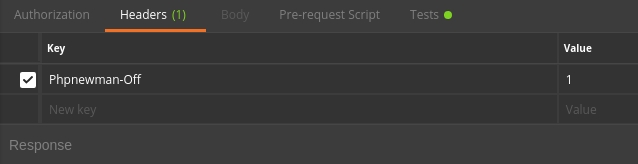
In order for all this wealth to work, we had to add a marker to our tests.
It looked like this:
“Compiled” reports allow you to see in which test these or other lines of code are run and look like this:

This is a screen with a code cover.

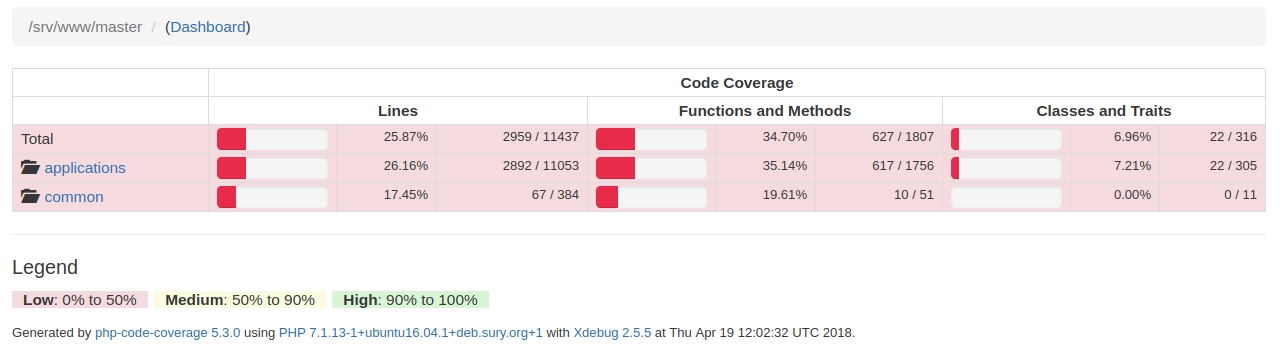
This is how the code is covered by folders.
Reports are generated by the utility that is included with the php-code-coverage package.
If it’s interesting to a respected reader, we’ll tell you about how this shocker works in a separate short article.
So with paragraph 3, we also figured out. There was at least an interesting point ... 4th
Point 4, dramatic
In order to implement the normal functional testing of the project and the assessment of coverage, let's look at the scheme of how it still works.
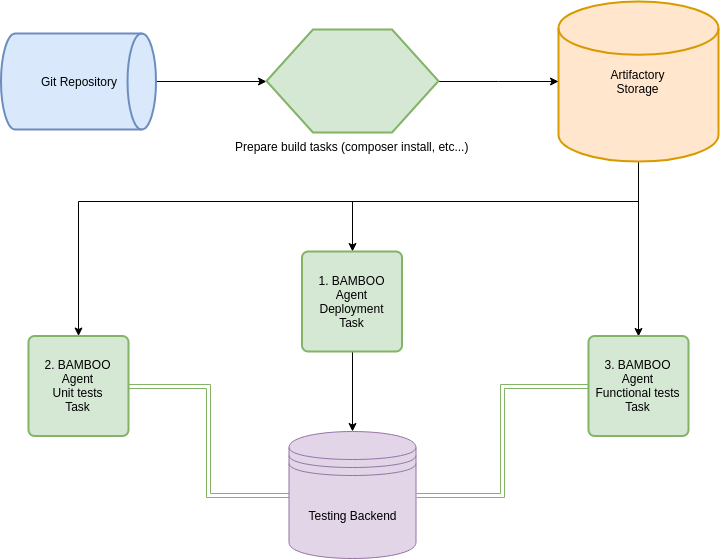
1. So, first, the code base is merged from the GIT repository to the BAMBOO agent, and then the project builds on it.
In our case, the composer is built and the configuration files are processed under the Development environment. It is at this stage that we replace the PHPNEMWMAN_OFF header value with PHPNEWMAN_ON in our tests (this is because the build plan is designed to measure coverage, but you shouldn’t do this in a build plan that aims to build a project, because measuring coverage significantly slows down the build process).
sed -i -e "s/Phpnewman-Off/Phpnewman-On/" ./code/newman/collection.json 2. The next step is collected project poured into the repository of artifacts. This is done in order not to collect it every time, for each individual task.
3. After the assembled project is safely merged into the artifactor, the next task also safely merges it from there and unloads it onto the test backend.
4. The following task also merges the project from the artifactor and runs newman tests on it. It should be immediately noted that these tests will not go to the localhost bamboo-agent, but to the test backend where we poured the project a step earlier. Tests run in the docker container.
You can run the tests in the docker container quite simply:
docker pull docker-hub-utils.kolesa:5000/build/nodejs/newman:latest # docker run \ # --rm \ # --volume $(pwd):/code \ # /code --volume /etc/passwd:/etc/passwd:ro \ # passwd --volume /etc/group:/etc/group:ro \# group --user $(id -u):$(id -g) \ # , --interactive \ # - docker-hub-utils.kolesa-team.org:5000/build/nodejs/newman:latest \ run collection.json --folder Tests -r junit,html --reporter-junit-export _out/newman-report.xml --reporter-html-export _out/newman-report.html -e _envs/qa.json -x Let's start the newman launch line separately:
run collection.json # collection.json --folder Tests # json-(collection.json) -r junit,html # ( !) 2 --reporter-junit-export _out/newman-report.xml # , --reporter-html-export _out/newman-report.html # , -e _envs/qa.json # json -x # exit-code After these manipulations, a collection of COV reports will be formed on our test backend, which will coincide numerically with the number of requests to the backend.
All that remains is to collect all these cov reports into one big fat report.
For ease of understanding, the script below will use `SCP`.
So, the collection of reports is as follows:
BRANCH_NAME=$(echo "${bamboo.currentBranch}" | sed 's|/|-|g' | sed 's@\(.*\)@\L\1@') # echo "BRANCH NAME IS $BRANCH_NAME" # ssh www-data@testing.backend.dev "php /srv/www/$BRANCH_NAME/vendor/wallend/newman-php-coverager/phpnewman --collect-reports merge /srv/www/$BRANCH_NAME/phpnewman --clover /srv/www/$BRANCH_NAME/newman/_output/clover.xml --html /srv/www/$BRANCH_NAME/newman/_output/html" # scp www-data@testing.backend.dev:/srv/www/$BRANCH_NAME/newman/_output/clover.xml ./clover.xml scp -r www-data@testing.backend.dev:/srv/www/$BRANCH_NAME/newman/_output/html ./ # ssh www-data@testing.backend.dev "rm -r /srv/www/$BRANCH_NAME/newman/_output/html && rm /srv/www/$BRANCH_NAME/phpnewman/* && rm /srv/www/$BRANCH_NAME/newman/_output/clover.xml" # In order for your reports to be available in the assembly, it is necessary to share artifacts with these reports:

then we can use these artifacts for automatic parsing and further visualization of the code coverage in our assembly. To do this, simply tick and specify the file with the xml-coverage report.
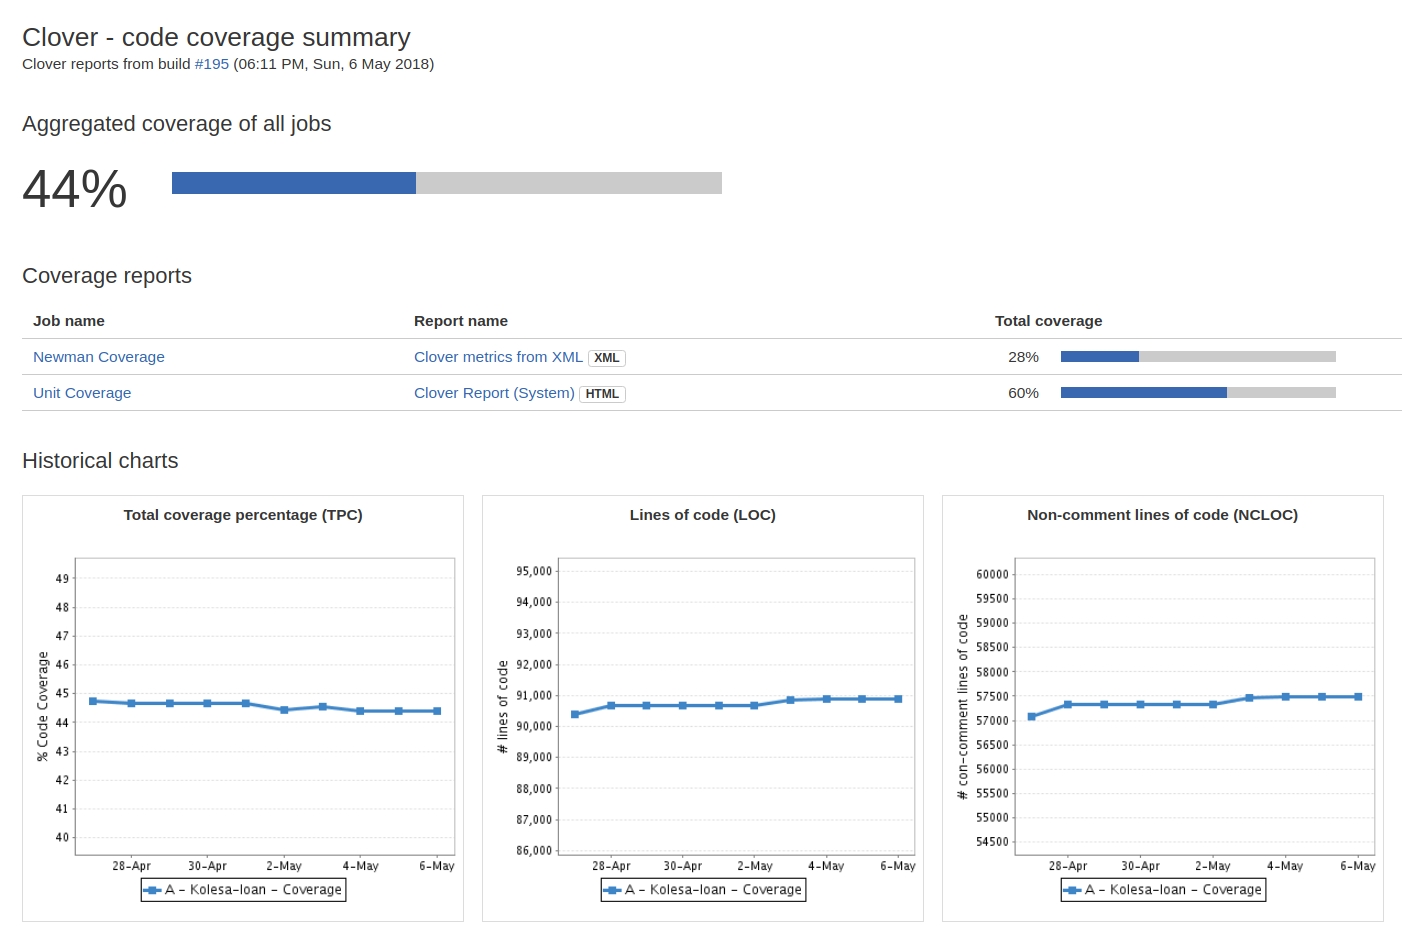
At the output, we get such beauty (In this case, similar operations have been done for the UNIT test reports).
Important!
In our project, I have divided into 2 different build plans tests without coverage measurement and tests with coverage measurement enabled. Coverage is measured only for the master branch. Runs a build plan with coverage measurement every day on a schedule. All this is done due to the fact that the tests with the included coating take much longer !
Conclusion
Summing up the work done, I want to point out just a few facts.
Fact one. There is nothing difficult in screwing a new tool you like to Continuous Intgration. There would be a desire.
Fact two. If something in the tool is not out of the box, then it is not at all necessary that it will be difficult and dreary to modify it yourself. Sometimes, if you look at it, everything is solved in a couple of dozen lines of code. Add to this a huge profit from the use of the tool when everything is working. Well, plus to all this is another reason to pump their skills.
Fact three. No one argues that newman is a panacea for all ills, and that he is the best as a tool for functional testing. However, we tried - and we liked it, especially after it was bolted to CI!
And, of course, we will be happy if our library benefits you. And if you need to modify it - feel free to contribute!
Source: https://habr.com/ru/post/353902/
All Articles