How many mathematics do you need to sign a polygon in the Yandex.Maps JS API
The Yandex.Maps JS API allows you to create various objects on the map. One of them is a polygon with which you can improve the interactivity of a custom map: select specific areas or display the location of a non-point object. For example, you can show a plan for building a new quarter or a pizza delivery zone.
Users of the Yandex.Maps API have long had a question about adding signatures over polygons. People offered tricky solutions to add a signature to an object in the right place, hide it, repaint, etc., but such solutions were difficult and inflexible.
For example, the Yandex research department came to us with a request to write a convenient tool for signing polygons after they did some research on the world map.
')
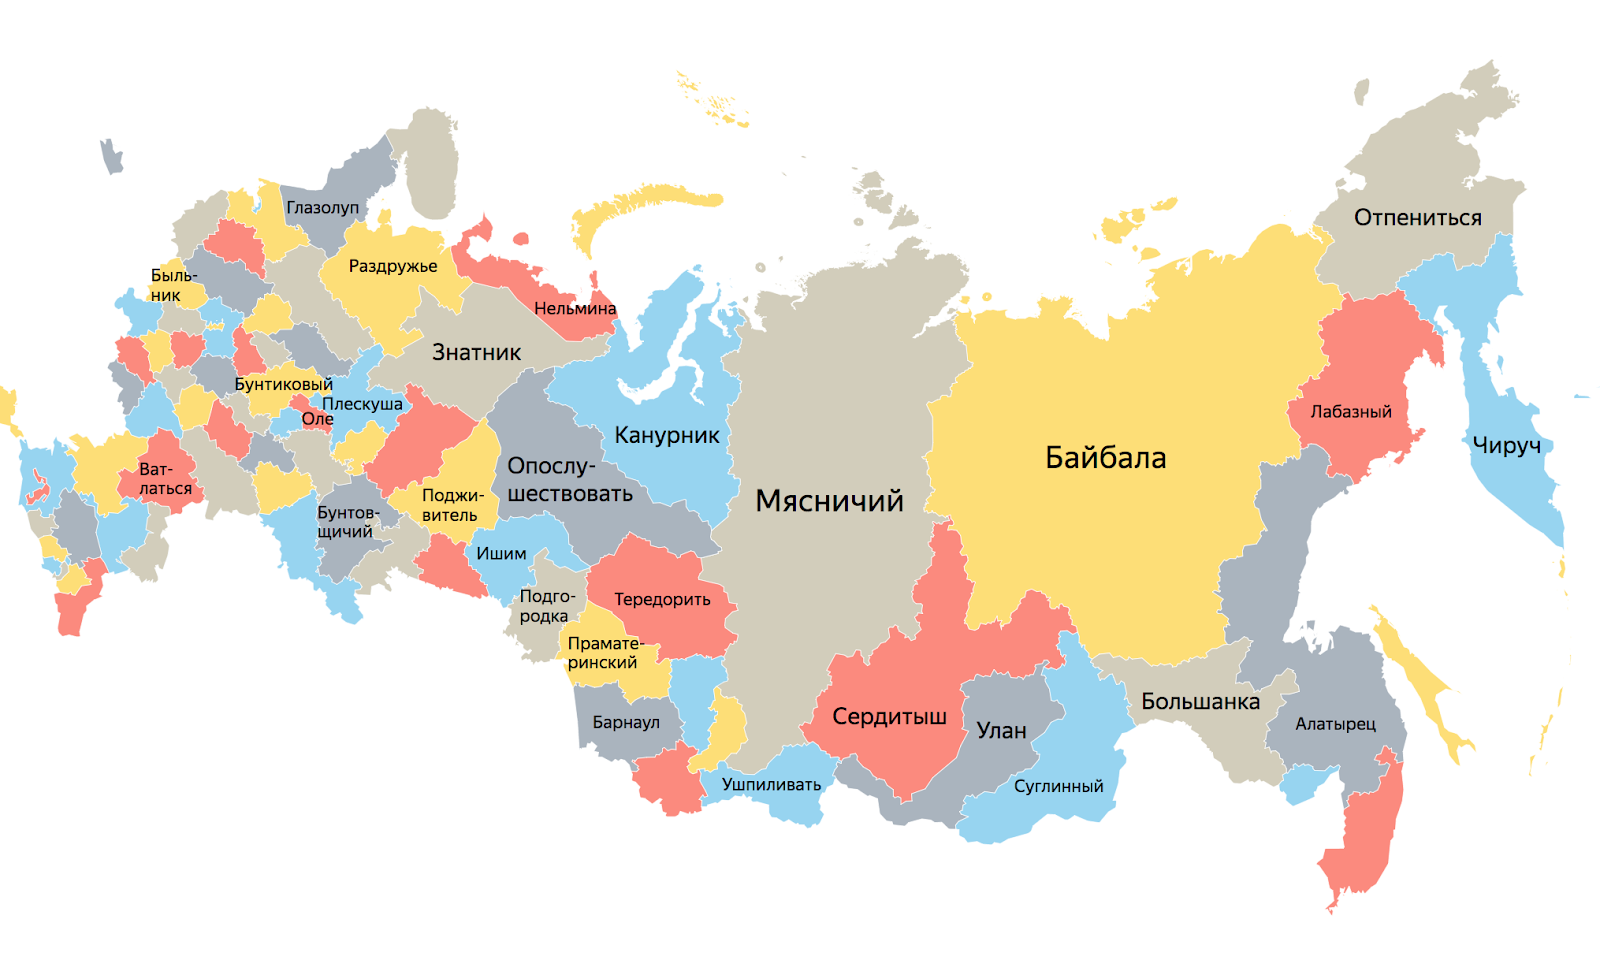
Displays of regional words from the Dahl dictionary, i.e. words that are searched much more often than the average in Russia
In fact, the task turned out to be non-trivial. Just imagine, for each polygon you need to define a well-suited center for displaying the signature, at each scale to determine whether the signature fits, whether you need to hide it on the selected zoom, change styles on each zoom, again recalculate everything. That is, to make a not very complicated infographic, you need to sweat a lot and prepare a lot of additional data.
Creating captions for polygons is one of the routine tasks. You can sit and draw everything in Photoshop, but this turns out to be not very flexible:
In image editors, it is quite difficult to make the caption interactive, it is much easier to define an array of points for polygons, a template for the future caption, and get a ready-made visualization.
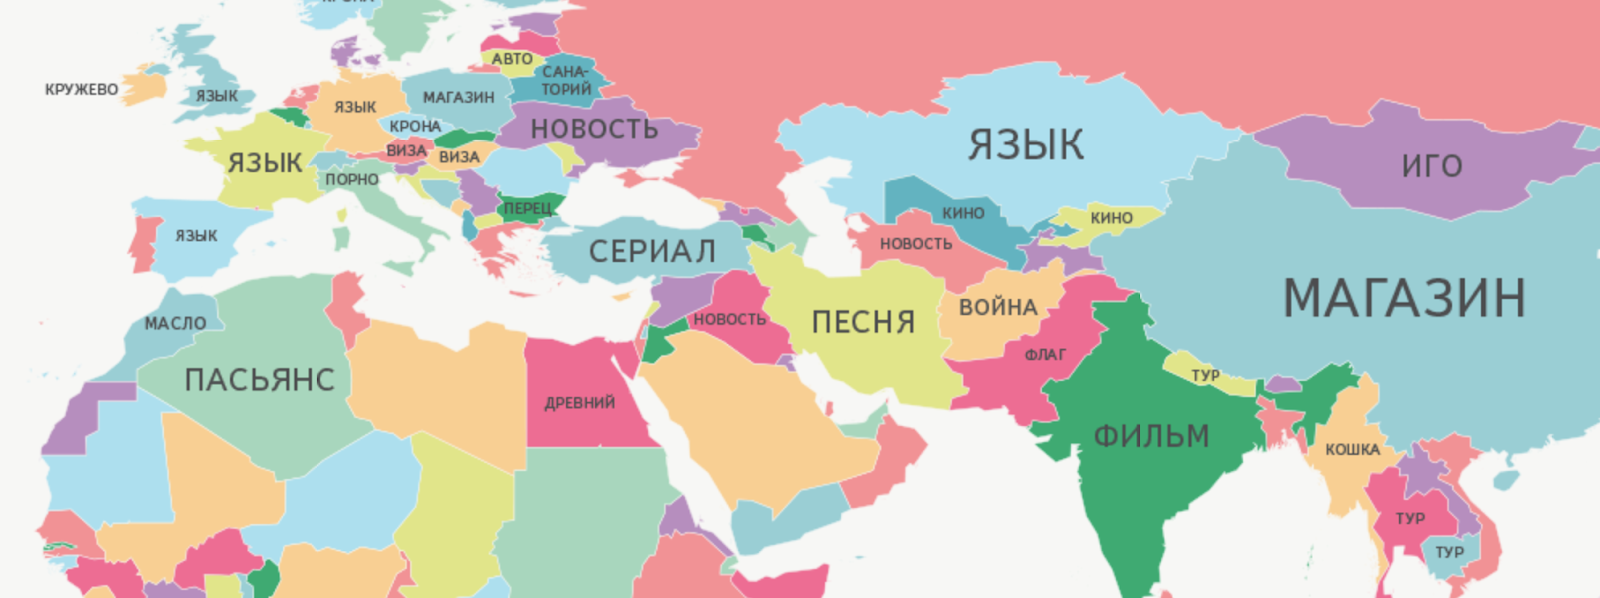 Displays the most popular words in queries about different countries
As a result, we decided to make a module that will solve the problems of users with the signing of polygons and provide freedom in its customization.
One of the main tasks facing us was to determine the most suitable center for displaying the signature, so that the user could get the finished result without additional settings.
There are several algorithms for solving the center search problem:
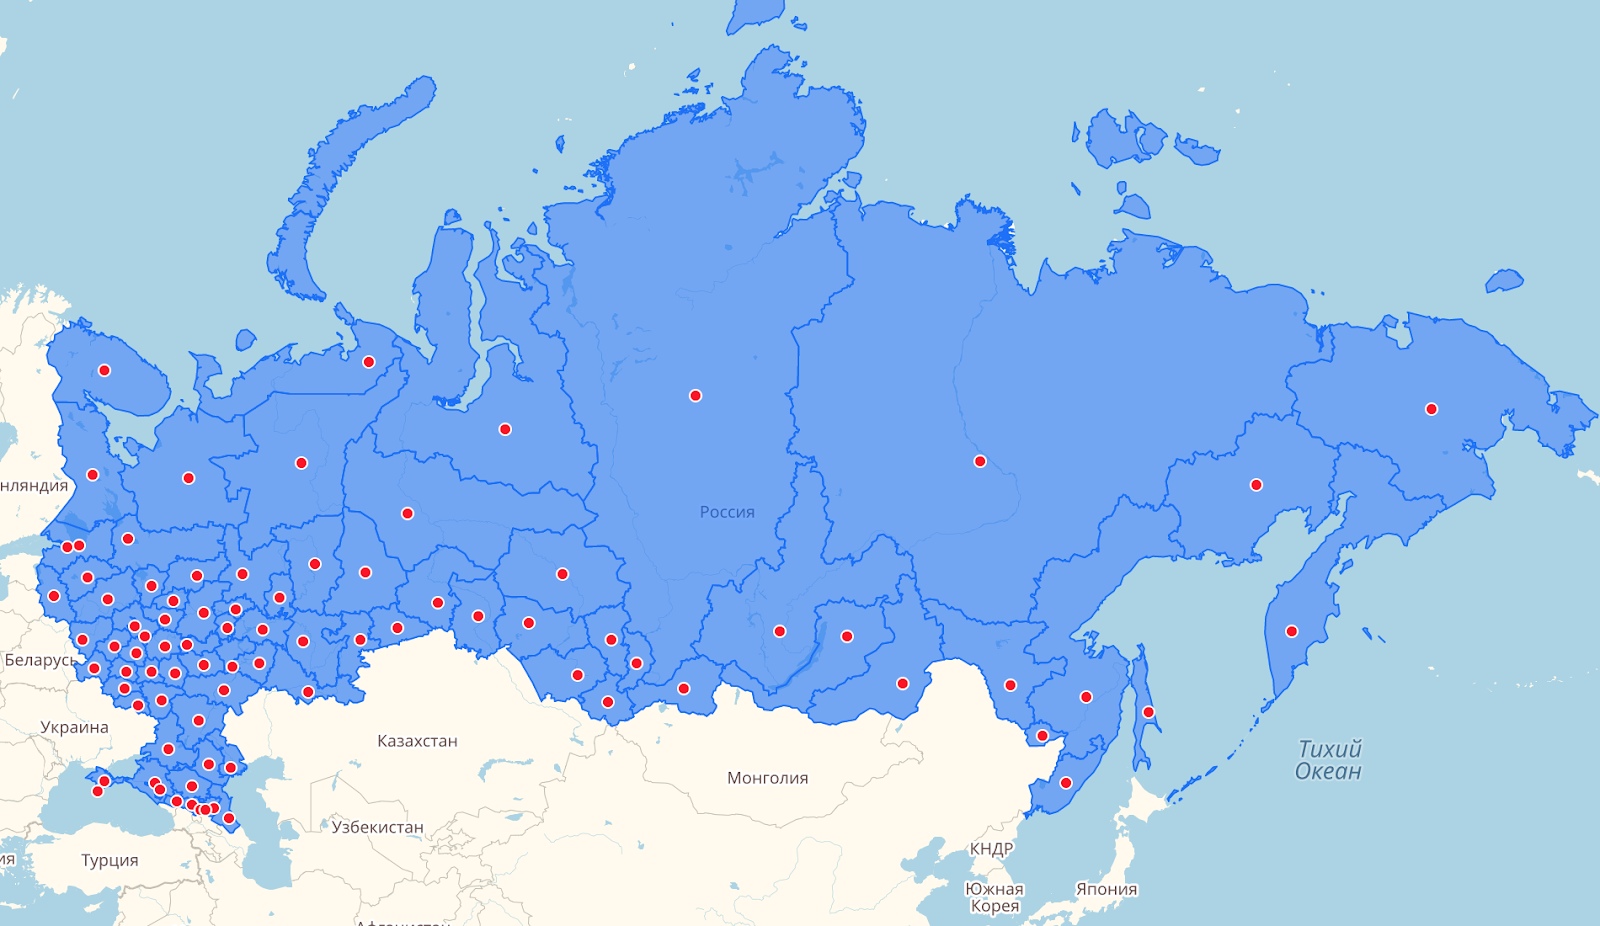
This is the very first thing that comes to mind. In mathematics and physics, the centroid (the geometric center of a flat figure) is the arithmetic average position of all points.
Implementing the search for a centroid is quite simple and the algorithm itself works quickly. It would seem that this is all, but if the figure is not a convex polygon or has a hole, then the point may fall outside the bounds of the figure or fall into the wrong place for displaying the signature.

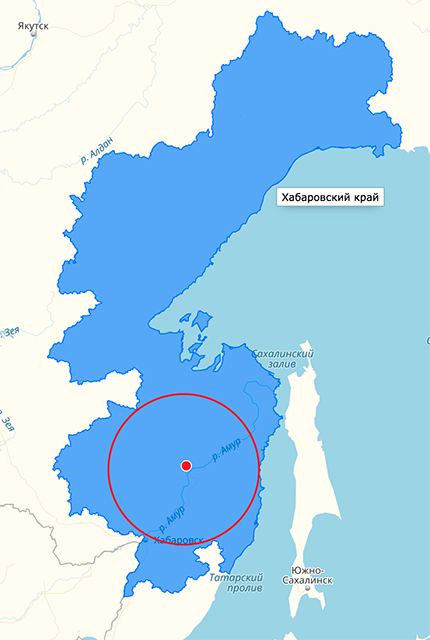
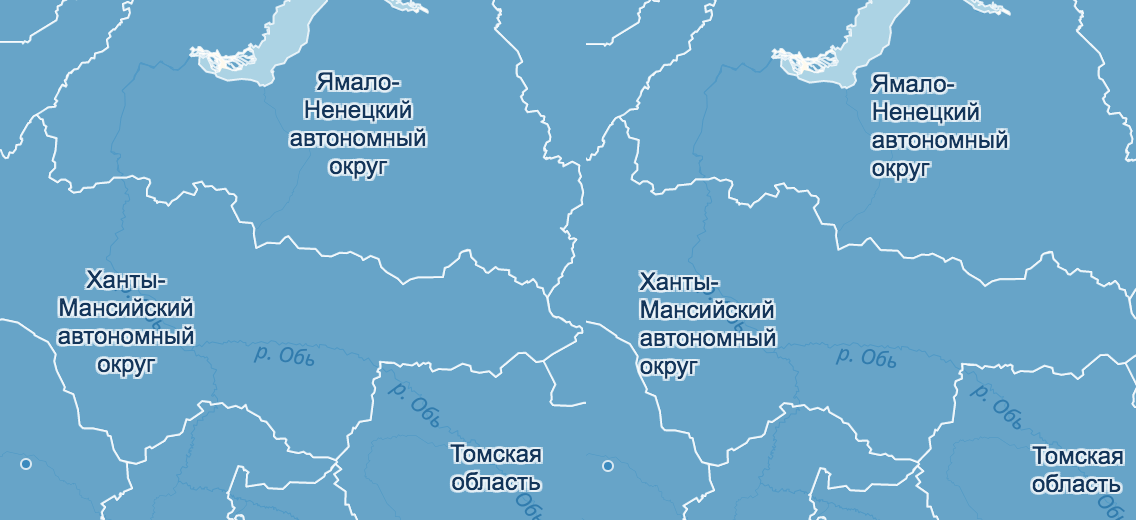
This is the result of determining the centroid. It can be seen that the dots on the Khabarovsk and Kamchatka edges were in a place unfavorable for displaying the signature.
The problem of finding such a point has already arisen for many, therefore, there are various algorithms for finding the pole of inaccessibility, but, unfortunately, the published solutions require complex implementations and work too slowly to be able to apply them in practice.
First of all, after studying the theory, always look for ready-made solutions. So, we were lucky to find interesting things from the developers of Mapbox .
They looked at several solutions for finding the inaccessibility pole, faced a number of problems and, inspired by one of the algorithms, were able to create their own, which eliminates errors, speeds up the search and increases the accuracy of obtaining high-quality results.
The algorithm is based on a quadrant tree . That is, for the polygon under study, a region (quadrant) is built into which the polygon fits completely. Further, this area is divided into four equal parts, and so on recursively with each quadrant.
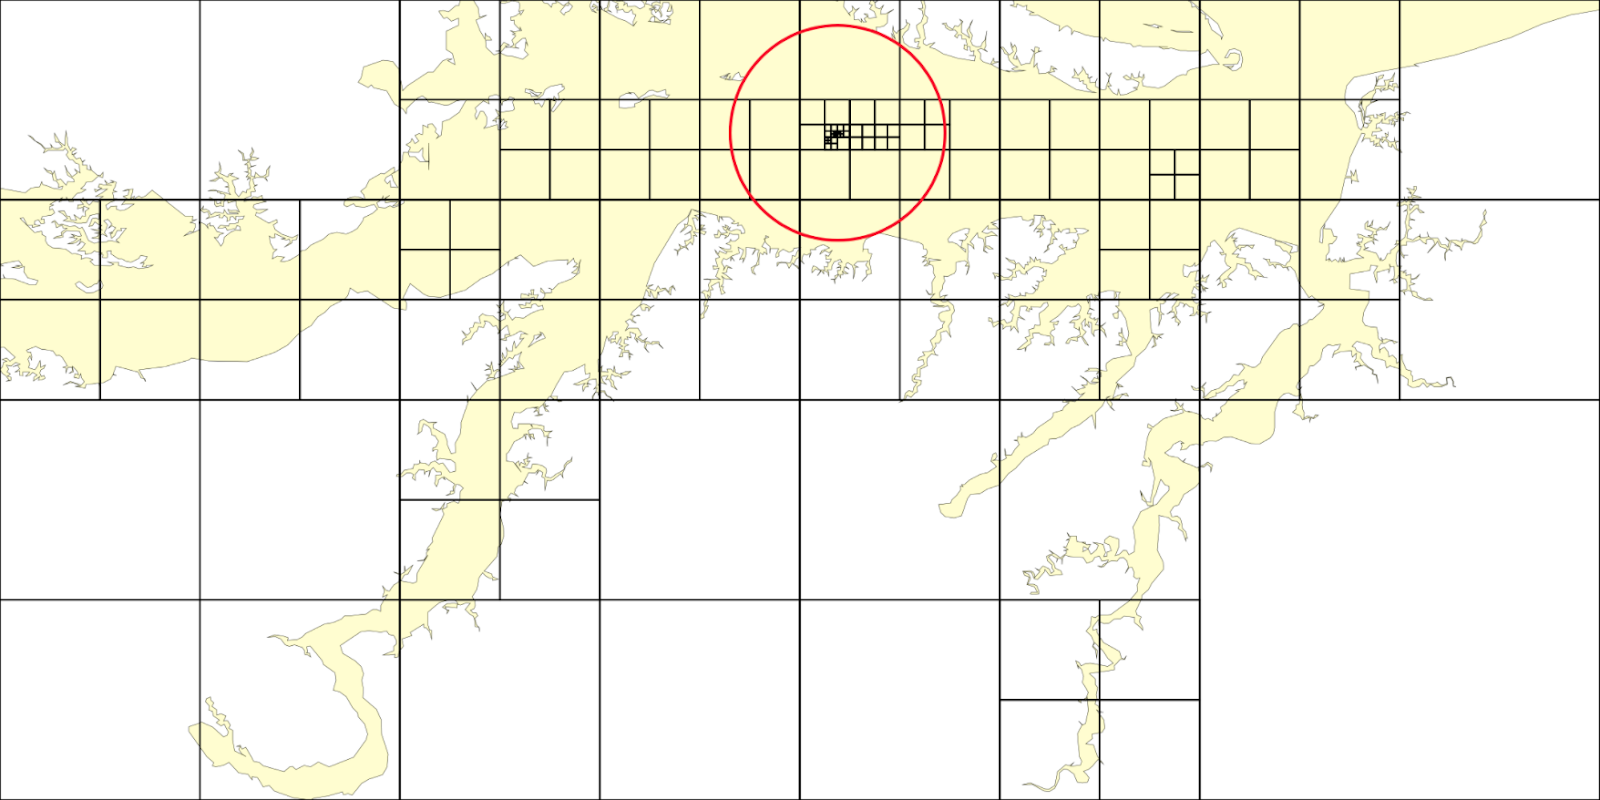
The study continues only in satisfying conditional cells. A cell is considered suitable if the sum of the distance from its center to the edge of the polygon and the radius of the circle describing the cell are more than previous calculations in quadrants.

Inside this module, an algorithm for finding the centroid is also used as a fallback: if the found inaccessibility pole does not satisfy the required accuracy.
Details are described here .
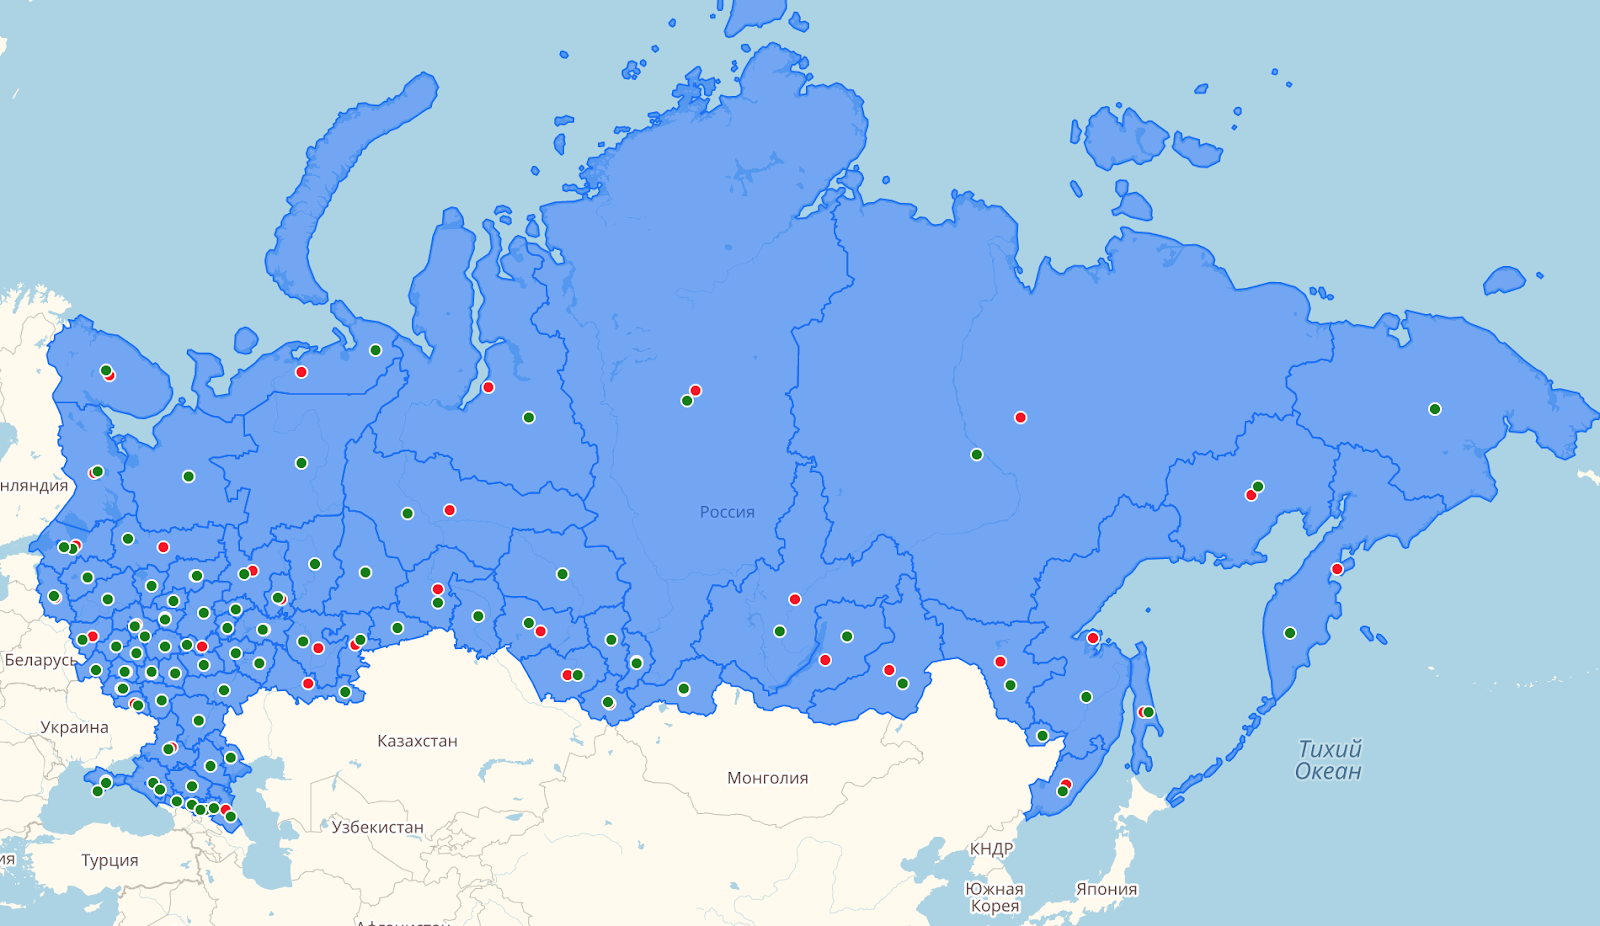
You can see how the accuracy of the algorithms differs: the “center” on the “problem” polygons began to fit much better for the location of the signature:
After choosing the algorithm for finding the “center” of the polygon, we began work on the signing module.
The signing of the polygon occurs in several stages.
The input to the module is a collection in which the vertices of the polygons are located for signing.
First, the coordinates of each polygon are passed through the module for finding the inaccessibility pole, and the coordinates of the point where the caption will be located are obtained at the output. This center module will apply to all zooms if there was no center redefinition using a special option. The polygon center values are cached along with the signature capacity status so as not to calculate them more than once for the same zoom.
Next, we are faced with the task of understanding whether a signature fits into a polygon.
The module takes out the signature template and on its basis creates an HtmlElement .

Next, the module waits for the loading of pictures from the tags, if any, and with the help of getBoundingClientRect () the dimensions of this signature are calculated. Unfortunately, there are no methods that could tell about the size of an element not inserted into the DOM. Therefore, you must first render the signature. And in order to avoid “blinking” (showing and hiding the signature) when getting the size, it is drawn in a special container that is hidden from the users eyes.
Since the module supports various options, such as center offset or display error, they are first applied and then checked to see if the signature fits.

The center of the signature is represented in the form of geographical coordinates, and the size of the element of the signature in pixels, therefore, the translation of the geographical coordinates of the center.
Further, the width and height of the element are deposited from this center, the error in the calculation is applied, if it has been specified.
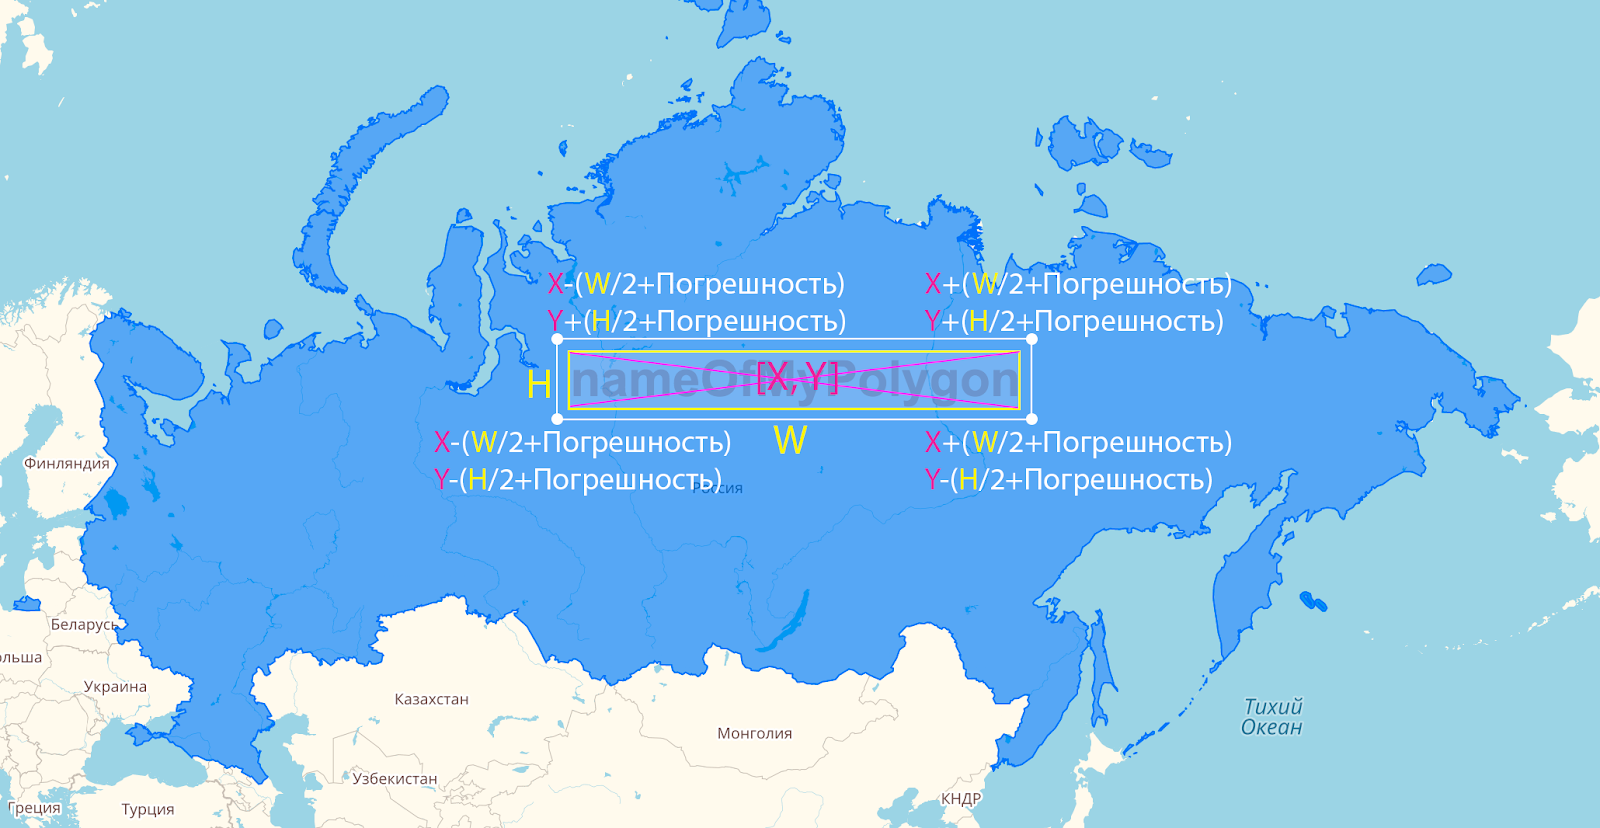
The obtained coordinates are converted to geographic and it is checked whether the signature fits in the polygon.
All this happens for each zoom and for two types of signatures, which are described in more detail in the next section.
Looking at the most unpleasant problems faced by webmasters, we made a number of options that will help you conveniently customize the module for your personal needs.
One of the important tasks was to make a convenient way to insert a layout into a polygon. Using a special option, you can set the string as an html layout that supports the basic syntax of the Twig / Django Templates template languages.
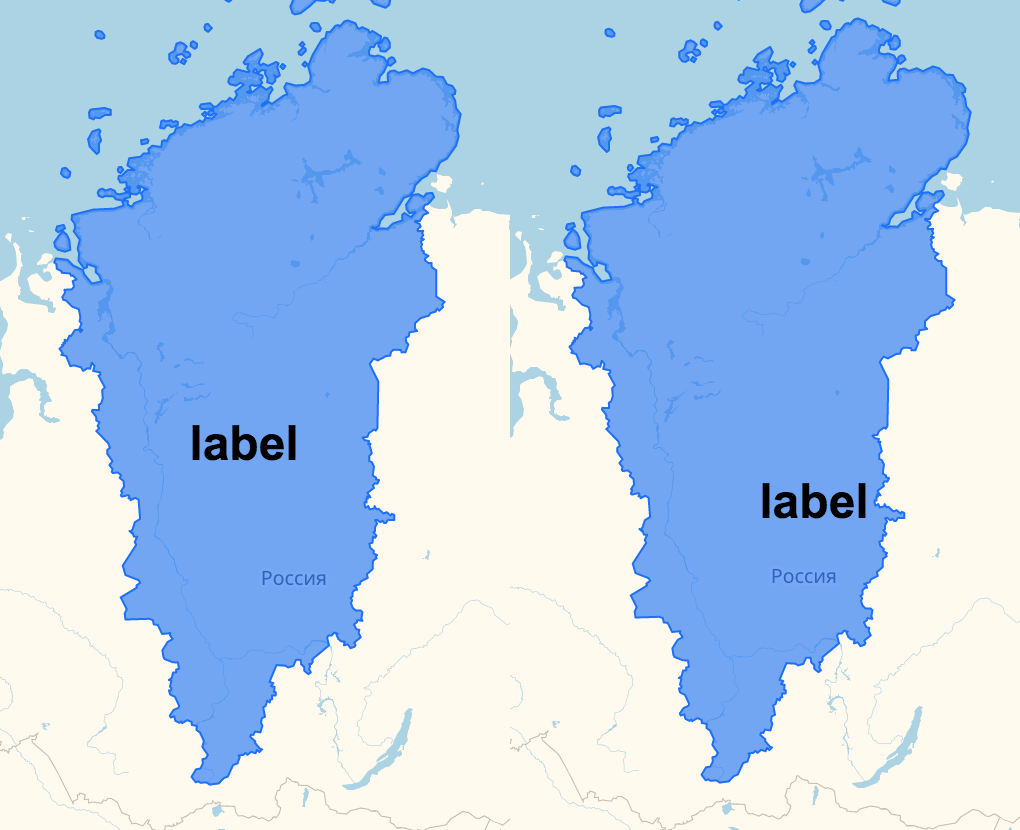
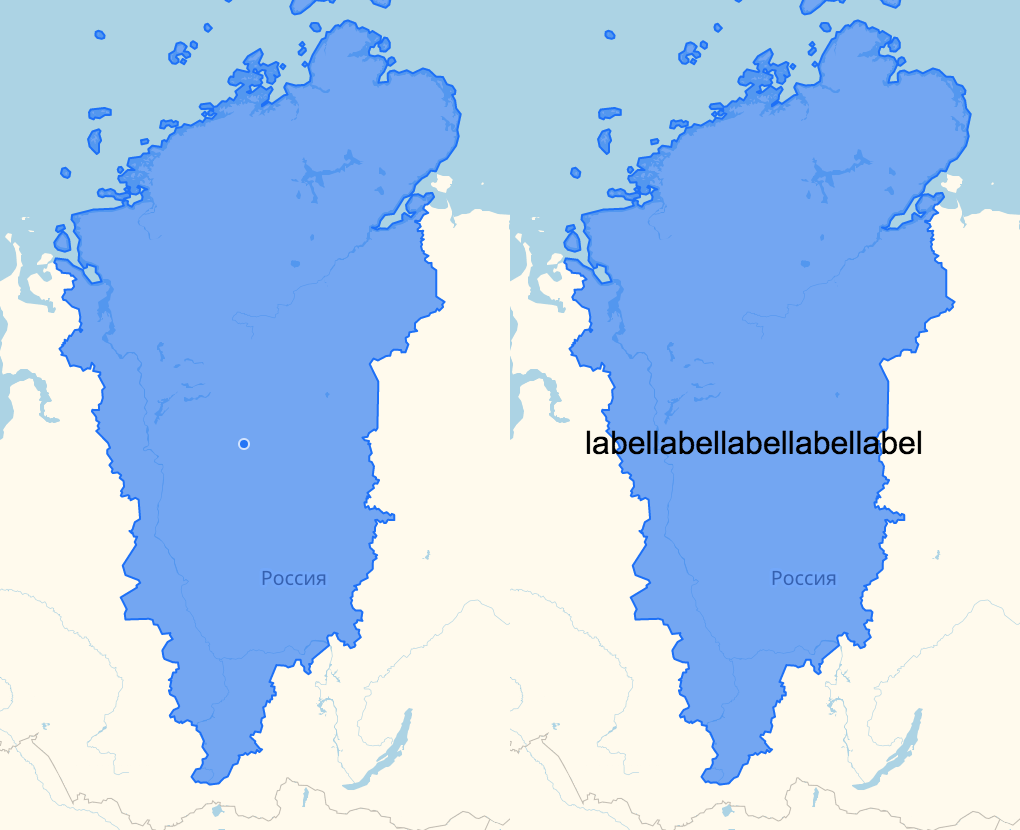
Each polygon has two types of captions: main and small.
This is done in order to display a small copy of the main signature, in case it does not fit.
Each signature belongs to one polygon through which the signature parameters are controlled.
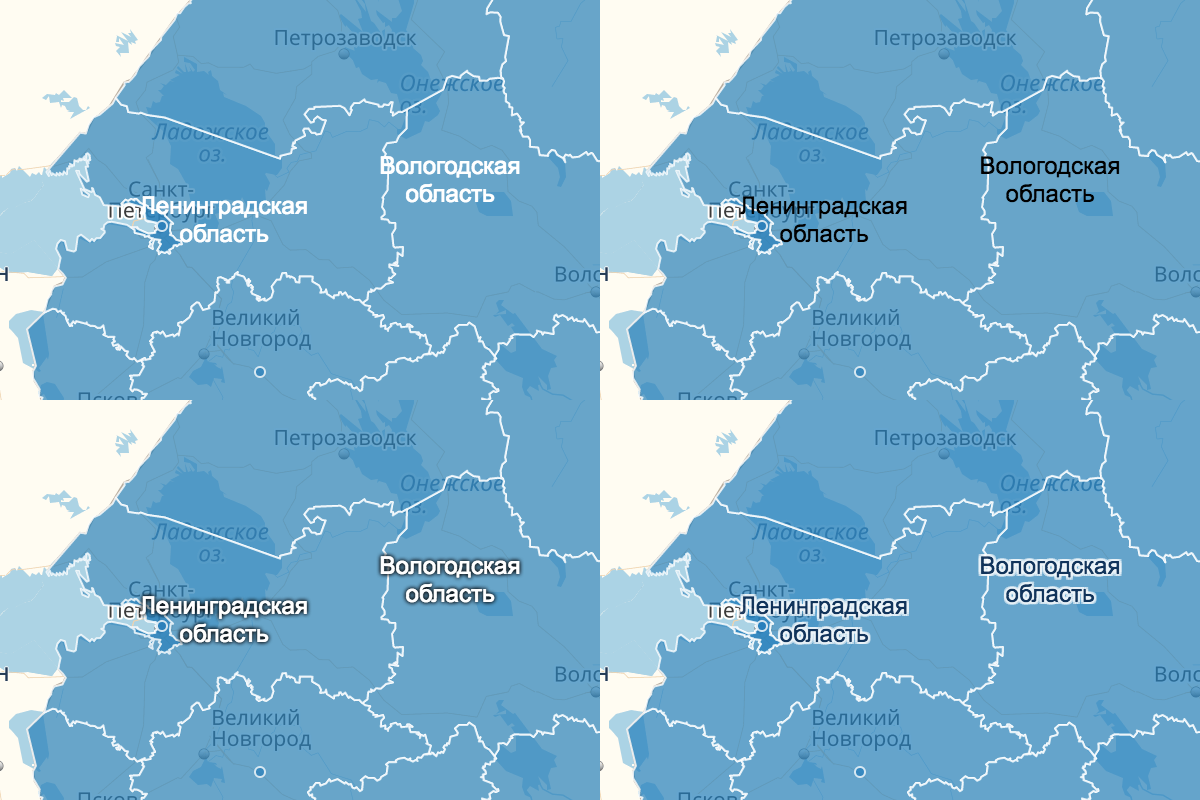
In order to be able to manage the signature parameters on different scales, additional options were introduced. If the user is not satisfied with the standard definition of the center of the signature, then you can set the necessary coordinates in which you want to see the signature.
On the left - the automatic center, on the right - set to the coordinates [72, 92]
You can also set indents from the position of the caption and the display error, the value of which means how much the caption is allowed to go beyond the boundaries of the polygon.
30px indent at the top and left
Accuracy 25px
The case did not go without styles, it is possible to change the size and color of the text or set the value of the class attribute.
All of these signature options can be configured for each zoom or set one value for all scales.
All this is necessary so that the user can customize the behavior of the module.
Here is a complete list of possible options.
Events did not go unnoticed. All events that occurred with the signature (click, hover ...) are forwarded to the parent polygon and correspond to the basic events in the API, you just need to add a “label” before them.
To quickly change the visibility of the signature, a special state was created, which each polygon has. Having received it through the copy of the module, we can change the type of the signature, or hide it altogether. For example, you want the polygons, in which the main signature does not fit, when you hover over its smaller copy, it appears.
Also through this state you can get the current type of the displayed signature or the coordinates in which the signature is located.
Often, the text is one of the main parts of the signature, so we paid special attention to it.
In order for the signature to be well read when crossing with the borders of the regions and on translucent polygons, it was necessary to separate it from the background by a stroke. Made two standard styles that will fit in most cases:
Images on top: plain text, no stroke
Images below: two standard module styles
Multiline captions are not very well readable when aligning text to the left, so the central alignment was set to default.
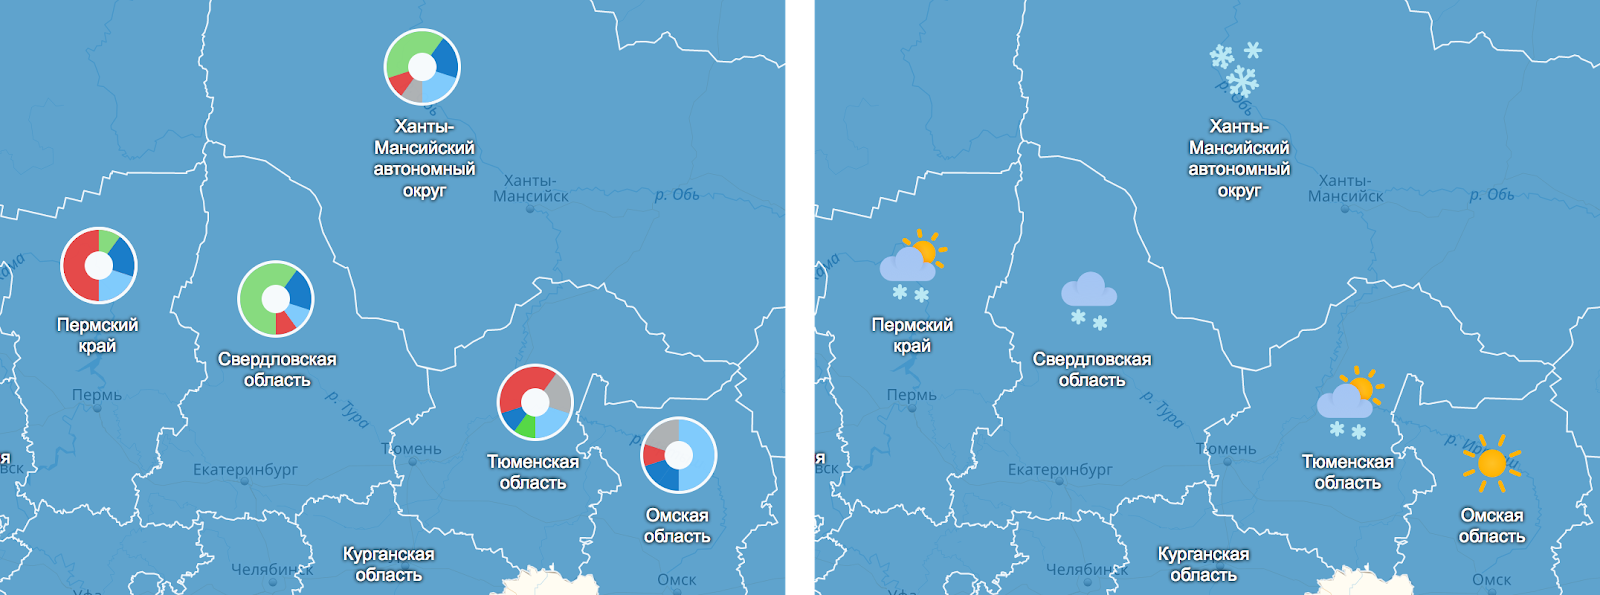
Since the signature layout can be set as arbitrary html, it will not be difficult to add images to the captions - this is useful, for example, to create a weather forecast on a map or to visualize data with diagrams.
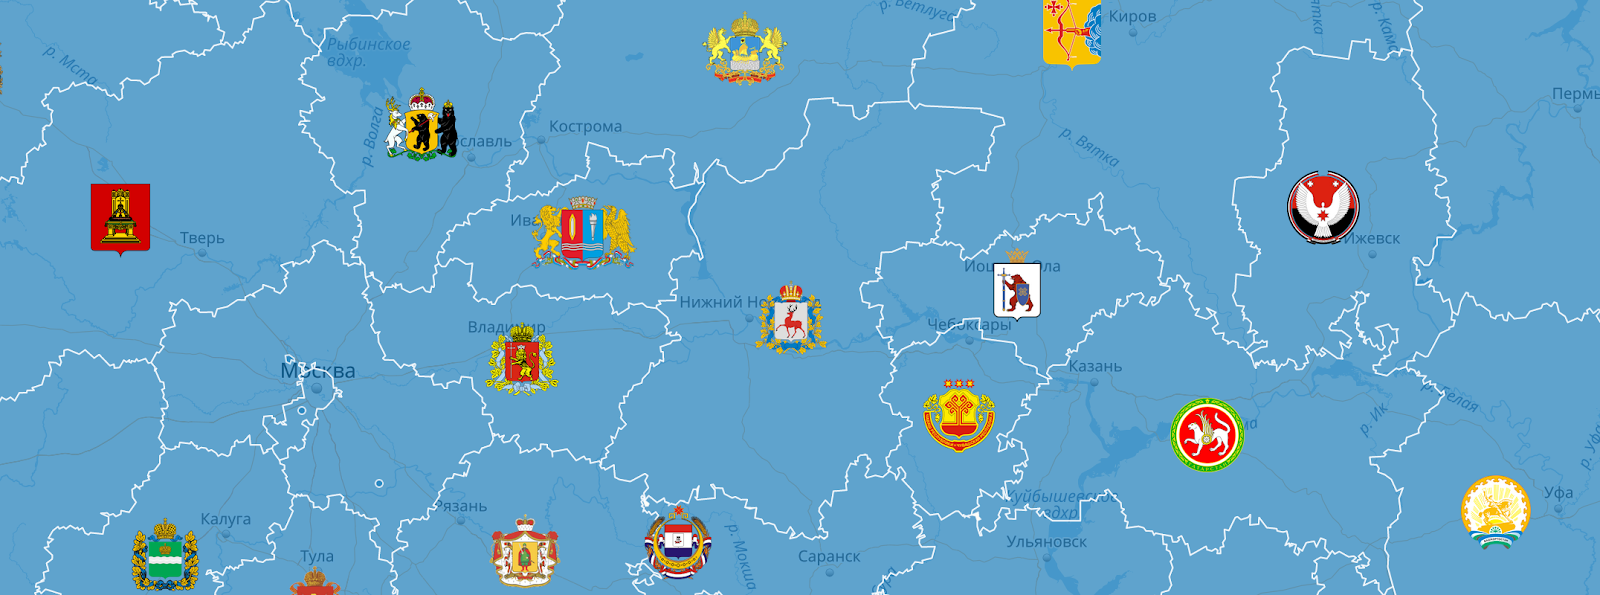
A flexible layout of signatures is useful for infographics, for example, to show the flags of countries of the world or the arms of regions.
We decided to dwell on basic usage scenarios that could satisfy the basic needs for convenient signature creation, but if you have any wishes for the module, we will definitely consider them.
To start using the module, you must complete a couple of items from the instructions in this repository .
jsfiddle.net/51qtdx3a/5
We always welcome suggestions and feedback, for all questions please contact us in technical support or leave suggestions in the comments. We hope that our tools will make the webmasters life a little easier and open up new horizons for you in data visualization on the map.
Users of the Yandex.Maps API have long had a question about adding signatures over polygons. People offered tricky solutions to add a signature to an object in the right place, hide it, repaint, etc., but such solutions were difficult and inflexible.
For example, the Yandex research department came to us with a request to write a convenient tool for signing polygons after they did some research on the world map.
')
Displays of regional words from the Dahl dictionary, i.e. words that are searched much more often than the average in Russia
In fact, the task turned out to be non-trivial. Just imagine, for each polygon you need to define a well-suited center for displaying the signature, at each scale to determine whether the signature fits, whether you need to hide it on the selected zoom, change styles on each zoom, again recalculate everything. That is, to make a not very complicated infographic, you need to sweat a lot and prepare a lot of additional data.
Creating captions for polygons is one of the routine tasks. You can sit and draw everything in Photoshop, but this turns out to be not very flexible:
- Any changes to the content (values in signatures, color) will lead to a change in all signatures, it will be necessary to draw each anew.
- Full interaction with the map includes changing scales for which it is not always possible to place readable text on a map in a polygon. The size of a polygon may not be enough to fully display the caption on a certain scale, therefore it is necessary for each to draw captions of different sizes.
In image editors, it is quite difficult to make the caption interactive, it is much easier to define an array of points for polygons, a template for the future caption, and get a ready-made visualization.
Displays the most popular words in queries about different countriesAs a result, we decided to make a module that will solve the problems of users with the signing of polygons and provide freedom in its customization.
Selection of the algorithm for determining the appropriate center for the signature
One of the main tasks facing us was to determine the most suitable center for displaying the signature, so that the user could get the finished result without additional settings.
There are several algorithms for solving the center search problem:
Calculate the position of the centroid
This is the very first thing that comes to mind. In mathematics and physics, the centroid (the geometric center of a flat figure) is the arithmetic average position of all points.
Implementing the search for a centroid is quite simple and the algorithm itself works quickly. It would seem that this is all, but if the figure is not a convex polygon or has a hole, then the point may fall outside the bounds of the figure or fall into the wrong place for displaying the signature.
This is the result of determining the centroid. It can be seen that the dots on the Khabarovsk and Kamchatka edges were in a place unfavorable for displaying the signature.
Pole of unavailability or point of the largest circle entered
The problem of finding such a point has already arisen for many, therefore, there are various algorithms for finding the pole of inaccessibility, but, unfortunately, the published solutions require complex implementations and work too slowly to be able to apply them in practice.
First of all, after studying the theory, always look for ready-made solutions. So, we were lucky to find interesting things from the developers of Mapbox .
They looked at several solutions for finding the inaccessibility pole, faced a number of problems and, inspired by one of the algorithms, were able to create their own, which eliminates errors, speeds up the search and increases the accuracy of obtaining high-quality results.
How is the search
The algorithm is based on a quadrant tree . That is, for the polygon under study, a region (quadrant) is built into which the polygon fits completely. Further, this area is divided into four equal parts, and so on recursively with each quadrant.
The study continues only in satisfying conditional cells. A cell is considered suitable if the sum of the distance from its center to the edge of the polygon and the radius of the circle describing the cell are more than previous calculations in quadrants.
Inside this module, an algorithm for finding the centroid is also used as a fallback: if the found inaccessibility pole does not satisfy the required accuracy.
Details are described here .
The result of the algorithm
You can see how the accuracy of the algorithms differs: the “center” on the “problem” polygons began to fit much better for the location of the signature:
- Red dots - centroid
- Greens - Pole of Inaccessibility
After choosing the algorithm for finding the “center” of the polygon, we began work on the signing module.
Algorithm of the module
The signing of the polygon occurs in several stages.
The input to the module is a collection in which the vertices of the polygons are located for signing.
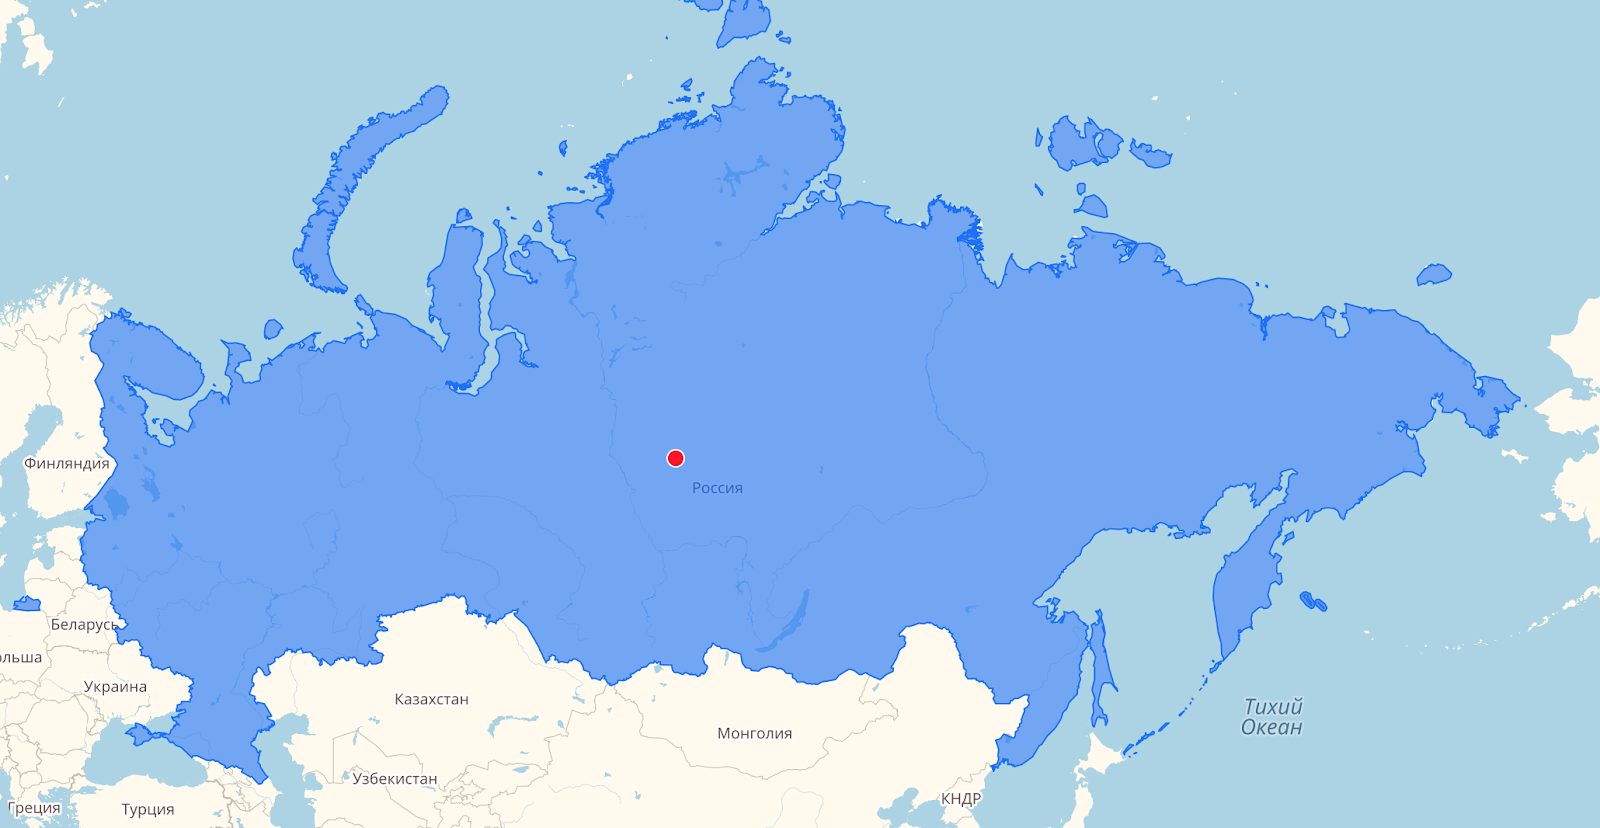
First, the coordinates of each polygon are passed through the module for finding the inaccessibility pole, and the coordinates of the point where the caption will be located are obtained at the output. This center module will apply to all zooms if there was no center redefinition using a special option. The polygon center values are cached along with the signature capacity status so as not to calculate them more than once for the same zoom.
Next, we are faced with the task of understanding whether a signature fits into a polygon.
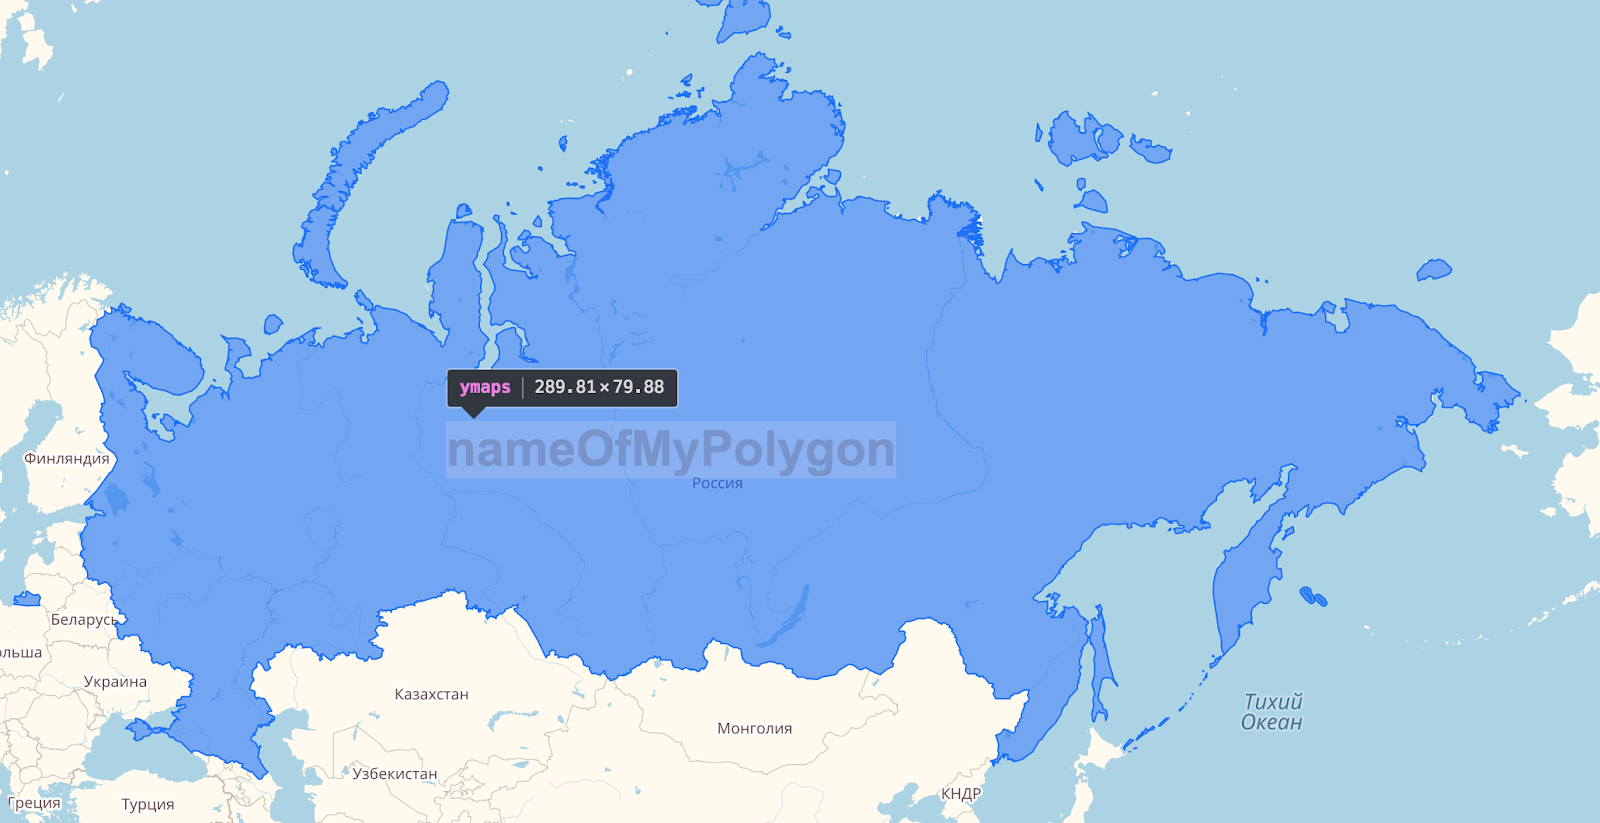
The module takes out the signature template and on its basis creates an HtmlElement .
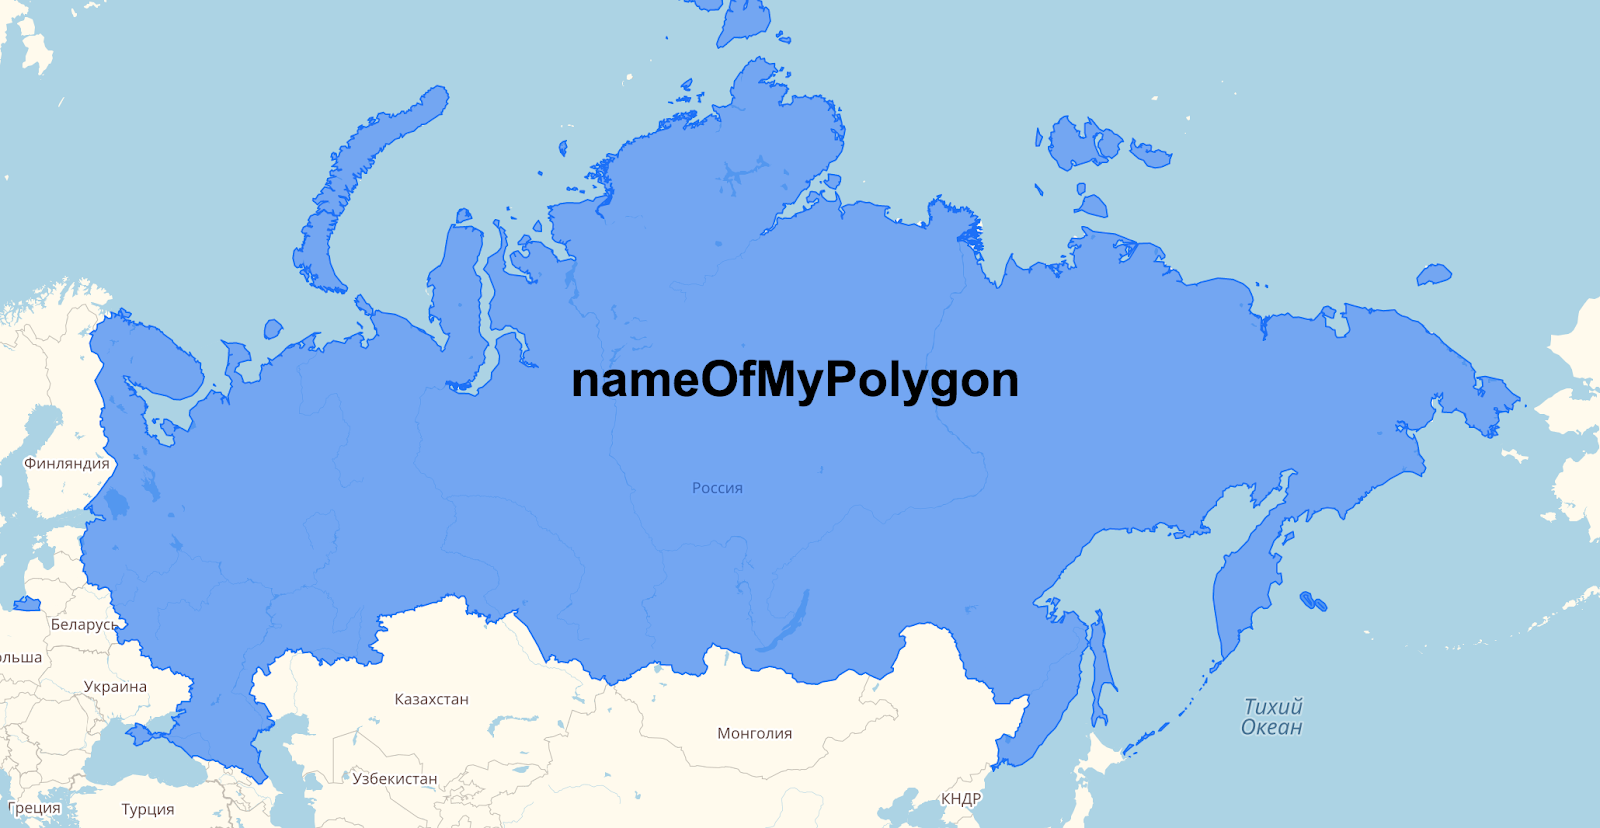
objectManager.add({ ... options: { labelLayout: '<h1>{{properties.name}}</h1>' }, properties: { name: 'nameOfMyPolygon' } }); Next, the module waits for the loading of pictures from the tags, if any, and with the help of getBoundingClientRect () the dimensions of this signature are calculated. Unfortunately, there are no methods that could tell about the size of an element not inserted into the DOM. Therefore, you must first render the signature. And in order to avoid “blinking” (showing and hiding the signature) when getting the size, it is drawn in a special container that is hidden from the users eyes.
Since the module supports various options, such as center offset or display error, they are first applied and then checked to see if the signature fits.
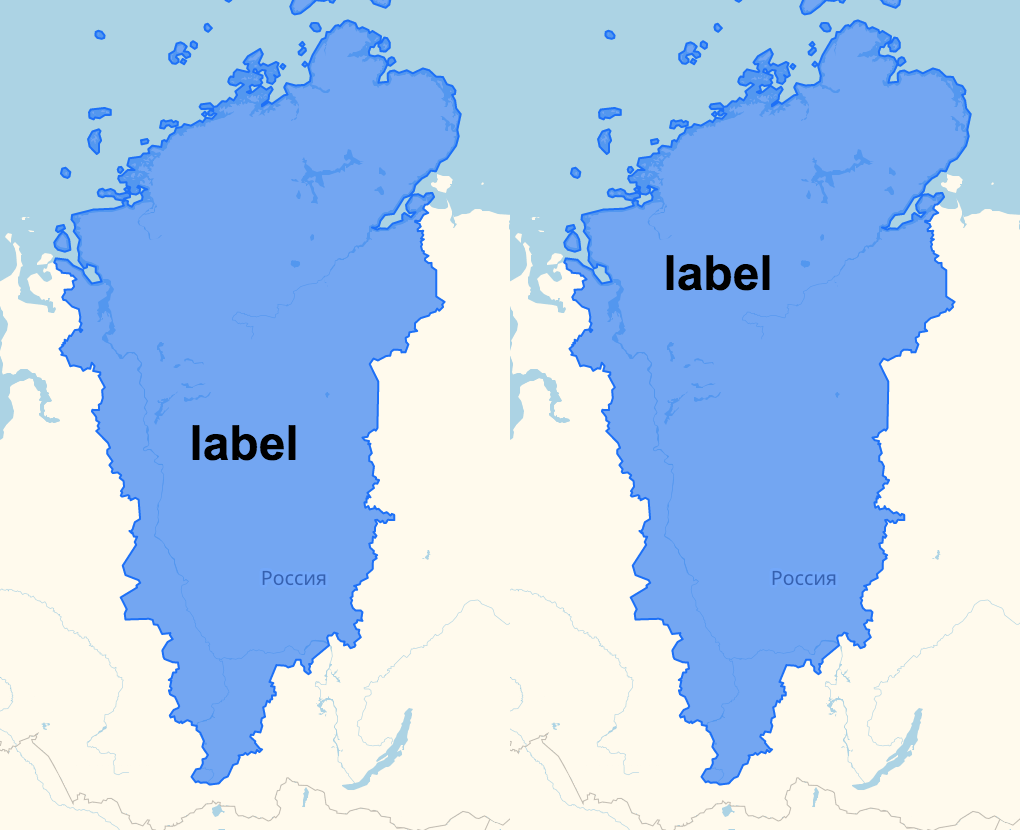
objectManager.add({ ... options: { labelLayout: '<h1>{{properties.name}}</h1>', labelOffset: [80, -50] }, properties: { name: 'nameOfMyPolygon' } }); The center of the signature is represented in the form of geographical coordinates, and the size of the element of the signature in pixels, therefore, the translation of the geographical coordinates of the center.
Further, the width and height of the element are deposited from this center, the error in the calculation is applied, if it has been specified.
objectManager.add({ ... options: { labelLayout: '<h1>{{properties.name}}</h1>', labelOffset: [80, -50], labelPermissibleInaccuracyOfVisibility: 10 }, properties: { name: 'nameOfMyPolygon' } }); The obtained coordinates are converted to geographic and it is checked whether the signature fits in the polygon.
All this happens for each zoom and for two types of signatures, which are described in more detail in the next section.
Module features
Looking at the most unpleasant problems faced by webmasters, we made a number of options that will help you conveniently customize the module for your personal needs.
One of the important tasks was to make a convenient way to insert a layout into a polygon. Using a special option, you can set the string as an html layout that supports the basic syntax of the Twig / Django Templates template languages.
Each polygon has two types of captions: main and small.
This is done in order to display a small copy of the main signature, in case it does not fit.
Each signature belongs to one polygon through which the signature parameters are controlled.
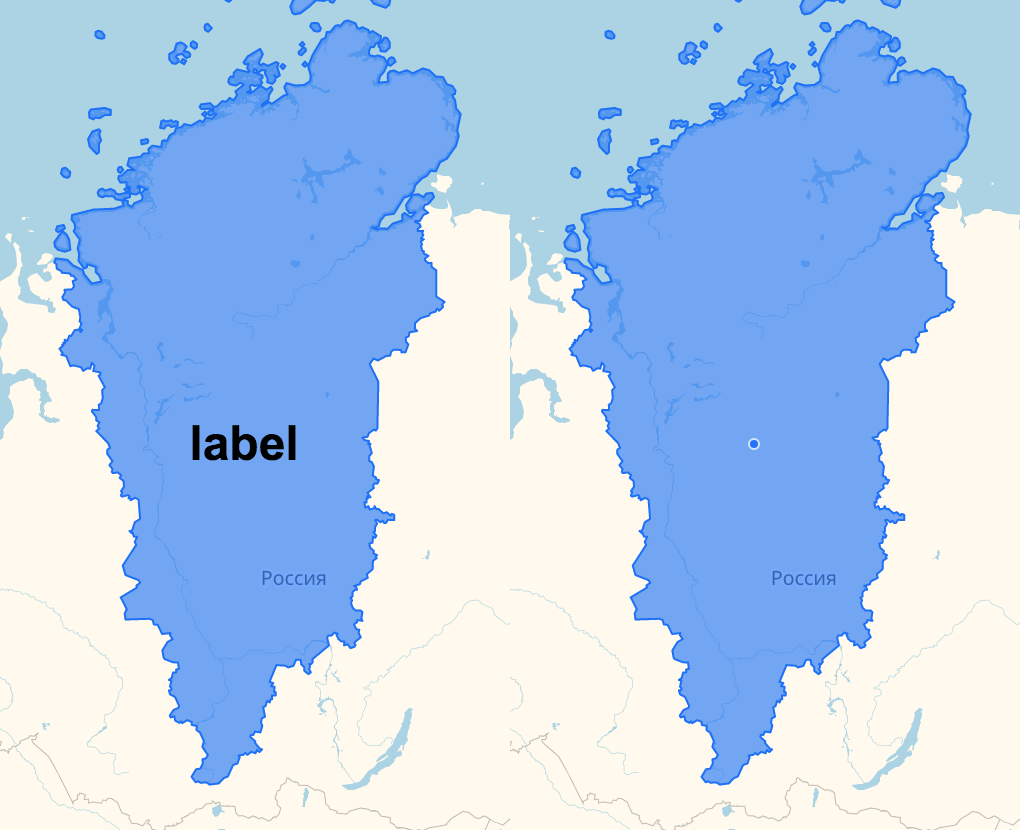
In order to be able to manage the signature parameters on different scales, additional options were introduced. If the user is not satisfied with the standard definition of the center of the signature, then you can set the necessary coordinates in which you want to see the signature.
On the left - the automatic center, on the right - set to the coordinates [72, 92]
You can also set indents from the position of the caption and the display error, the value of which means how much the caption is allowed to go beyond the boundaries of the polygon.
30px indent at the top and left
Accuracy 25px
The case did not go without styles, it is possible to change the size and color of the text or set the value of the class attribute.
All of these signature options can be configured for each zoom or set one value for all scales.
All this is necessary so that the user can customize the behavior of the module.
Here is a complete list of possible options.
Events did not go unnoticed. All events that occurred with the signature (click, hover ...) are forwarded to the parent polygon and correspond to the basic events in the API, you just need to add a “label” before them.
To quickly change the visibility of the signature, a special state was created, which each polygon has. Having received it through the copy of the module, we can change the type of the signature, or hide it altogether. For example, you want the polygons, in which the main signature does not fit, when you hover over its smaller copy, it appears.
Also through this state you can get the current type of the displayed signature or the coordinates in which the signature is located.
Design and solution interface
Often, the text is one of the main parts of the signature, so we paid special attention to it.
In order for the signature to be well read when crossing with the borders of the regions and on translucent polygons, it was necessary to separate it from the background by a stroke. Made two standard styles that will fit in most cases:
Images on top: plain text, no stroke
Images below: two standard module styles
Multiline captions are not very well readable when aligning text to the left, so the central alignment was set to default.
Since the signature layout can be set as arbitrary html, it will not be difficult to add images to the captions - this is useful, for example, to create a weather forecast on a map or to visualize data with diagrams.
A flexible layout of signatures is useful for infographics, for example, to show the flags of countries of the world or the arms of regions.
So, what we have
- The module can take any kind of signature.
- The module itself can determine the appropriate place for the signature and allows the user to control its position with the help of indents or exact coordinates.
- The caption can be customized style, color and size of the text.
- The user can change the visibility of signatures.
- The user can set custom parameters for all acceptable scales, as well as for individual ones.
Conclusion
We decided to dwell on basic usage scenarios that could satisfy the basic needs for convenient signature creation, but if you have any wishes for the module, we will definitely consider them.
For those who are interested
To start using the module, you must complete a couple of items from the instructions in this repository .
Example
jsfiddle.net/51qtdx3a/5
We always welcome suggestions and feedback, for all questions please contact us in technical support or leave suggestions in the comments. We hope that our tools will make the webmasters life a little easier and open up new horizons for you in data visualization on the map.
Source: https://habr.com/ru/post/353498/
All Articles