How to upload custom log to Splunk + logs for Fortinet
How much data do we generate using information systems every day? Great amount! But do we know all the possibilities for working with such data? Definitely not! In this article, we will describe what types of data we can load for further operational analysis in Splunk, and also show how to connect the loading of Fortinet logs and logs of non-standard structure, which must be divided into fields manually.
Splunk can index data from various sources that can store logs both locally on the same machine with the Splunk indexer and on the remote device. To collect data from remote machines, a special agent is installed on them - Splunk Universal Forwarder, which will send data to the indexer.
Splunk offer many ready-made applications and add-ons with pre-configured settings to load a specific type of data, for example, an Add-on is for data generated by Windows, Linux, Cisco, CheckPoint, and so on. In total, over 800 add-ons are currently created, which can be found on the SplunkBase website.
')
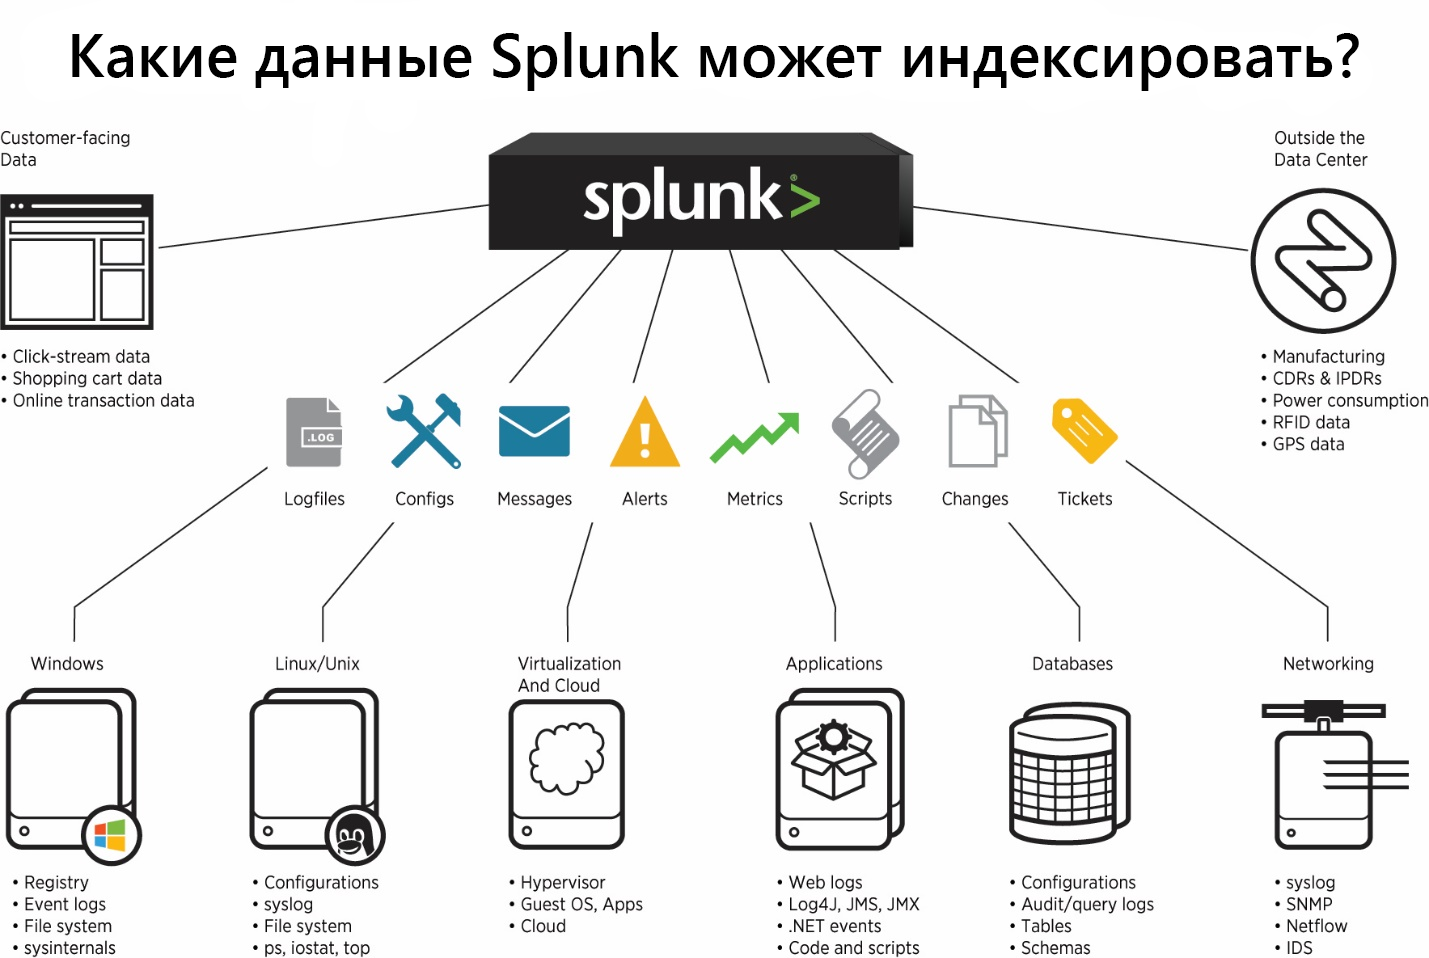
All incoming data can be divided into several groups according to their sources:
Files and directories
Most data goes to Splunk directly from files and directories. You just need to specify the path to the directory from which you want to take data and after that it will monitor it continuously and as new data becomes available, it will be immediately uploaded to Splunk. Further in this article we will show how this is implemented.
Network events
Splunk can also index data from any network port, such as remote syslog data or other applications that transmit data on a TCP or UDP port. We will look at this type of data source in the example of Fortinet.
Windows sources
Splunk allows you to customize the loading of many different data
Windows, such as event log, registry, WMI, Active Directory, and performance monitoring data. In more detail about loading data from Windows to Splunk, we wrote in a previous article. (link)
Other data sources
Many tools have already been implemented that can load almost any of your data, but if even none of them do not suit you, you can create your own scripts or modules, which we will discuss with one of the following articles.
In this section, we will discuss how to implement the loading of Fortinet logs.
1. First you need to download the Add-on from the SplunkBase website at this link .
2. Next, you need to install it on your Splunk-indexer (Apps - Manage Apps - Install app from file) .
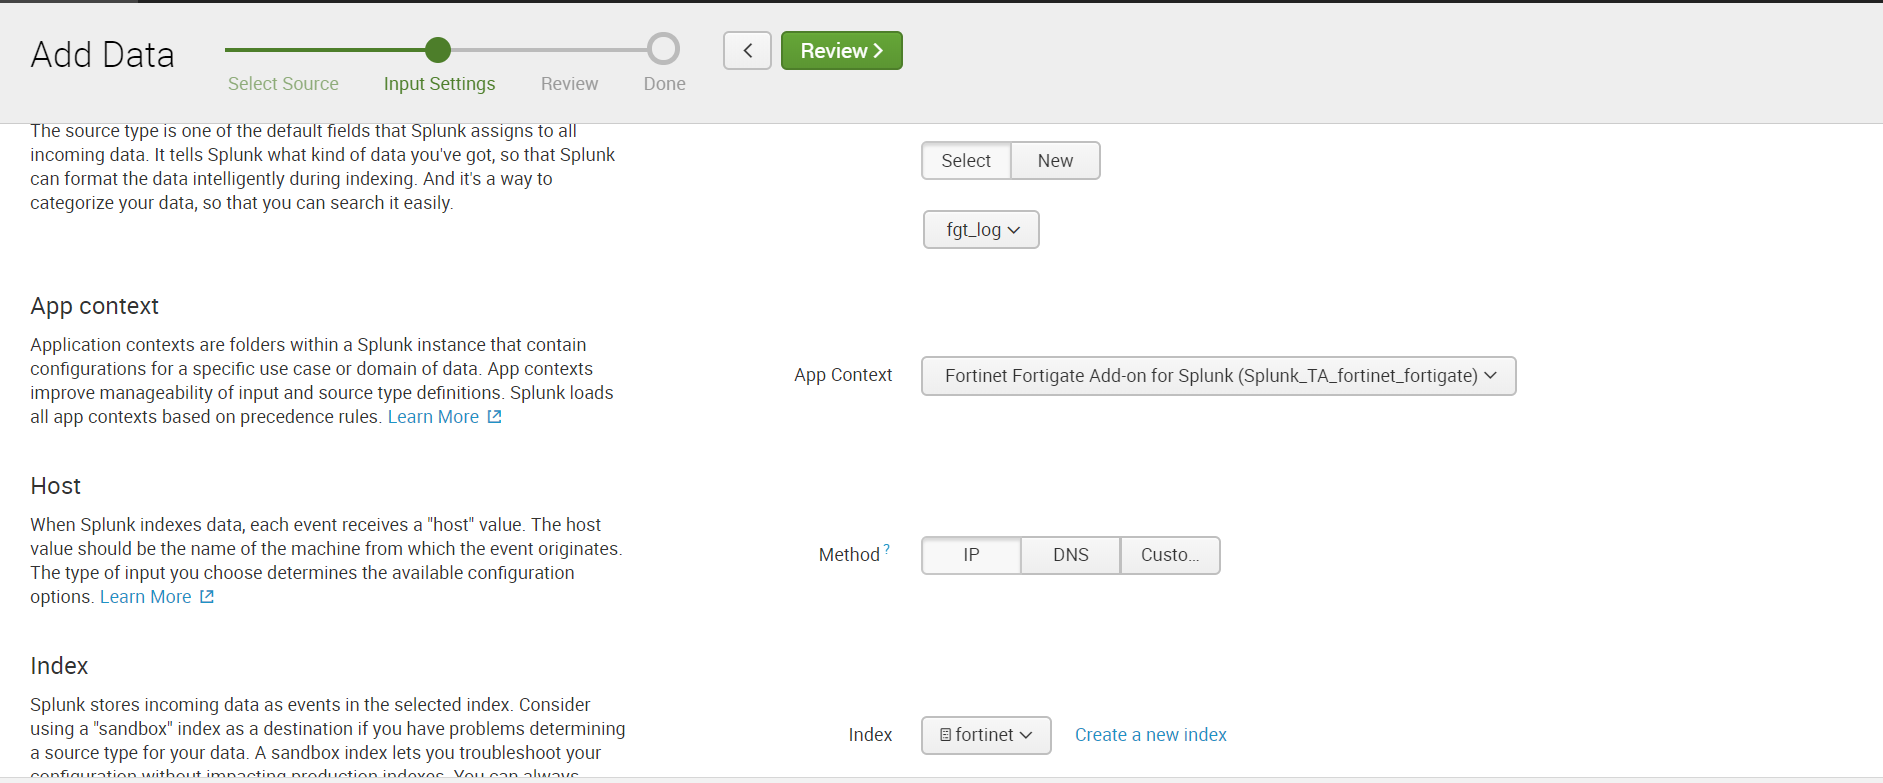
3. Then we configure the reception of data on the UDP port. To do this, go through: Settings - Data Inputs - UDP - New. Specify the port, the default is 514 port.

We select Sourcetype: fgt_log, also we select a necessary index or we create new.
4. Set up sending data via UDP in Fortinet itself, indicating the same port as in Splunk.
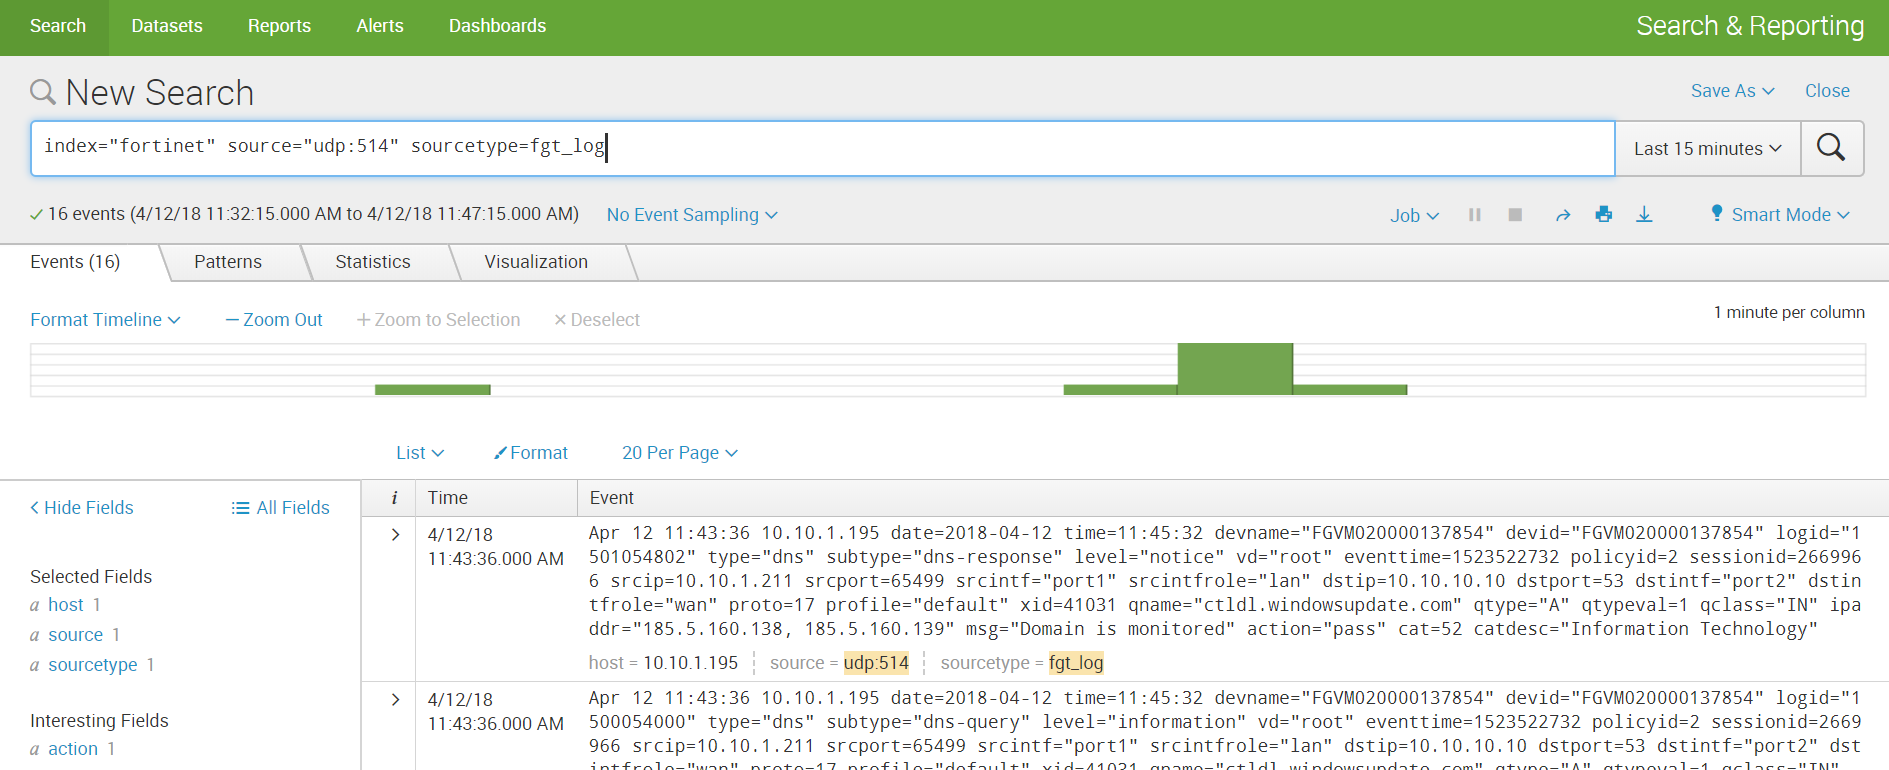
5. Get data and build analytics.

By a non-standard log, we mean a log that has an unknown sourcetype for Splunk, and therefore does not have pre-written field parsing rules. In order to get the field values, it will be necessary to first perform several simple manipulations.
Using this log as an example, in addition to parsing, we will show how to implement loading data from directories. There are two development scenarios that depend on where the data lies: on the local indexer machine or on the remote machine.
If your data is stored on your Splunk local machine, the download is very easy:
Settings - Add data - Monitor - Files & Directories

Select the desired directory, if necessary, we can register Whitelist or Blacklist.
Choose an index or create a new one, the rest by default.
If the directory in which the necessary data is stored is located on the remote machine, then the algorithm of action will be somewhat different. To collect data, we need an agent on the target machine (Splunk Universal Forwarder), configured by Forwarder Management on the Splunk indexer, the sendtoindexer application, and an application that tells which directories we will be viewing.
We described in detail how to install the agent and set up data collection from the remote machine in the previous article , so we will not repeat it and assume that you already have all those settings.
Create a special application that will respond to the fact that the agent sends data from the specified directories.

The application is automatically saved in the ..splunk / etc / apps folder, you need to transfer it to the ..splunk / etc / deployment-apps folder.
In the folder ..monitor / local you need to place the configuration file inputs.conf , in which we will indicate which folders should be sent.
We want to view the test folder in the root directory.
More information about the inputs.conf files can be found on the official website .
Add an application to the Server Class that is related to the target machine. How and why this should be done, we said in the previous article .
We recall that this can be done by following the following path: Settings - Forwarder Management.
In order for the data to be loaded it is necessary that there exists an index that was specified in inputs.conf, if not, then create a new one.
After loading we received data not divided into fields. In order to select the fields, go to the Extract Fields menu ( All Fields - Extract New Fields )

You can parse the fields using the built-in toolkit, which, based on regular expressions, selects the fields that you specify. Or you can write a regular expression yourself if the result of automatic work does not suit you.
Step 1. Select the field

Step 2. Choose the separation method
We will use regular expressions.

Step 3. Select the values that will apply to one field and call it.

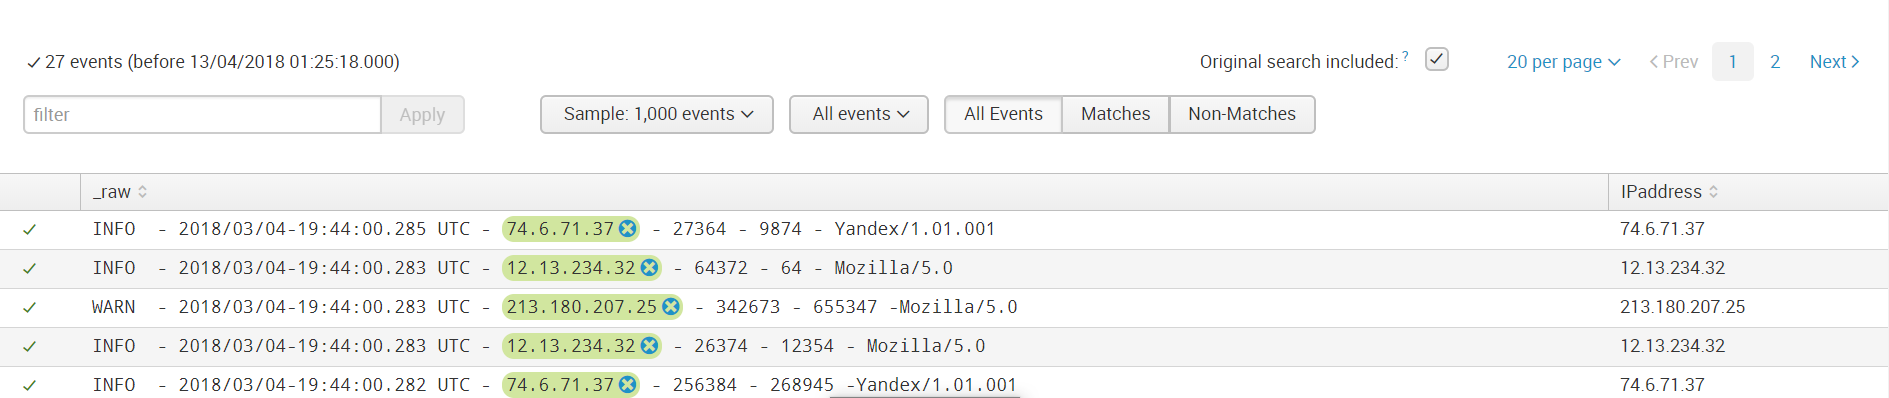
Step 4. Check whether the field is selected in other events correctly; if not, add this event to the selected fields.

Step 5. Select the field in all events of different structure.
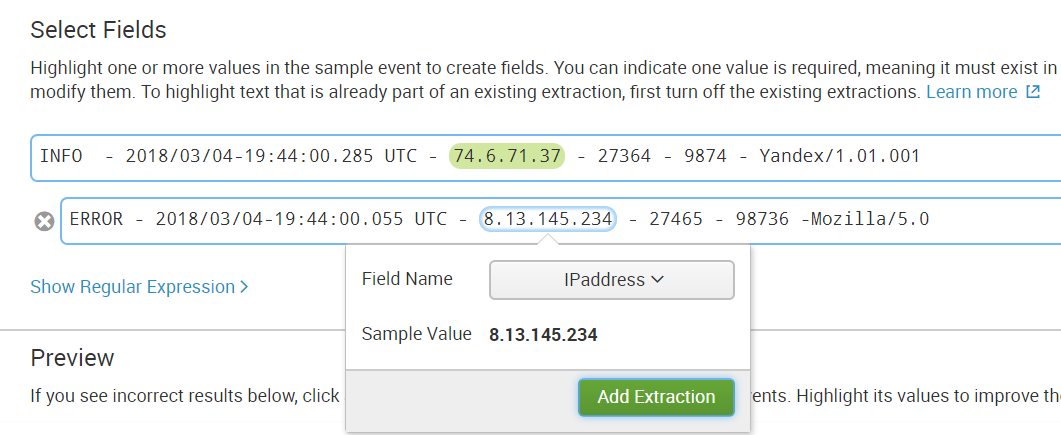
Step 6. We check if something extra is selected if, for example, there is no such field in the event.
Then we save the field and now when loading data with the same sourcetype to them such a rule will be applied to highlight the field value.
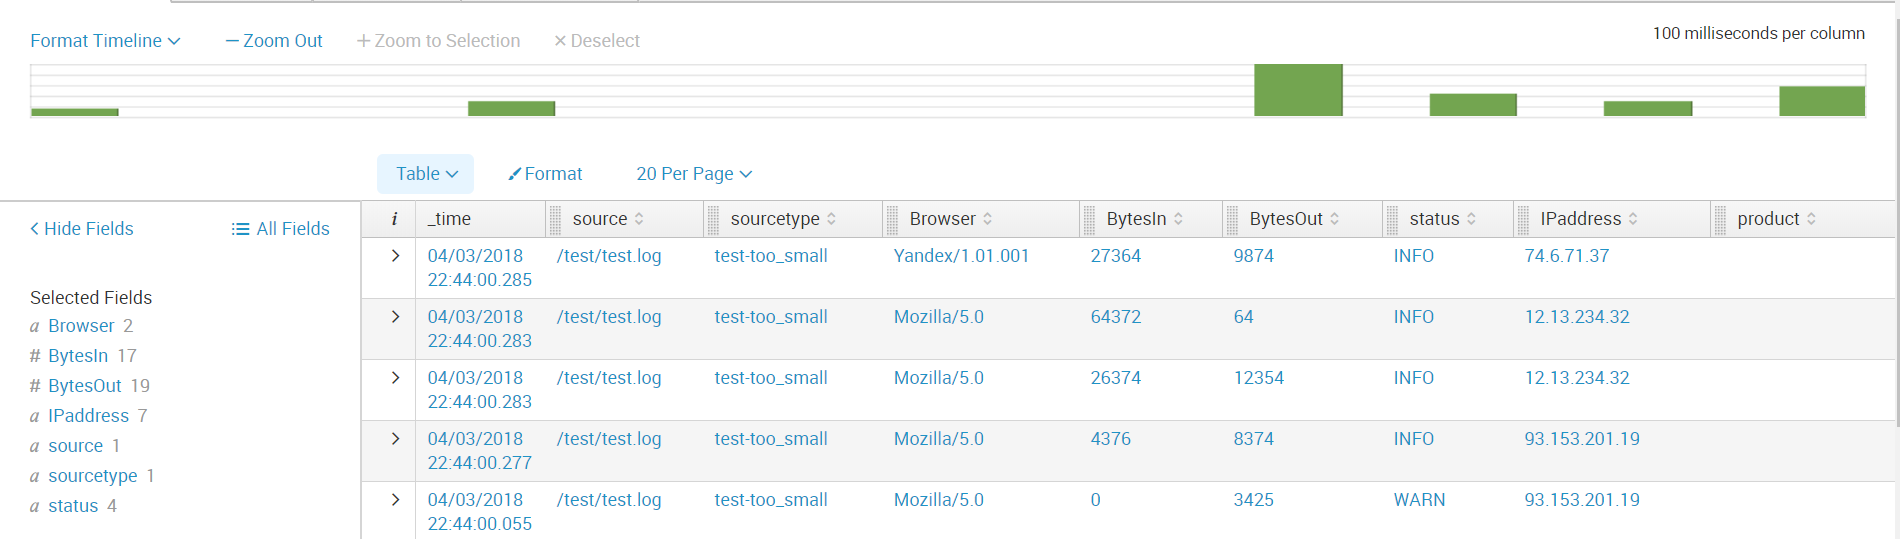
Next we create all the fields we need. And now the data is ready for further analysis.
Thus, we told you from which sources you can upload data to Splunk, showed you how to set up receiving from network ports, as well as how to load and parse a non-standard log.
We hope that this information will be useful for you.
We are happy to answer all your questions and comments on this topic. Also, if you are interested in something specifically in this area, or in the field of machine data analysis in general, we are ready to refine the existing solutions for you, for your specific task. To do this, you can write about it in the comments or simply send us a request through the form on our website .
We are the official Premier Splunk Partner .

On June 28, 2018, “ Splunk Getting Started ” will be taught in Moscow , where in 6 hours the participants will receive a theoretical base and practical skills for working in Splunk. Learn more about learning and register at this link .
Splunk can index data from various sources that can store logs both locally on the same machine with the Splunk indexer and on the remote device. To collect data from remote machines, a special agent is installed on them - Splunk Universal Forwarder, which will send data to the indexer.
Splunk offer many ready-made applications and add-ons with pre-configured settings to load a specific type of data, for example, an Add-on is for data generated by Windows, Linux, Cisco, CheckPoint, and so on. In total, over 800 add-ons are currently created, which can be found on the SplunkBase website.
')
Types of data sources
All incoming data can be divided into several groups according to their sources:
Files and directories
Most data goes to Splunk directly from files and directories. You just need to specify the path to the directory from which you want to take data and after that it will monitor it continuously and as new data becomes available, it will be immediately uploaded to Splunk. Further in this article we will show how this is implemented.
Network events
Splunk can also index data from any network port, such as remote syslog data or other applications that transmit data on a TCP or UDP port. We will look at this type of data source in the example of Fortinet.
Windows sources
Splunk allows you to customize the loading of many different data
Windows, such as event log, registry, WMI, Active Directory, and performance monitoring data. In more detail about loading data from Windows to Splunk, we wrote in a previous article. (link)
Other data sources
- Metrics
- Scripts
- Custom data loading modules
- HTTP Event Collector
Many tools have already been implemented that can load almost any of your data, but if even none of them do not suit you, you can create your own scripts or modules, which we will discuss with one of the following articles.
Fortinet
In this section, we will discuss how to implement the loading of Fortinet logs.
1. First you need to download the Add-on from the SplunkBase website at this link .
2. Next, you need to install it on your Splunk-indexer (Apps - Manage Apps - Install app from file) .
3. Then we configure the reception of data on the UDP port. To do this, go through: Settings - Data Inputs - UDP - New. Specify the port, the default is 514 port.
We select Sourcetype: fgt_log, also we select a necessary index or we create new.
4. Set up sending data via UDP in Fortinet itself, indicating the same port as in Splunk.
5. Get data and build analytics.
Custom log
By a non-standard log, we mean a log that has an unknown sourcetype for Splunk, and therefore does not have pre-written field parsing rules. In order to get the field values, it will be necessary to first perform several simple manipulations.
Using this log as an example, in addition to parsing, we will show how to implement loading data from directories. There are two development scenarios that depend on where the data lies: on the local indexer machine or on the remote machine.
Local machine
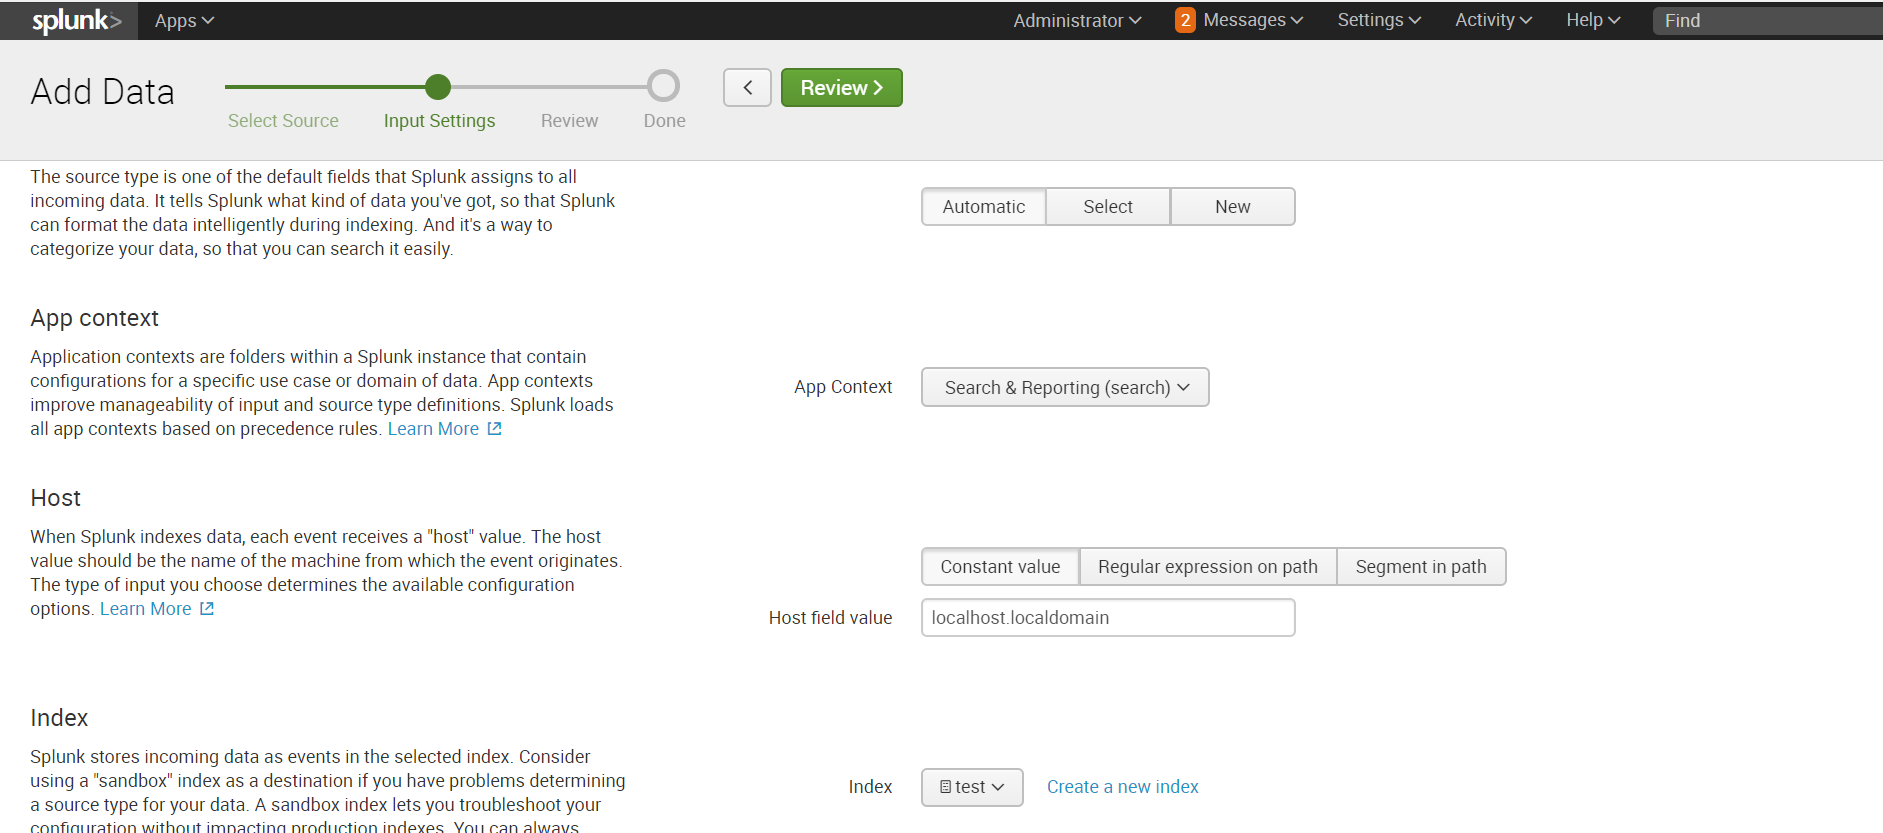
If your data is stored on your Splunk local machine, the download is very easy:
Settings - Add data - Monitor - Files & Directories
Select the desired directory, if necessary, we can register Whitelist or Blacklist.
Choose an index or create a new one, the rest by default.
Remote machine
If the directory in which the necessary data is stored is located on the remote machine, then the algorithm of action will be somewhat different. To collect data, we need an agent on the target machine (Splunk Universal Forwarder), configured by Forwarder Management on the Splunk indexer, the sendtoindexer application, and an application that tells which directories we will be viewing.
We described in detail how to install the agent and set up data collection from the remote machine in the previous article , so we will not repeat it and assume that you already have all those settings.
Create a special application that will respond to the fact that the agent sends data from the specified directories.
The application is automatically saved in the ..splunk / etc / apps folder, you need to transfer it to the ..splunk / etc / deployment-apps folder.
In the folder ..monitor / local you need to place the configuration file inputs.conf , in which we will indicate which folders should be sent.
We want to view the test folder in the root directory.
[monitor:///test]
index=test
disabled = 0
More information about the inputs.conf files can be found on the official website .
Add an application to the Server Class that is related to the target machine. How and why this should be done, we said in the previous article .
We recall that this can be done by following the following path: Settings - Forwarder Management.
In order for the data to be loaded it is necessary that there exists an index that was specified in inputs.conf, if not, then create a new one.
Data parsing
After loading we received data not divided into fields. In order to select the fields, go to the Extract Fields menu ( All Fields - Extract New Fields )
You can parse the fields using the built-in toolkit, which, based on regular expressions, selects the fields that you specify. Or you can write a regular expression yourself if the result of automatic work does not suit you.
Step 1. Select the field
Step 2. Choose the separation method
We will use regular expressions.
Step 3. Select the values that will apply to one field and call it.
Step 4. Check whether the field is selected in other events correctly; if not, add this event to the selected fields.
Step 5. Select the field in all events of different structure.
Step 6. We check if something extra is selected if, for example, there is no such field in the event.
Then we save the field and now when loading data with the same sourcetype to them such a rule will be applied to highlight the field value.
Next we create all the fields we need. And now the data is ready for further analysis.
Conclusion
Thus, we told you from which sources you can upload data to Splunk, showed you how to set up receiving from network ports, as well as how to load and parse a non-standard log.
We hope that this information will be useful for you.
We are happy to answer all your questions and comments on this topic. Also, if you are interested in something specifically in this area, or in the field of machine data analysis in general, we are ready to refine the existing solutions for you, for your specific task. To do this, you can write about it in the comments or simply send us a request through the form on our website .
We are the official Premier Splunk Partner .
PS
On June 28, 2018, “ Splunk Getting Started ” will be taught in Moscow , where in 6 hours the participants will receive a theoretical base and practical skills for working in Splunk. Learn more about learning and register at this link .
Source: https://habr.com/ru/post/353426/
All Articles