Self-Conscious Applications: Automated Production Diagnostics
The path to comprehending Zen begins with the development of applications that can monitor themselves - this makes it easier and cheaper to fix problems on production. In this article, we will see how modern Windows applications can do self-monitoring, self-diagnostics, and possibly even self-healing, and all this without having to have an external agent or stupidly restart the application. By curbing the power of ETW for accurate low-level monitoring, Windows performance counters for obtaining resource-free statistics and the CLRMD library for analyzing your own streams, objects on the heap, and locks, you can move towards achieving self-awareness. All of this will be demonstrated on a series of demos: automatic profiling of CPUs, research of loaded threads and stacks, automatic GC monitoring (including object allocations), automatic heap analysis in order to find memory leaks, and much more. After reading the article to the end, you will receive a set of tools and techniques for implementing self-monitoring in your own applications.
The basis of the article is the report of Dina Goldstein “Self-aware applications: automatic production monitoring” at DotNext 2017 Moscow. Slides can be downloaded from the link .
Dina, recently, a Google developer who previously worked at Riverbed. Riverbed develops performance monitoring tools that run on millions of computers and mobile devices. Dinah was on the team responsible for a central information-gathering mechanism that uses low-level Windows events, collecting performance information from various sources. Working at Riverbed, she did a lot of monitoring performance, looking for bottlenecks in the Windows boot process, and monitoring user experience on the web.
To begin, let's discuss why it is necessary to engage in monitoring. I'm sure you have your own idea about this, but I would like to add a few observations that, in my experience, are not always obvious to people. First, it is obvious that when we develop something large-scale, monitoring is necessary. The situation must be controlled in order not to cause damage to customers. Usually, we have too many application instances running at the same time to keep track of them all, and therefore the task has to be automated. But this case is just the obvious, in contrast to what I will discuss further.
In my opinion, monitoring is just as important in simple user applications. In a certain sense, the situation here is much worse than with applications running on servers. As a rule, the server for which the application is written is under the full control of the developer: the version of the operating system is known, patches, which programs are installed. We do not know anything about this environment in which the user applications written by us will work. You do not know what security features are installed on the consumer’s computer, which, in my experience, can often interfere with the normal operation of the application. As a rule, we will find out about the problem when customers call and report that they had a disaster and are not going to renew the license for the next year. And it is very difficult for you to find out exactly what caused this catastrophe. You may not even have an Internet connection with the environment in which your application runs on the client.
Why develop your own tools for profiling and monitoring if there are many third-party tools? To begin with, in my personal opinion, it is extremely interesting to do research on performance, and for me already this reason is enough. But if you approach the question from a practical point of view, the tools you have developed for profiling and monitoring will better respond to the specific needs of your business. You can monitor not only common things like CPU, memory, disk access, but also individual components of direct commercial importance to you. For example, you can track startup times, queue sizes, individual requests, the execution time of individual components that are critical for your business. As a rule, this is quite difficult to achieve using third-party profiling tools.
Another reason for developing your own profiling tools is that the diagnostic data in this case goes from bottom to top. I mean that you do not need after sending the data to send them to the external dashboard, wait until their analysis is completed there, after which you will be awakened by an alert in the middle of the night. On the contrary, with the approach proposed by me, the application itself is engaged in data collection. It, as stated in the title of the article, acquires self-consciousness. It may even take action based on this data. Later I will show examples of exactly what can be done when the application has detected a problem.
Finally, this approach, apparently, is today the "last squeak." Under the influence of the DevOps principles, the community comes to the conclusion that it is necessary to automate monitoring, and indeed everything that is possible. The fact that everybody is doing this in itself does not mean, of course, that it is necessary to imitate, but in this case there are rationales for these generally accepted practices (I just listed them). I hope together these arguments will convince you.
How exactly do we create our monitoring system? Obviously, in a running application, the profiler or debugger cannot be constantly running. This will require too many resources, and this approach cannot be scaled. My proposal is not particularly new: to use one or another hierarchical monitoring system. We will use the most lightweight tools available for monitoring the most basic things - CPU, memory, individual requests, in short, everything that somehow consumes some resources. This can be done quite easily with the Performance Counters API for Windows. It provides access to data providers distributed across the system, and provides information related to both basic indicators (CPU, memory) and things related to .NET (garbage collection time, generation, etc.). This data can be accessed both at the system level and at the level of our process. If you don't like Performance Counters - no problem, you can use the Win32 API. By and large, this is the same, the source of the information is one.
For more rare events or situations where we need more detailed information, we can spend more time and resources in collecting data. The most interesting begins here. There are tools that allow you to diagnose and analyze the situation directly in the running application, and then send the data to the developers, that is, to you, to solve the problems. The situations in question are rare exceptions, deadlocks, application slowdowns. For this purpose, there is, for example, ETW (Event Tracing for Windows, event tracing under Windows). This tool is similar to Performance Counters . This API provides access to data providers in the system. Unlike Performance Counters , the information here is not only quantitative. Each of its events has a lot of metadata, there are call stacks, which is already quite good. For example, the type of garbage collection is reported about garbage collection events, why it was called, which type was selected. Later I will demonstrate it with examples. The ETW resource intensity mainly depends on the frequency of events that we are tracking, and on the amount of data collected.
A useful tool that can complement ETW is ClrMD . This is an open source library that has been in existence for several years. It is available on NuGet, the source code is on GitHub. Its support is provided by Microsoft. This is an API that provides many debugging actions: examining call stacks, crawling .NET memory, accessing logs, synchronization mechanisms, and much more. Some of these operations are also available for native applications (applications and libraries written in C / C ++), which may be necessary if your application has several levels, including the system level. Resource intensity, again, depends on the frequency of use and on the specific operations performed. For example, you can quickly get the call stacks of several threads, but you will have to wait to get around 64 GB of memory. As in general, everything in programming, you need to use this tool wisely.
Finally, in really critical situations, you can roll out heavy artillery debugging and profiling. This is a CLR Profiling API , CLR Debugging API , they have all the functions available to profilers and debuggers, including that they can pause the application, use breakpoints and much more. Obviously, it is not necessary to resort to such means regularly. Even the documentation for these libraries indicates that they are not recommended for use in code that depends on speed. But knowing about the existence of these tools is useful. Here are links to them. Today we will not talk about them, because, hand on heart, I myself did not use them.
Finally, if you are interested in certain low-level APIs, you can use them. I also classify them as the most resource-intensive and cumbersome means, because it is quite difficult to use them correctly. In my experience, many security tools also use interception points. When several tools do this with respect to one API, and one of them does it wrong, the consequences can be horrendous. If possible, it is worth trying to get data in other ways. Resource intensity, again, depends on the nature of the actions performed.
With the introductory part of this all, let's get down to business. Look at the examples that you can learn about the work of your applications. I would like to start with CPU profiling. Despite the fact that the example is fairly simple, and is not tailored to any particular application, it already demonstrates the benefits that can be obtained. In the main conference report, Andrei talked about performance testing at the development stage. But, I think it happened to all of you that at this stage everything was in order, and in production it turned out that everything does not work as planned. Perhaps the client is doing something wrong, or he has the wrong version of Windows installed - again, I’m talking about user applications that need to work in different environments for different clients. It may not be clear how to reproduce problems; they may occur irregularly. For example, once every three days the CPU load jumps for 10 seconds, and your customers are extremely unhappy because they are very important people, and these 10 seconds have spoiled everything for them. How to deal with such problems? Imagine that you could collect data about the current state of your running application, write it in a log and send it to the developers. This is the approach I will now demonstrate.
As I have already said, to achieve this goal it will be necessary to implement a hierarchical monitoring system. To begin, the problem must be detected It’s easy, we’ll track CPU usage with Performance Counters . This will take the very minimum of resources, so it can be done quite often. Then you will need to define some rules of the application, for example, it should not take more than 80% of the CPU for more than 10 seconds of continuous operation. What exactly are the rules you must decide for yourself, or ask your customers.
As soon as we have determined that we are currently in a problem situation, we can invest more resources to determine the source of the problem: to diagnose, to get stacks of calls. We will do this with the help of ETW , which, as you remember, provides the call stacks of those events that it is tracking. In the case of a CPU, ETW can simply sample the CPU, for example, every millisecond (that is, 1000 samples per second is the default). In this way, we will get the same result we would have if we had attached a profiler to the application and performed the sampling. In real time with ETW, we will do this using the open source LiveStacks library, which translates the ETW samples made by cycles into function names. Thanks to this, we will be able to restore call stack trees, find stacks that consume the most CPU resources, display data in the form of flame graphs or any other convenient form. Moreover, you can even make recommendations for actions that the application can immediately upon detection of a problem. I will give a few examples, but I am sure that you yourself can come up with specific solutions that are more suitable for your business.
Suppose your AuthenticationController suddenly begins to consume too many CPU resources. Perhaps you are attacked by a DDoS attack? This assumption already allows you to take some measures, which ones are difficult for me to say, since I am not a web expert. Probably, you can close the communication channels, try to filter certain IP. Another example: a processing mechanism is suddenly overloaded. If it is located on a server, then it may be time to scale. And it will be especially cool if this scaling can be done automatically. Finally, if you can’t think of anything clever, you can simply write down all the available information in a journal and send it to the developers. Already for this they will be very grateful.
Let's see a demonstration of this approach. I have an ASP.NET server called Los Gatos. All the demonstrations I have recorded on video , because I did not want any interference during the report. The site is visible on the screen on the left and perfmon , UI for Performance Counters on the right. I configured it to track CPU usage. We see that when I enter the site, within a few seconds the processor is overloaded, after which the download drops again. In this situation, the client will not have time to call you to solve this problem with the help of the profiler. It would be nice to get data about it in real time. Let's see how this can be done.
I want to make a reservation: I'm not sure that in terms of design and architecture, classes and inheritance are best implemented in this code. It is written specifically for demonstration, so you probably should not copy it in its pure form into your system. In addition, we will not go into too much detail - I am sure you can read the API documentation yourself. My task is to demonstrate exactly what can be achieved, and how.
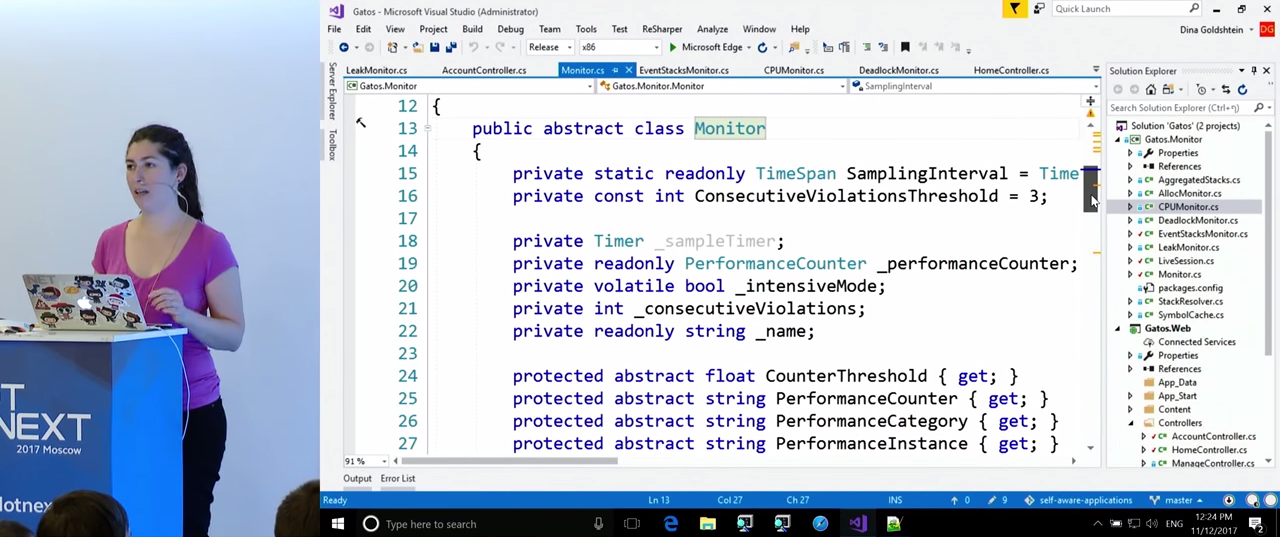
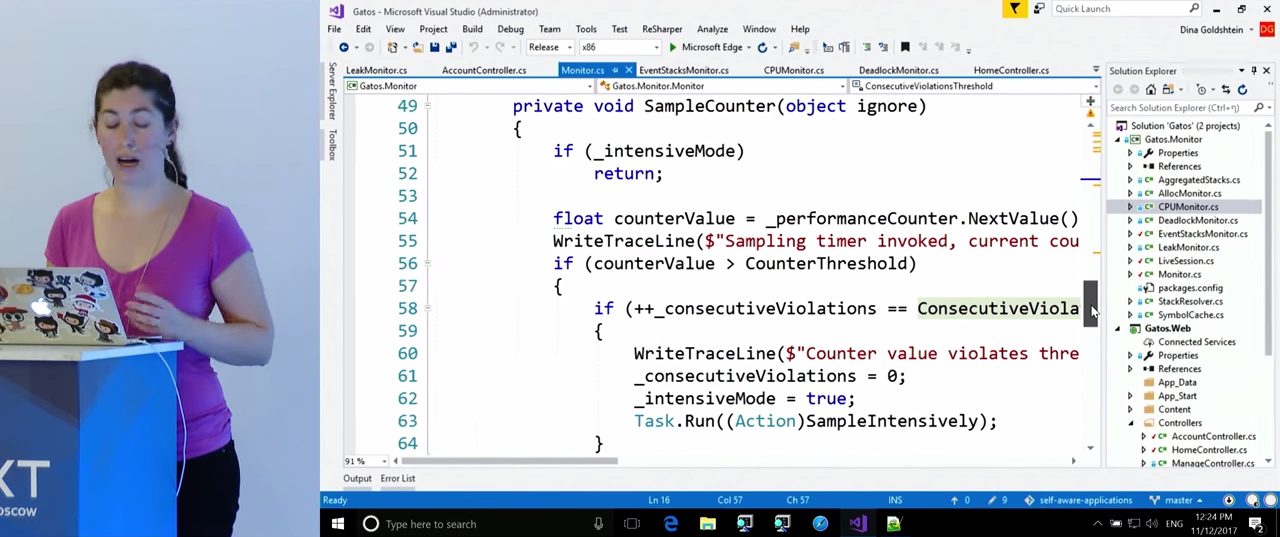
Let's look at the CPUMonitor, class CPUMonitor, EventStacksMonitor CPUMonitor, , which, in turn, inherits from Monitor. Monitor has the most basic functionality. With a certain frequency (in this case, once a second), he samples the Performance Counters and monitors violations of the rules we have set. If the Monitor , , « », SampleIntensively . SampleIntensively is implemented in child classes depending on what they track.
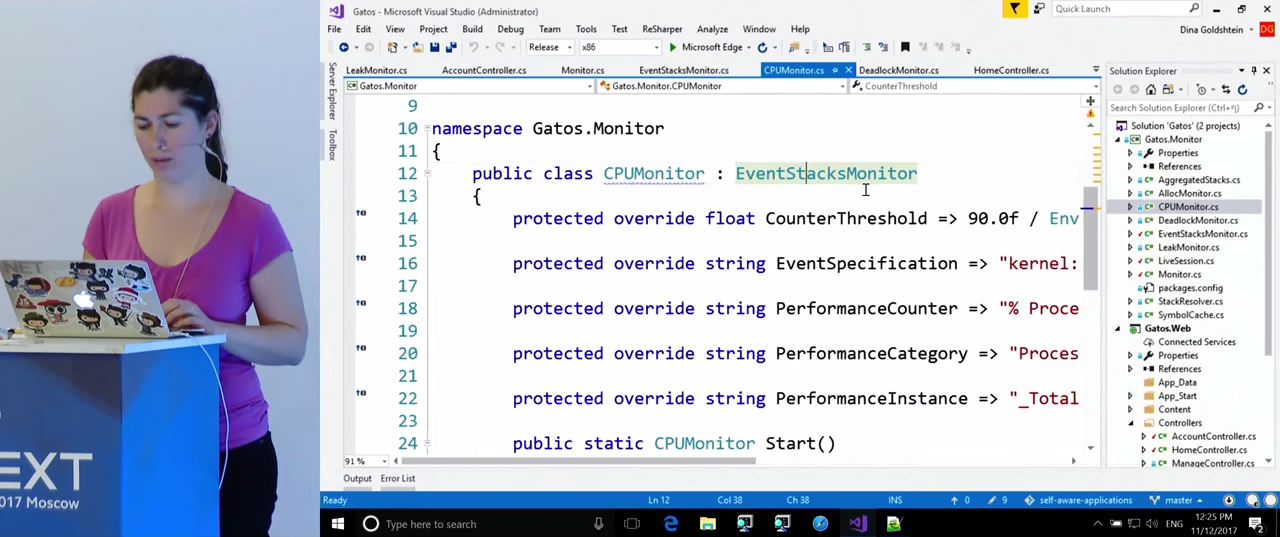
Take a closer look at CPUMonitor . The variables here are given the rules that we will monitor for violations: CounterThreshold - 90%, PerformanceCounter - "% Processor Time", PerformanceInstance - "_Total". In the case of CPU monitoring, we will need call stacks. EventStacksMonitor is engaged in their receiving.
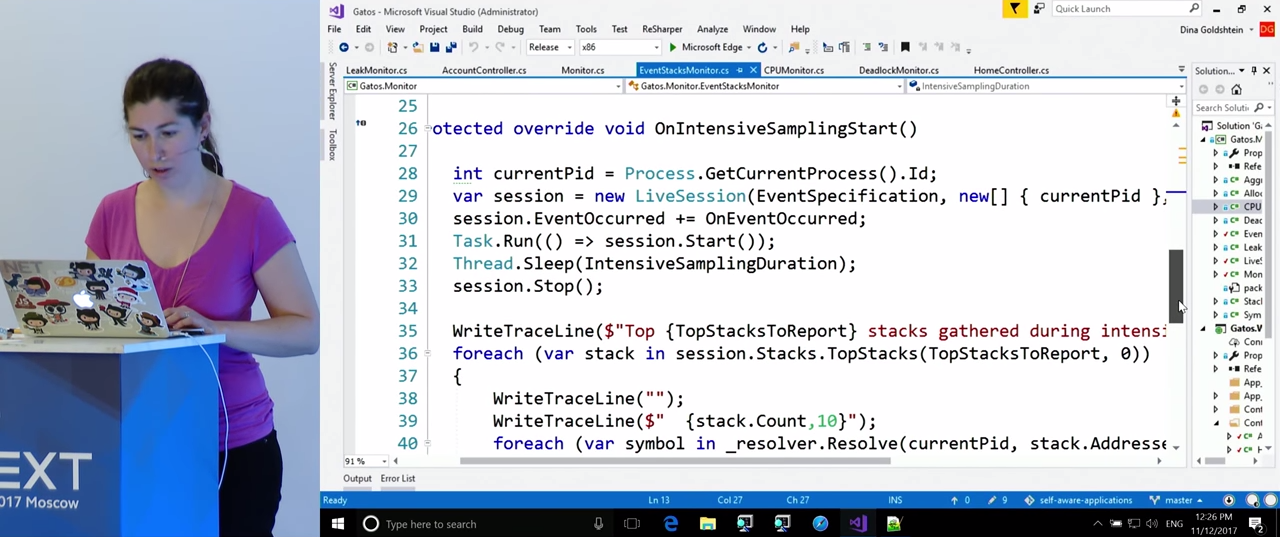

Here we see the implementation of “intensive mode” in the OnIntensiveSamplingStart() function. In it, we get the current process and create a LiveSession . I will tell you more about LiveSession later, it serves as a wrapper for ETW , which allows us to receive call stacks. We start the session, wait for some time (it seems 5 seconds), stop it, and, after the data collection is completed, we refer to its Stacks.TopStacks property. There we get the stacks that most loaded the processor during this session, and write them in the log. If interested, the .Resolve() method translates the addresses of functions in memory into function names so that developers can later identify the source of the problem.
Let's go back to the LiveSession class. I will not enter it, it is copied from the LiveStacks repository to GitHub. This is just a wrapper for ETW , which is concerned with setting up events that will be built to obtain information about CPU sampling. The general principle of its work has just been shown. Let's now take a look at the magazine, resulting from our attempt to enter the application.
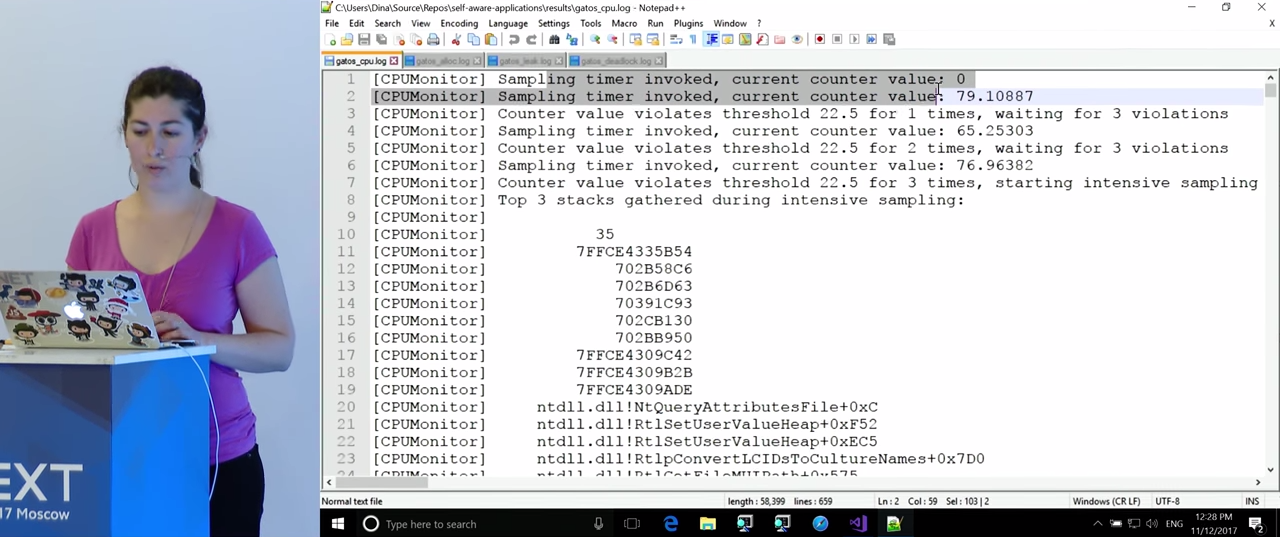
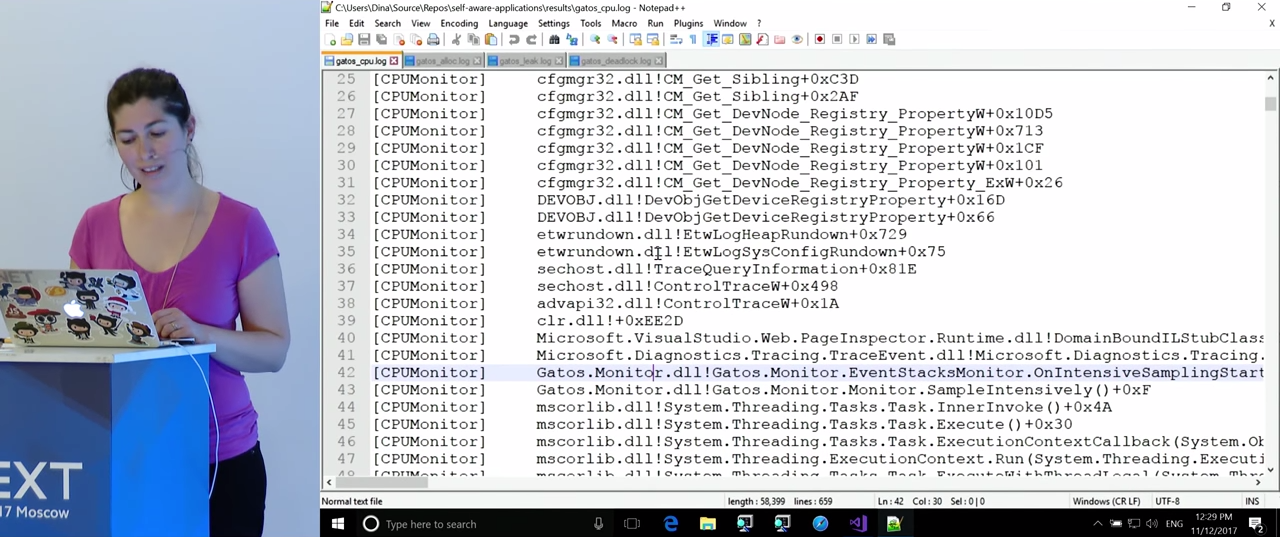
We see that at first everything looks good, the CPU load is low. After some time, three violations are detected, the CPU sampling mode is activated. After 5 or 10 seconds of work, enough data was collected and three call stacks were written to the log, absorbing the most CPU time. Unfortunately, some of the addresses could not be translated - perhaps there were no corresponding characters for this, Microsoft sometimes doesn’t have them. The result is somewhat disappointing (and I will return to this issue later): apparently, the first call stack is the monitoring code itself. However, it got here as a result of the peak of the CPU load that has already arisen, due to the inclusion of an intensive mode, under normal conditions it does not consume as much power. Move on to the next call stack. Here we see a lot of calls related to ASP.NET. Since I am not an expert in ASP.NET, I cannot say for sure what can be done here, but, in my opinion, this is useful information. Finally, the third call stack. Before us is the Login() method of our application - this should not come as a surprise to us, since we saw that the problem arose immediately after entering the application. However, it is worth remembering that when developers read a magazine, they may not know exactly what actions were performed during the peak processor load. If you look at the call stack in more detail, we will see a function that calculates the hash.
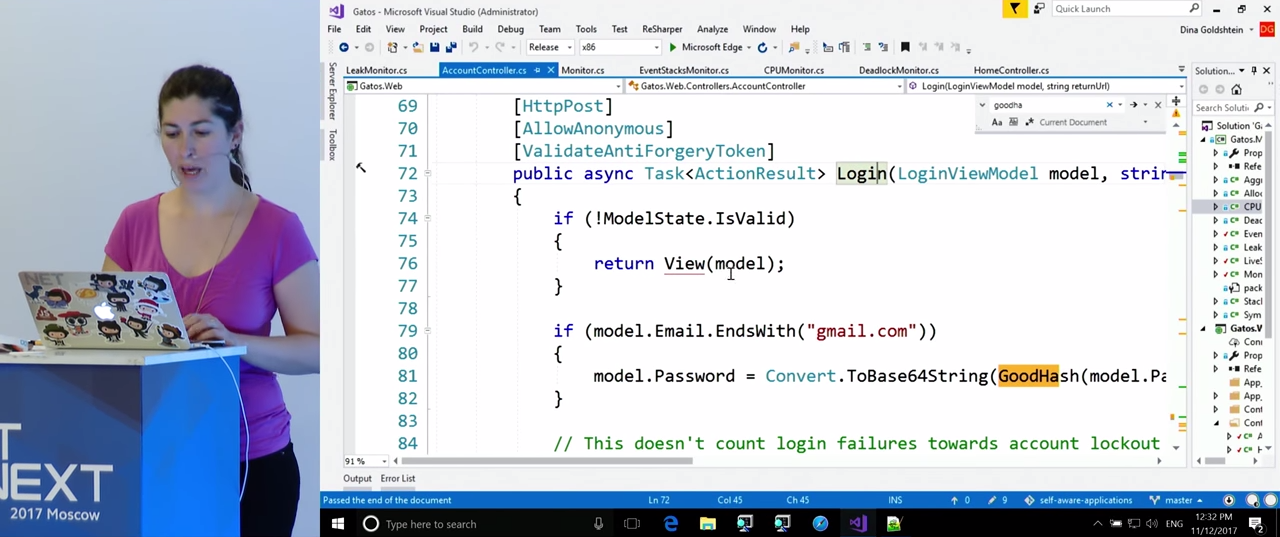
Now we can return to the code. We find the function by its name, and we see that it is engaged in calculating the hash every time when the email address ends at “gmail.com”. It is these calculations that load the processor. So, we found a real-time problem with using the CPU, and as a result of profiling we found the function in the code that caused this problem. In my opinion, this is a very good result.
The following example is taken from real life.

On the screen is a screenshot in which we see the open Visual Studio and Process Explorer, and the process devenv highlighted in Process Explorer. All this you can check on your computers. The devenv , process devenv , perfwatson2 , «perf» . , , , «perf» . , , perfwatson2` creates an ETW session with four providers. I was unable to establish exactly what they are recording, but it is known that this process is involved in profiling Visual Studio. The developers of Visual Studio found that they needed telemetry of what was happening inside the program during its use. And they used the same method that I showed you in the previous example. He is already included in the practice of some companies. I was unable to get to the file in which the data of this telemetry were recorded, some strange errors occurred, but this is not the point. Monitoring Visual Studio itself with ETW is part of its functionality (although in general it is not clear - Microsoft describes PerfWatson, but it is not part of the public documentation on VisualStudio). As we see, it was not I who invented this method; it is already included in the practice of some companies. The following examples, which I will talk about, are also related to real practice.
Let's talk about monitoring garbage collection, or rather, about problems that may affect its effectiveness. It's about situations with a lot of memory allocation. Obviously, GC pauses when processing requests are bad.
But, again, do not forget about the situation with user applications. If users experience crashes and slowdowns in the UI due to long stops in the garbage collection, they obviously will not like it. I want to emphasize once again that the things we are discussing here concern all types of applications, not just server applications.
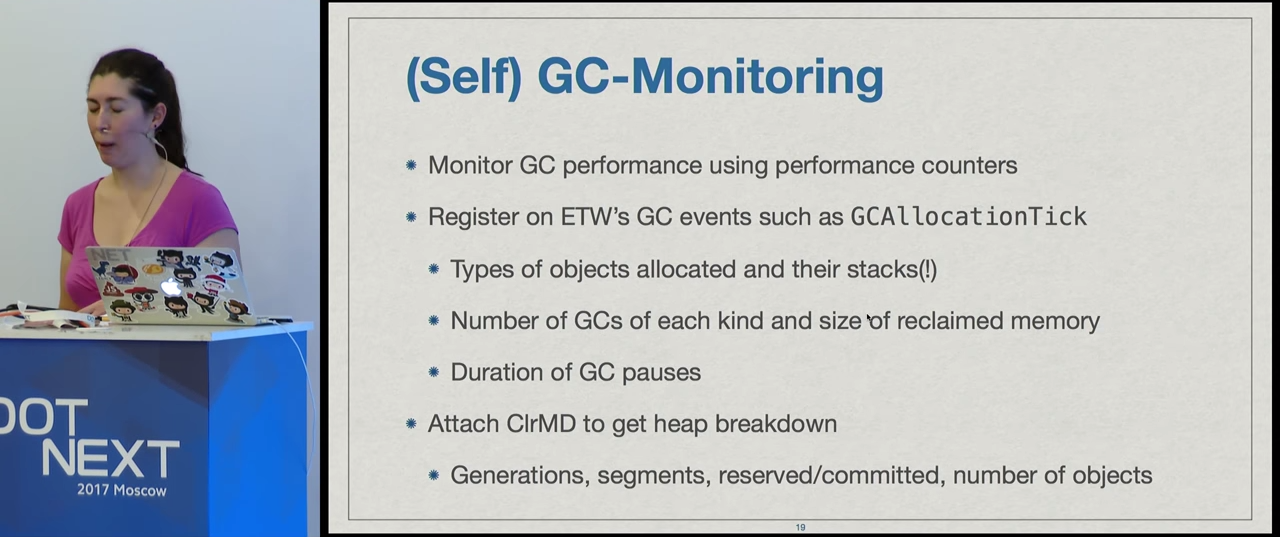
The principle here will be the same as in the previous example, but this time we will deal with memory, and not with the processor. With the help of performance counters, we will track the speed of memory allocation, and as soon as we notice a performance jump, we can begin more intensive profiling. In this case, it will mean getting data about the allocation of memory: what types of memory it takes, and where it happens. In addition, you can find out how long the garbage collection takes, get information about generations, how much memory has been released, how much is left occupied. You can even attach ClrMD and see in general what is in our heap (later we will do this): segments, generations, types of objects, number of objects. All this can help us understand what is happening in the application and where exactly the problem is located.
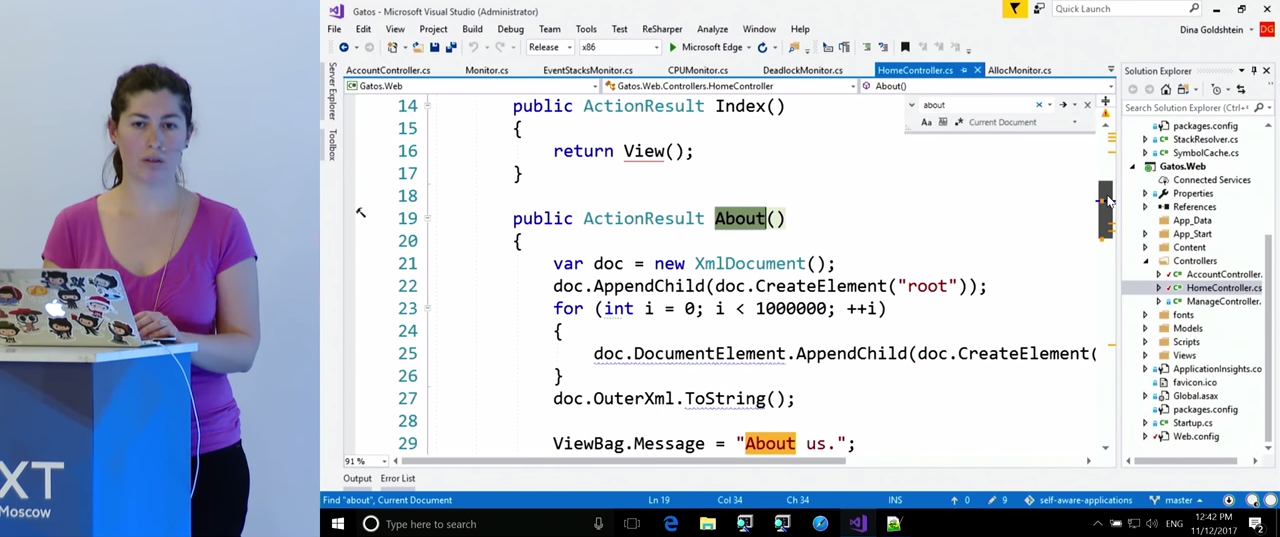
So, we have an application in which we track the speed of selection. When entering the "About" we see a sudden peak of discharge. This does not mean that we will certainly have a problem with garbage collection, but it becomes very likely.
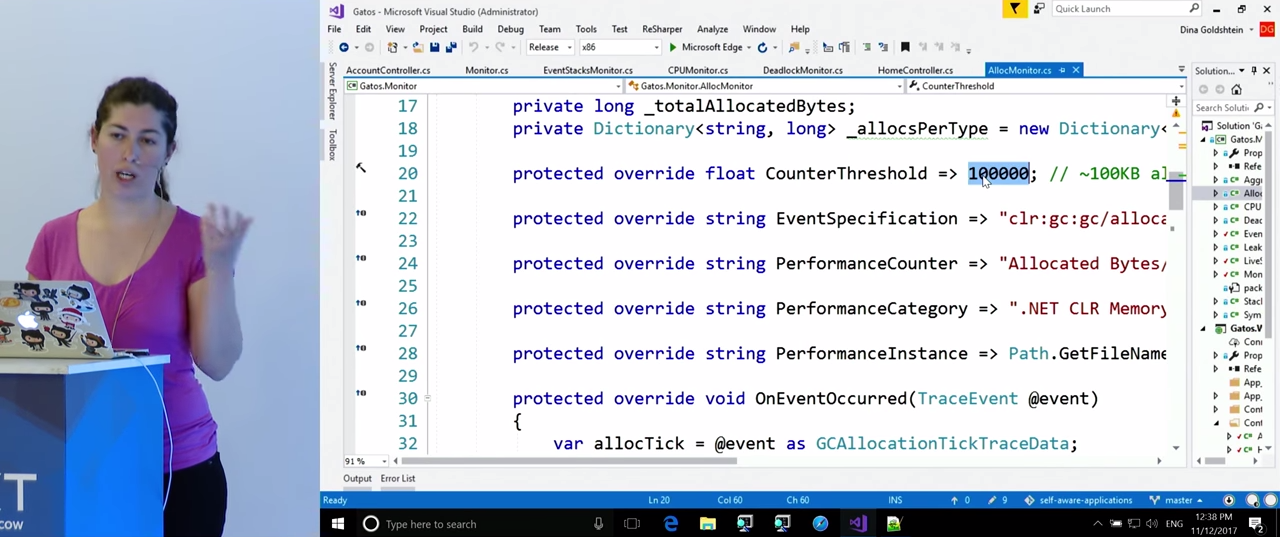
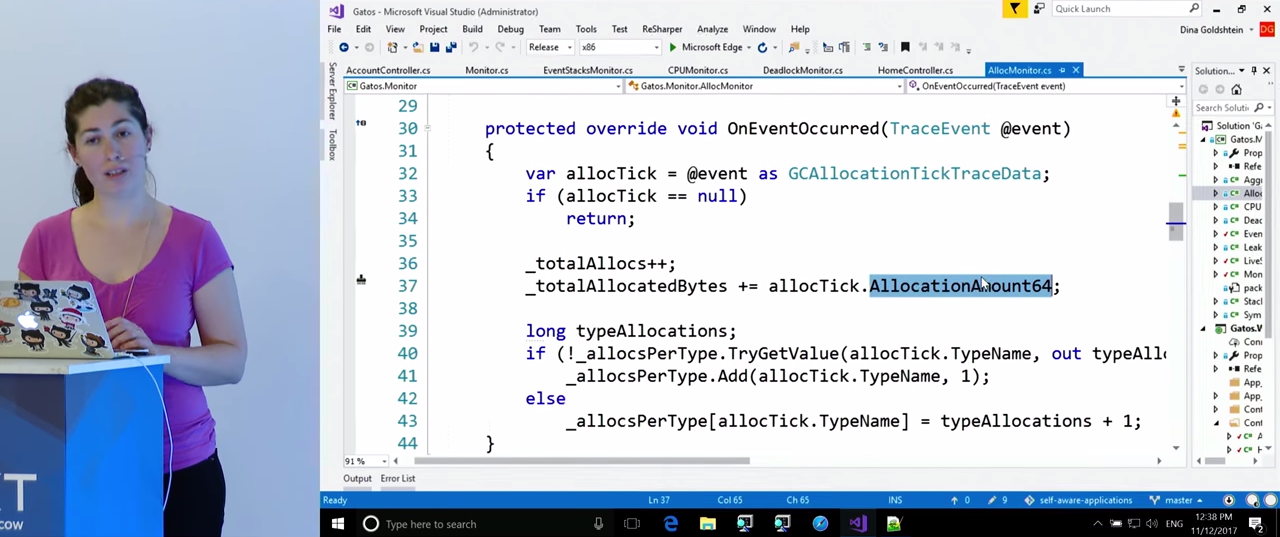
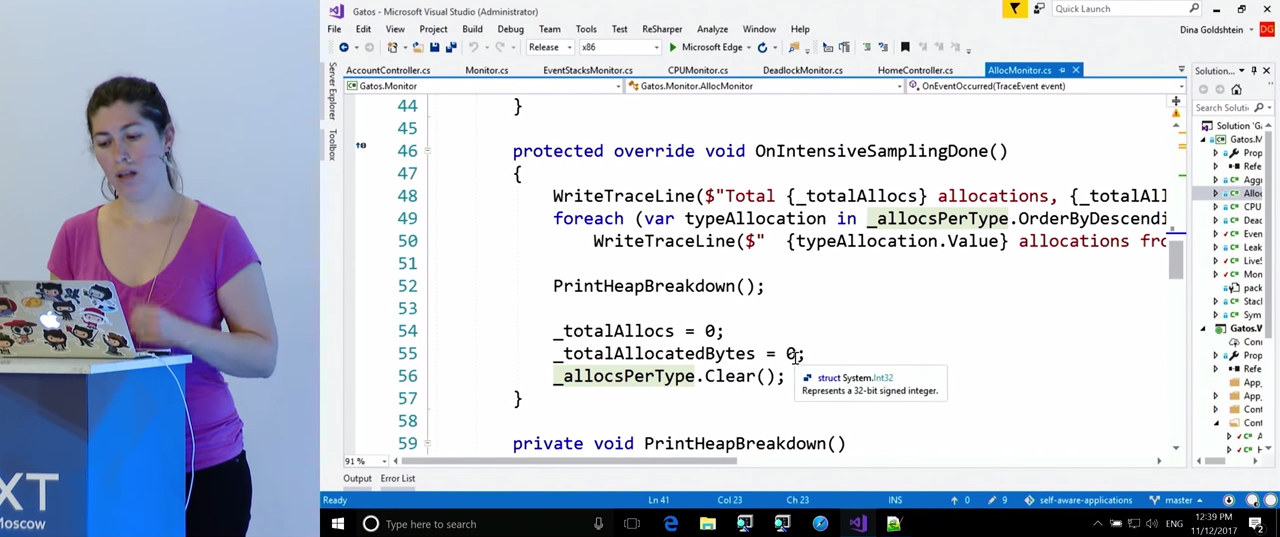
To learn more, look at our code, namely, on the class AllocMonitor . It also inherits from EventStacksMonitor , because, as is the case with tracking processor overload, we will be interested in the call stacks in which allocations occur. For this we need ETW . Like last time, here the variables specify the rules by which we will monitor the Performance Counters , for example, CounterThreshold is 100000 (obviously, in your application you will set it based on your needs). The ETW event that we will expect and from which we will get the call stacks is called clr:gc:gc/allocationtick . This event will give us information about the type of object being created, and where memory allocation takes place. The OnEventOccurred() . function OnEventOccurred() . OnEventOccurred() . GCAllocationTickTraceData OnEventOccurred() . structure has a property that tells you how much memory has been allocated, and there is information about the type of object created. For the time being, we will need these data, although there are many others there. During the intensive sampling mode, this data will be stored in the dictionary, and we will know how many objects of each type were selected during this mode. In addition, we get the call stacks in which these allocations took place.
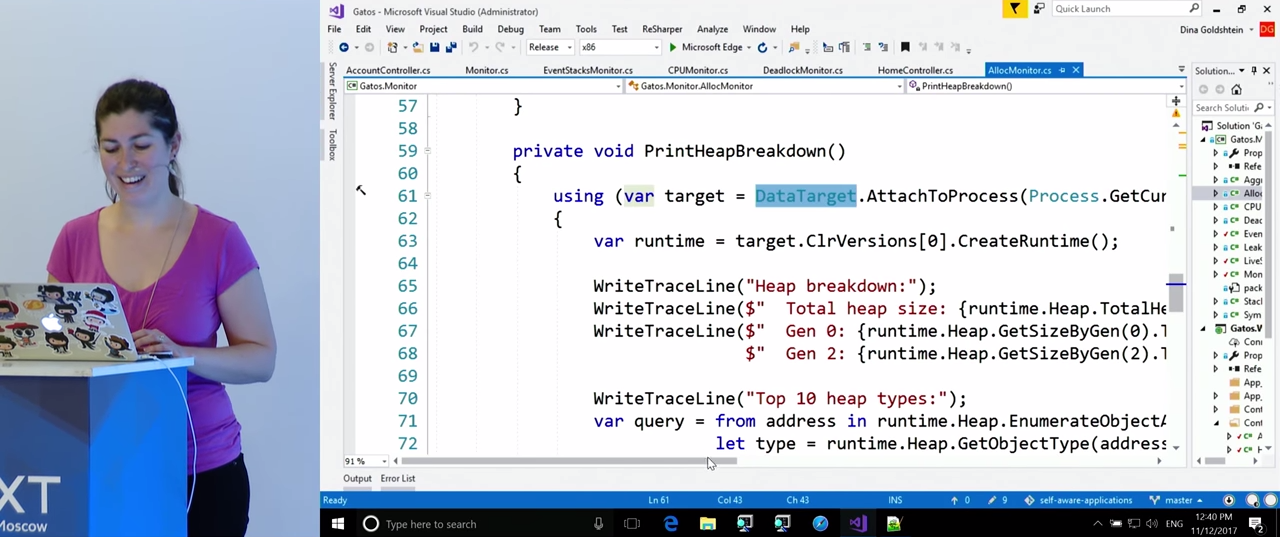
After that, for some time we will collect statistics on what is happening in the heap. We will do this with the help of the ClrMD library. There is a lot of code here, but it is very simple. The main API we need is AttachToProcess . We get the CLR runtime, we will need the `runtime.Heap property, thanks to it we will be able to bypass the heap. It also has a total heap size, the size of generations. However, the most important thing is that with this property we can enumerate the whole heap and get type, name and size for each object. All this data is placed in the dictionary, and we now know that there are so many lines in a heap, such and such a number of arrays, etc.
Take a look at the magazine. At first, everything is fine in it, but then memory allocation begins, and three violations occur. As you remember, we collected call stacks where allocations occurred. Here we have those stacks in which the most selections occurred. This time we immediately find the result we need: a stack with the About() method. Again, this is not surprising, since we know that the selection began when we went to the "About" page. If you look in more detail, it turns out that the selection occurs when strings are merged. To clarify the situation, back to the code.
We see that the About() method parses a large amount of XML. Some functions are .append , from here there is a large number of lines, intermediate objects, unions, records and other things. All this causes a problem with secretions. To confirm the source of the problem, you can look at what other information is in the journal, because the heap statistics were recorded there. Quite expectedly, we find there a large number of string objects. This confirms our initial diagnosis of the problem.
In the following example, we will investigate a problem that is causing everyone a lot of trouble: memory leaks. There is no point collecting call stacks. We will follow the same general principle of tracking memory usage. As one of the symptoms, you can monitor memory jumps, but by themselves they do not provide confidence that a leak has occurred. In addition, you can specify that the application should not use more, for example, 100 megabytes of memory. If this threshold is exceeded, the situation requires our attention, even if it does not leak. Here you can apply ClrMD , on the same principle as in the previous example, and find out what exactly takes an unusually large amount of memory. If there is a possibility of a leak, we, as developers, can automate the response of the application. You can make several heaps snapshots, and try to compare them. So we will find out which objects were allocated, which memory was freed, which was not, and why. All this can be done with the help of ClrMD , and then we can compare this information with that obtained from ETW , if we are ready to spend additional efforts on this.
Take a look at the demonstration. This time I keep track of the bytes in all the heaps, this is our managed memory. I register on the site, and while I enter the data, the memory status does not change. As soon as I click on the register button, there is a jump in memory usage. Even if we are not afraid of a leak, we should find out what exactly is the cause of the jump.


To do this, turn to the class LeakMonitor . Since we do not need call stacks this time (there is no ETW event that could be used to analyze this memory situation), it does not inherit from EventStacksMonitor , but directly from Monitor . As in the previous examples, the variables indicate the threshold, whose threefold exceeding causes an intensive mode, and the monitored parameter is indicated. Let's see what exactly happens when excessive memory usage is detected. I will try to show what can be automated here at the development stage. We will do three snapshots of the memory space. Note that before each snapshot, the garbage collector is called because I want the statistics to be as clean as possible. Later, I will compare what has been liberated and what is not. After garbage collection, I connect to the process, get a heap snapshot, wait a few seconds, then repeat the cycle. After completing the cycle, I compare the snapshots and write the results to a file.
Take a look at the snapshot heap. It is rather primitive, there will be no statistics on individual objects. This, obviously, would take much more time, and you don’t always want to spend it. Collected only data on the number of objects of each type and the total size of all objects of a particular type. This is done in exactly the same way as in the previous example: heap traversal is done, data on size, name and type is extracted, and added to two dictionaries, size depending on type, and quantity depending on type. These two dictionaries are not even compared with ClrMD , but as a simple function that compares data in dictionaries of different snapshots. Finally, all of this is logged.
In the journal, at first there is nothing unusual, but below we see that the program detects a violation of the rules we have set. Thanks to snapshots, we see that the number of byte arrays has increased significantly. Obviously, there is a problem. The difficulty is that arrays of bytes can occur anywhere. In the optimal scenario, you will be able to find the type specific to your application in which these arrays are created. In this example, we know that the problem occurred during registration, so we can find the corresponding code.

The registration function checks the password, and at the same time adds data to some static list. And the creation of this data causes the allocation of a sufficiently large array of bytes. Obviously, the example is not very realistic, nevertheless, I think, in your practice, one or another data structure that could be found in such a case would still be. But even if we are talking about arrays of bytes, you probably know exactly where the allocation of these arrays occurs in your code. Or you can correlate this data with data on memory allocations from ETW , and find that it is in this branch of the code that a significant amount of them occur.
For sweet today will be an example of the detection of deadlocks (eng. Deadlock). There is a difference from the other examples we have examined, since there is no simple numerical indicator by which it could be determined that a deadlock has occurred. You can only identify some of the symptoms. One of them may be a situation where the processor load suddenly becomes unusually low and the application does nothing. Or if requests are not returned after their waiting time has expired, this may mean that the threads that should respond to these requests are suspended. And maybe the opposite situation, your thread pool opens up more and more threads, because others are in a deadlock, and you need to respond to requests. But you need to accurately determine the list of symptoms based on the needs of your business.
If there is a suspicion that a deadlock has occurred, then we will attach ClrMD and look at the call stacks to detect it. I'm not sure if there is anything that can be done to resolve a deadlock in this case, but at least the problem will be logged, which will be sent to the developers.
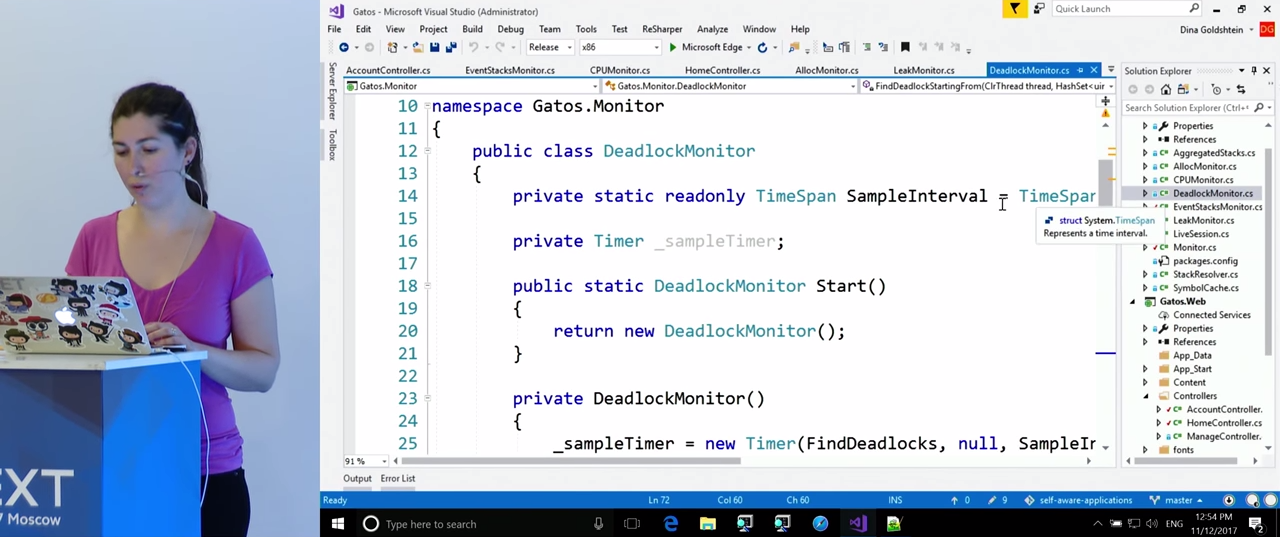
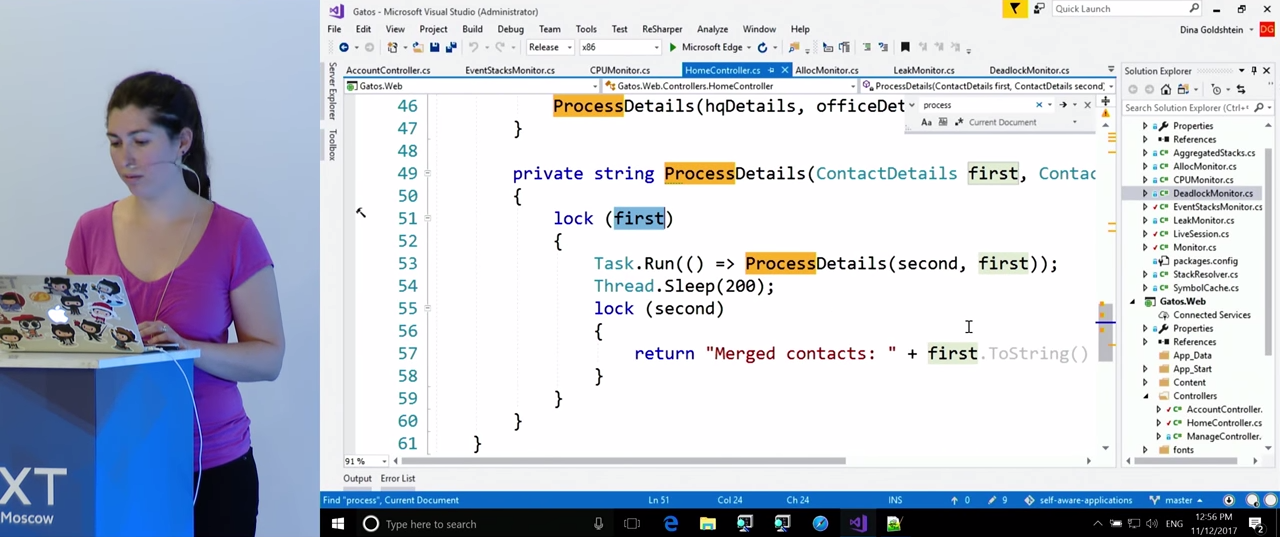
Let's go directly to the example. I try to go to the contact page, and it turns out that it has hung up. , . , . , DeadlockMonitor . , , . , ClrMD , .

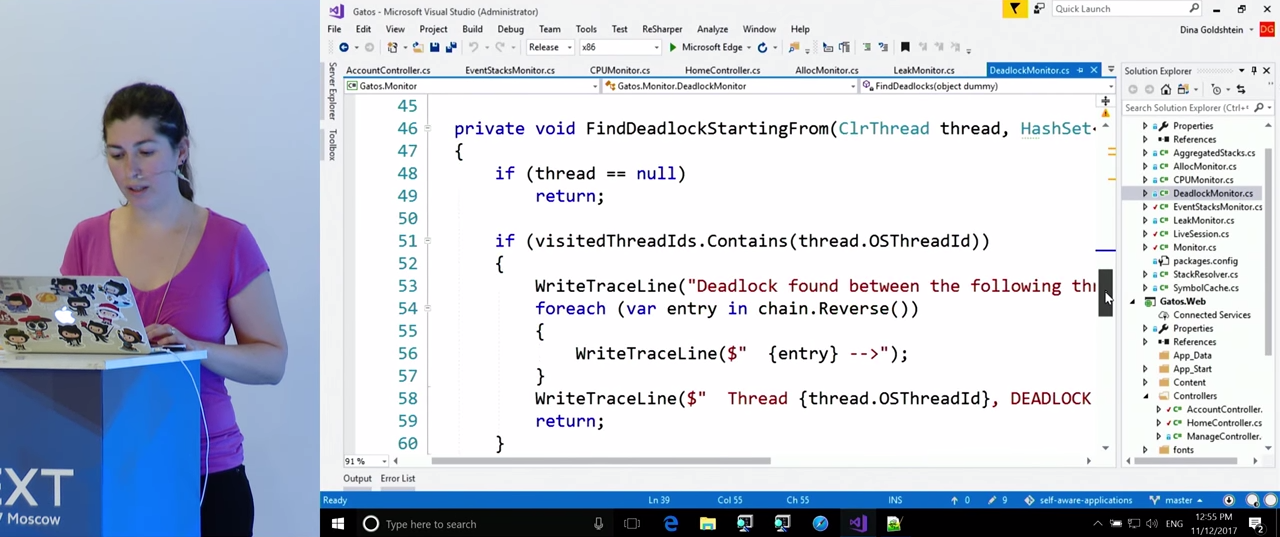
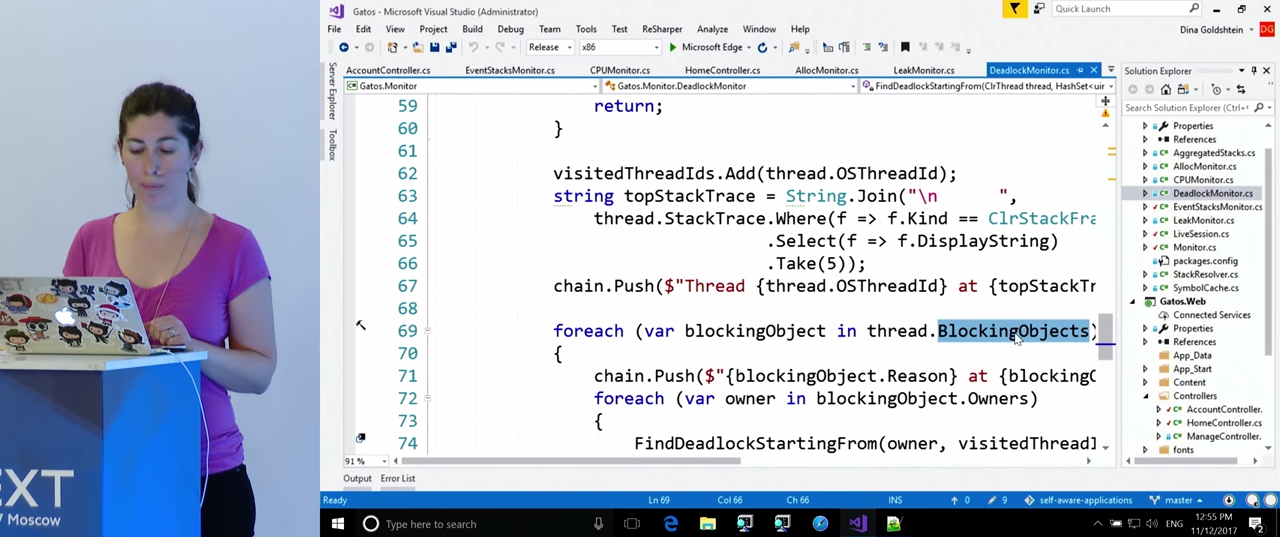
FindDeadlocks() . , ClrMD , , . thread.BlockingObjects . Owners , , . , , , . , , , .
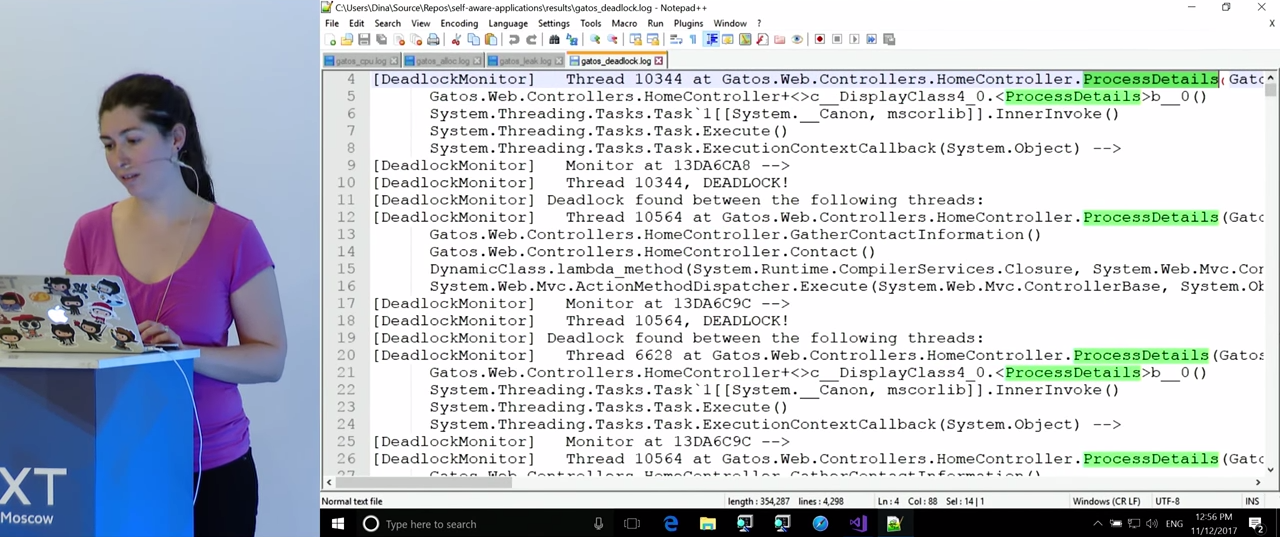
, , , , HomeController.ProcessDetails() .
, , . , , , -, .
. , , . . CLR , , . , , , . , , ETW . . ETW . , , C/C++ Win32 .
, ClrMD , ( , ). , , , .
, , . , , . , . . , , , . , , , . ETW , ClrMD .
. , ETW . , , Visual Studio: «perfwatson2», , .
, . — , .
This article comes to an end. , , . , : , . , , , : , , , . .
. , , , . .NET — DotNext 2018 Piter . 22-23 2018 -. — YouTube . .NET . , , .
')
Source: https://habr.com/ru/post/353298/
All Articles