How we did a project about the presidential elections in Russia in 2018

In the fall of 2017, the guys from GOLOS thought that the online broadcast of the elections should be brought to a new level:
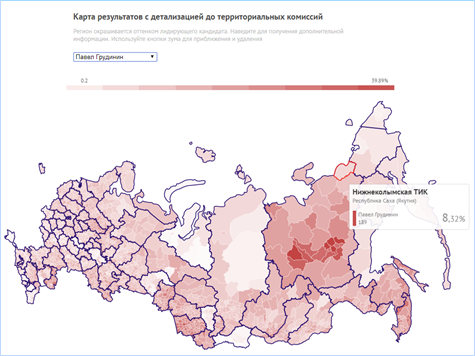
- Firstly, it was frustrating that until now there are no details on the maps of the subjects of the Russian Federation to the territorial commissions,
- secondly, the extreme complexity and intricacy of the CEC website, which does not allow to quickly find out the results in their polling station,
- and thirdly, it was decided to start making the basis for an encyclopedia of results, when you can see the results for different elections for one polling station. Roughly speaking, find out how the neighbors voted.
And all this is not only to find out in which region 39% of voters live for Grudinin, but also to check whether there is such a place in a country where Putin did not win the election.
It quickly became clear that, alas, it was not worth waiting for financial investments in this project, and then everyone worked on almost pure enthusiasm.
Association of non-profit organizations "In Defense of Voters' Rights" Golos "" is a Russian public organization. Founded in 2000. The declared objective of the organization is the protection of the rights of voters. In mid-2013, the organization was active in 40 regions of Russia.
In its work, Golos informs citizens about the electoral legislation of Russia, conducts long-term and short-term observation of elections at all stages of elections.
I joined the project when the guys had a clear idea: where they would get the data from, the structure of the project and the design. The team needed a man to deal with the server part, I took this position.
')
The project was structurally divided into two principal parts.
First part : before the election
The first part : before the elections ( uik.golosinfo.org ), was supposed to start a week before the elections, and provide opportunities:
- find your polling station;
- see where it is on the map;
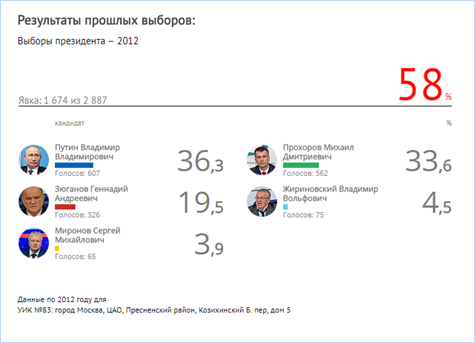
- recall exactly how people voted on this site.
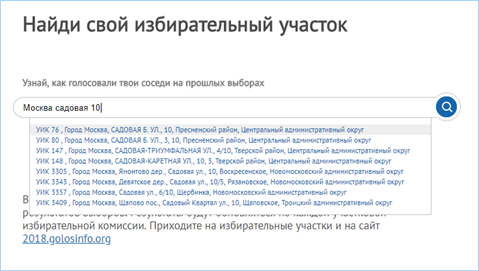
At this stage, everything starts with a search in the base of addresses of voters for more than 17 million records, which can be parsed from the CEC website. In this database, each component of the address like house number, street, city or district is a separate field and there are 16 types of such components. The set of non-empty components for different addresses is very different. A simple search for even one address in this database took more than a minute, which in itself is too long, and if we talk about a loaded project, it is not allowed. Then Sphinx came to the rescue and the search time was reduced to hundredths of a second.
Sphinx (born SQL Phrase Index) is a full-text search system developed by Andrey Aksyonov and distributed under the GNU GPL license. A distinctive feature is the high speed of indexing and searching, as well as integration with existing DBMS (MySQL, PostgreSQL) and API for common web programming languages (PHP, Python, Java are officially supported; there are community-implemented APIs for Perl, Ruby, .NET and C ++ ).If you are not familiar with Sphinx yet, then I highly recommend it, working with it is like magic, it is easy to configure and just works. By the way, there are rumors that Habr's search also uses this search engine.
Searching the address database allows you to determine which electoral commission a voter belongs to in 2018, but not in 2012 (the time of the last election). At first glance, it seems that nothing could change much, and people both went to vote in the nearest school and will go. But in fact, there were changes and there were a lot of them: in 2013, the numbers of polling stations changed in more than half of the PECs (precinct election commissions). In order to show how the polling station voted in the last presidential election, it is necessary to establish a correspondence between the number of the polling station in 2018 and the number in 2012.
There is a great difficulty in this comparison.
Unfortunately, it was not possible to find an address base for 2012 anywhere (otherwise it was possible to implement a direct correspondence of the address to a section). Therefore, we had to match the addresses of PECs 12 and 18th. Addresses were in a different format, so a script was written, highlighting the name of the settlement and the street (avenue, lane, etc.). Thus, about 60 thousand PECs were managed. On the same day, we started and faced dissatisfaction with users who reported that they could not find their PEC. Quickly on the same day, thanks to the help of caring people, we spent the remaining PECs matching the coordinates using the Python geopy library, and as a result, almost every address was able to give a turnout and the number of votes for candidates in the last election.
According to the data of the 16th year (Elections to the State Duma) everything was ready, but they didn’t have time to put them in the backend and frontend, it is in the plans.
Second part : election day
In the process of discussing plans in the fall, appetites for the children from GOLOS were so intense that it was decided to show real-time results with detail to each segment! However, on this idea we are stung.
So, according to the plan on the election day, the site was supposed to show on-line voter turnout with details from the country to individual polling stations, and when the counting of votes is over switch to the display mode of how Russians from different regions voted.
The second part of the project was to start with the beginning of the elections and show the dynamics of voter turnout on the map with some delay. It was planned that, at first, the Far Eastern regions will begin to light up on the map, and as the polling stations open, the color border will move to the west.
Precinct commissions during voting must submit turnout data at 10, 12, 15 and 18 hours, then the counting of votes and commissions submit detailed statistics for their polling station. We had a parser set up that was ready to accurately collect data from the CEC site as soon as they were updated and load it into the database on the server so that site visitors could see how events are developing with minimal delay.
The whole logic of the backend and the frontend was built on the assembly of data from the underlying levels from the underlying (PEC). However, this was our deliberate mistake, since we assumed that the results would be immediately for all PECs in the region, in reality this is not the case. In reality, it turned out that not all data appeared on the CEC website in a timely manner. In truth, almost from where did not come complete data. As a result, something like this happened: data could only come from a single PEC in the region.
In addition, we parse the pages of territorial commissions which host a summary table with statistics on district commissions, which is a long time, because there are as many as 2800 of such pages. For example, there are only 85 pages with statistics on TECs, as the number of subjects of the Russian Federation. We had to write separate parsers to the country, subjects of the Russian Federation and LICs, and update them in a timely manner, and PECs as soon as they are ready, then it would all work.
Due to the fact that we did not foresee the complexity in advance in the voting process, it was decided not to move to the second stage of the project until there is complete reliable data. So the project has lost the ability to monitor turnout almost in real time. But the opportunity to examine the turnout card carefully and study the distribution of votes for candidates did not disappear anywhere, when we had complete data (by the evening of the next day) we switched our project to the mode of displaying election results.
As a result, all three global megacystalts were closed (map, search for their PECs at, viewing the results of past elections), but did not work online. Although all the errors have been scrupulously studied and now we know how to do it, we are still waiting for the CEC to be more communicative and that they will finally begin to give their real-time data through the API.
And also:
- I learned that there are no addresses and names in Russia alone. It turns out that there are many people who live all the time and are registered in a dead end.
- It turned out very sticky thing, you can endlessly drive on the map and watch the tsiferki changing
We thank all those involved in this project, in particular, the DataMap laboratory team that made the map (a lot of work!): Andreev Vyacheslav, Anton Balashov, Mandzhiev Hongor, and also Elena Nikitin, Gleb Suvorov, Sergey Ustinov, Valeria Viskalin, Marat Khaliulina.
Source: https://habr.com/ru/post/353120/
All Articles