Using rrd4j for OpenHab2 persistence
OpenHab is a popular smart home server (or IoT, as it is now fashionable to say) and has already been seen on Habré. However, there is not as much documentation on specific aspects of server setup as we would like. And in Russian it, consider that there is not.
An important feature of OpenHab is modularity. By itself, the server provides basic functions (even without any UI). The rest of the functionality is provided by plugins. One type of plug-in is persistence - providing the ability to store history values for items (device parameters). This is necessary to display historical data (graphics) and restore the state of items when the server is restarted.
Existing plugins allow you to use all popular databases for storage. I will tell you about setting up a very interesting backend - rrd4j. This is a high-performance storage for data that is a series of values associated with time. The author was inspired by the RRDTools suite, but rewrote its functionality in Java (OpenHab is also written in Java), optimized and expanded the functionality. The rrd4j repository files are not compatible with RRDTools files.
Here you need to tell what is this repository. This is one or more cyclic buffers that store parameter values with a time reference. At the same time, it is possible to aggregate several changes into one buffer value (for example, to take data every minute, and to store one average value for 5 minutes).
')
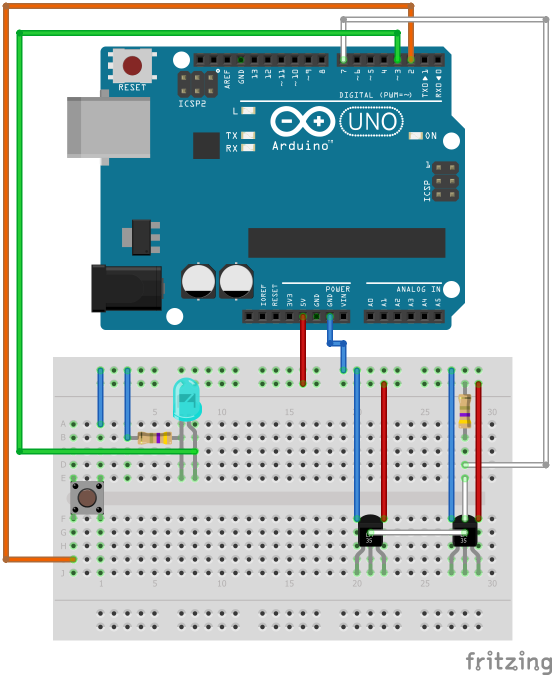
So, we have the installation of OpenHab2 without persistence. For tests, I will use this kind of board:
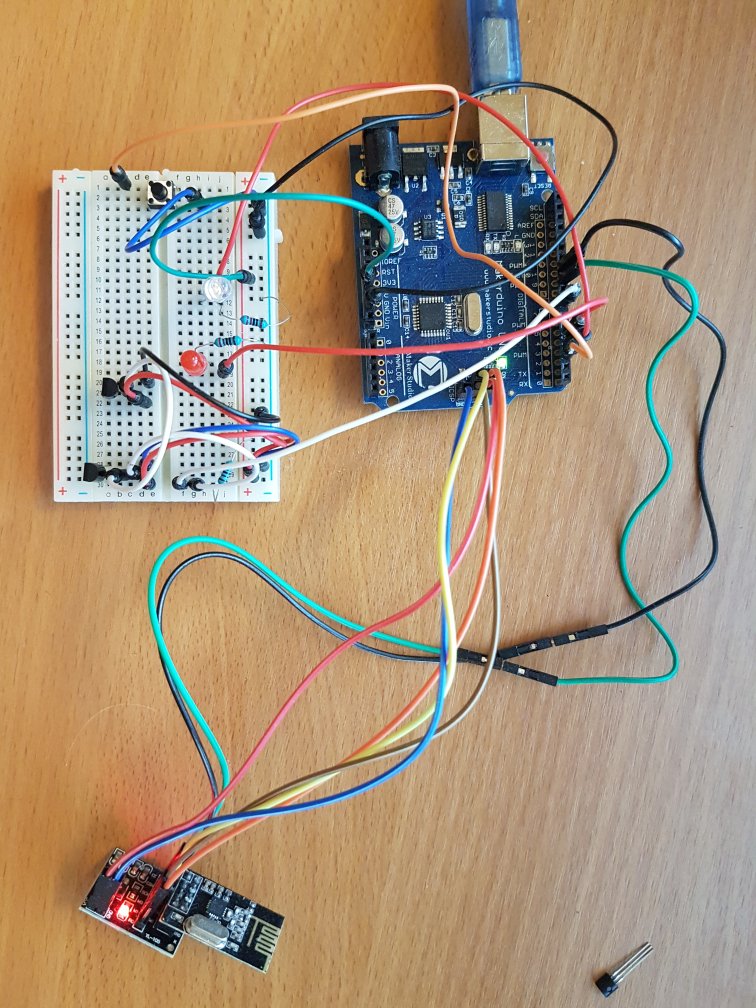
There are two Dallas 18B20 thermometers and a button on the board.
To communicate with the server, it uses MySensors. By the way, the plug-in for the MySensors protocol, for some reason, is not in the repository, so you need to install it with your hands, download from the forum thread and put it in the / usr / share / openhab2 / addons / folder.
A typical gateway with the same radio module is connected to the server via USB.
Yes, I prefer to use ClassicUI (and the UI in OpenHab is also a plug-in). I want to add a graph for two thermal sensors (see them on the same graph).
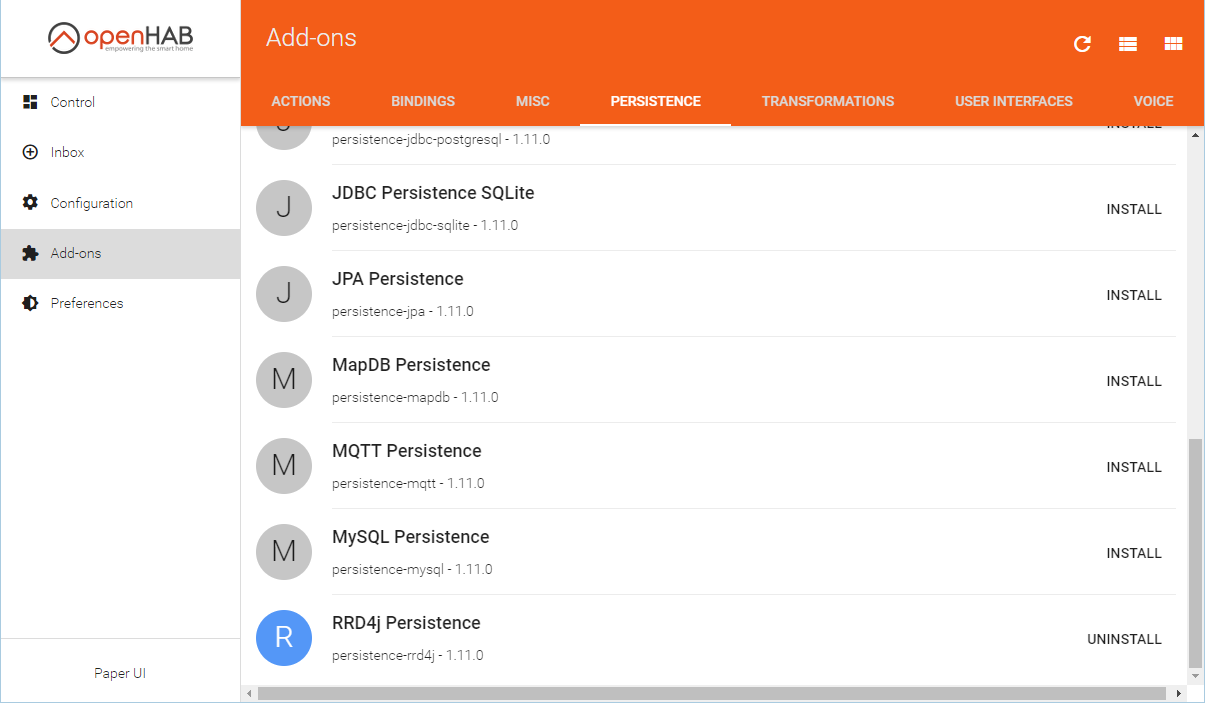
First you need to install a plugin for rrd4j. Fortunately, it is in the repository.
The save setting is made in the /etc/openhab2/persistence/rrd4j.persist file. As can be understood from the path and name, it is possible to save different data to different backends because for each of them there will be a file with a schedule and a list of items.
The file consists of two groups of settings - a strategy, where the save interval in the Quartz syntax and elements are set, where strategies are set for items or groups.
In my example below, gTemperature is a group that includes both items for temperature sensors (groups need to put an asterisk after the name, otherwise the value of the group, and not its members, will be saved).
Save the file, it will be re-read automatically. As you can see, we save sensor values every minute. Now this is the best option; and why so - I will tell below.
Where is the data stored? In the / var / lib / openhab2 / persistence / rrd4j / folder. There will be created a file for each item, and the file size will be immediately so as to store all the data, including the archive. This is declared as an important feature of RRD storages - the file does not grow uncontrollably.
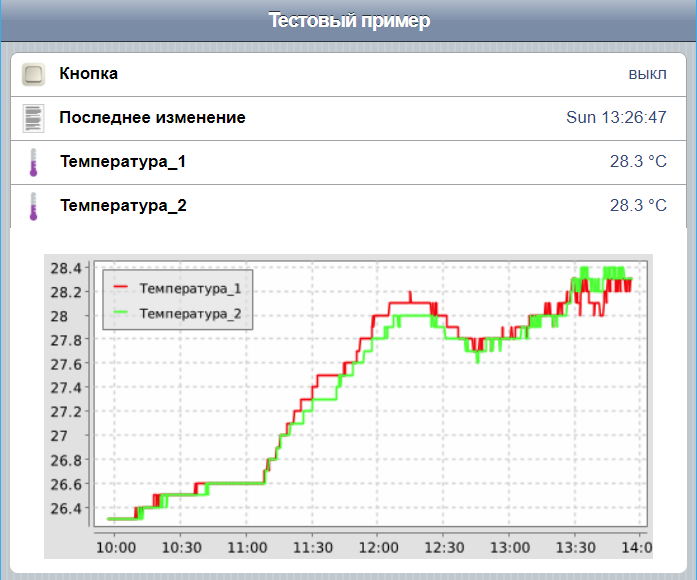
Well, since everything is fine, add graphics to yourself in the sitemap:
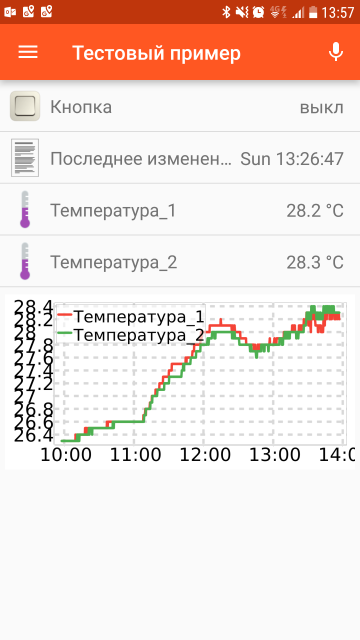
Here’s how it looks on screen:
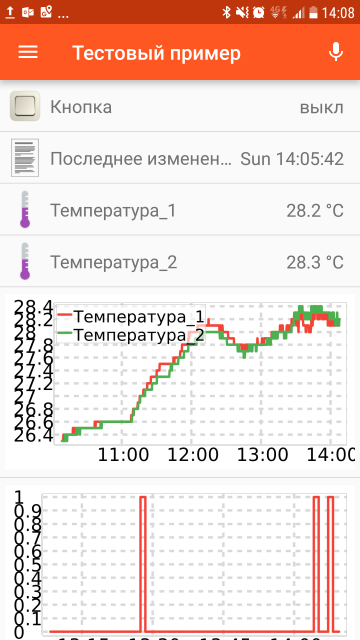
By the way, there are also graphics in the mobile application:
Another interesting feature of rrd4j (and the original RRDTools) is the built-in graphics rendering engine. In OpenHab, such a graph can be inserted in another UI - HabPanel. It looks old school:
The engine is available directly from the link. It should look something like this:
w and h - the size of the graph in pixels. The groups parameter specifies the names of the groups to display. For individual items you need to use the items parameter. If you need to show several groups / parameters, you must specify them separated by commas
Okay, how does it all work? How often is the value stored? How much is stored? Anyway, rrd4j has a lot of settings, but we didn’t do anything!
To view the current storage, we will use a graphical utility that runs with the plugin for OpenHab. There are no X on my test server, so I copied the data files and the .jar plug-in to the main Windows machine.
To run, of course, you need Java. It has a cool feature to run any appropriate class from .jar by name. We need org.rrd4j.inspector.RrdInspector and run it like this:
And this is what we will see for our archive:
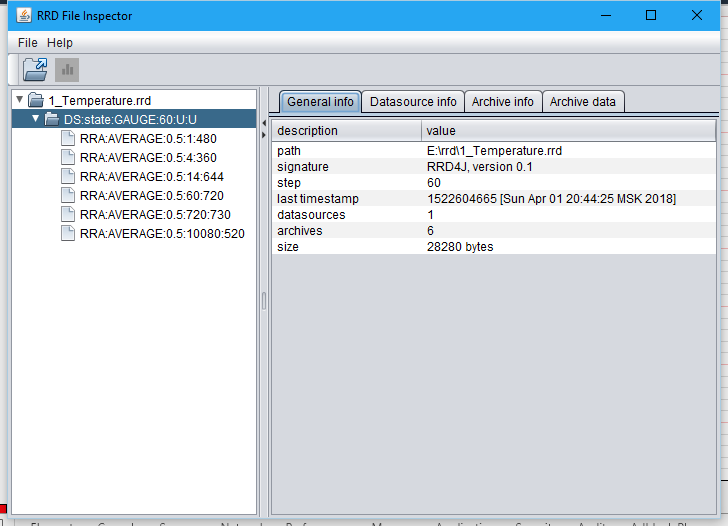
Here lies the reason that there is no point in storing value more than once a minute! The data is recorded in the storage every 60 seconds, and if you try to save more often, the average of all values will be recorded.
It's time to consider configuring rrd4j, because I would like to take sensor readings more often. Yes, and I also want to record the state of the button, and not to store the average (what is the use of the button?), But the maximum value for the period, in order to know whether the button was pressed during the specified period.
As you already understood, the default configuration does not suit us. So it would be nice to change it. Storage settings are in /etc/openhab2/services/rrd4j.cfg. Now the file is empty, but there is a syntax hint above.
So, above, I already wrote common words on the format. Now it's time to do the configuration. As you can see from the example, the settings are in two lines: .def and .archives. In the .items parameter, items are listed through which the configuration will be applied. Those parameters for which there is no configuration of their own will be saved with the default settings (we saw them above in the Java Viewer).
Make settings for thermometers:
As you can see, the syntax is somewhat different from the classic RRDTools. In .def we set the value type to GAUGE - this is the storage of absolute values. Next is the heartbeat, the minimum, and the maximum possible values. And step.
Step is the normal interval between counts in seconds. I chose 15, as I wanted.
Hearbeat is added to step and this is the maximum time interval to save the value. If during this time (step + heartbeat = 30 seconds in my case) the value is not recorded, then rrd4j will save in the countdown NaN.
In .archives I set storage options. Everything that is written to the file is configured here. As you can see, there may be several archives. The syntax of one archive is given in the description in the file.
I use AVERAGE as an aggregate function. I have a temperature and when combining samples, I need to keep the average. Next is the xff parameter, which is poorly described on the Internet. I had to go to the source. It turned out to be a coefficient (in fact, a percentage), which determines at what amount of NaN, when grouping, the final NaN is recorded.
For example, for the second archive, where 4 values are combined, with a coefficient of 0.5, the final NaN will be recorded if two or more initial values are NaN.
The following parameters specify how many initial values are recorded in one archive and how many archive values need to be stored (overwritten cyclically).
In my setup, I created three archives with the following parameters:
• Store each value, a total of 960 pieces (960 * 15 seconds = 4 hours).
• Store the average of four values, a total of 1,440 pieces (1,440 * 15 seconds = 24 hours).
• Store the average of 20 values, total 2016 pieces (2016 * 15 seconds = 7 days).
We fix skills. Button settings:
Here I save the values every 60 seconds and keep the maximum.
Yes. If in the persistence setting you specify saving more often than step in the rrd4j config, then the storage will group the values by the aggregate function from the first archive.
Now let's go back to the OpenHab setup (I bring only the Items part):
I asked for thermometers save every 15 seconds and set the settings for the button. We will save it every minute when changing, which together with the aggregate function MAX will allow you to record 1 in the archive if the button was pressed at least once for a minute.
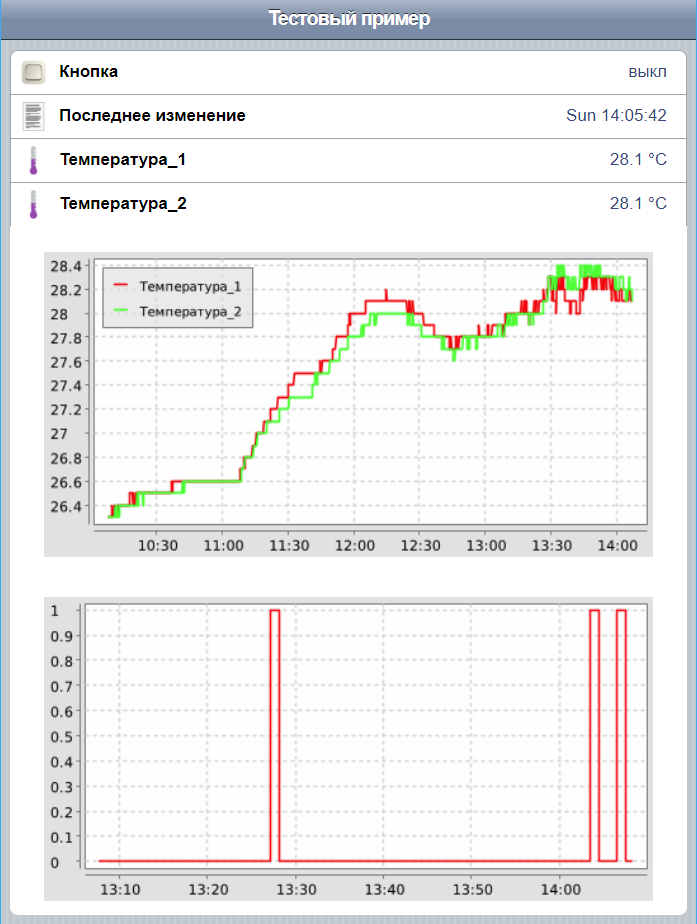
I finish sitemap and see what I see:
OpenHab is a good solution for smart home and home automation. Use and expand the Russian community!
An important feature of OpenHab is modularity. By itself, the server provides basic functions (even without any UI). The rest of the functionality is provided by plugins. One type of plug-in is persistence - providing the ability to store history values for items (device parameters). This is necessary to display historical data (graphics) and restore the state of items when the server is restarted.
Existing plugins allow you to use all popular databases for storage. I will tell you about setting up a very interesting backend - rrd4j. This is a high-performance storage for data that is a series of values associated with time. The author was inspired by the RRDTools suite, but rewrote its functionality in Java (OpenHab is also written in Java), optimized and expanded the functionality. The rrd4j repository files are not compatible with RRDTools files.
Here you need to tell what is this repository. This is one or more cyclic buffers that store parameter values with a time reference. At the same time, it is possible to aggregate several changes into one buffer value (for example, to take data every minute, and to store one average value for 5 minutes).
')
So, we have the installation of OpenHab2 without persistence. For tests, I will use this kind of board:
There are two Dallas 18B20 thermometers and a button on the board.
To communicate with the server, it uses MySensors. By the way, the plug-in for the MySensors protocol, for some reason, is not in the repository, so you need to install it with your hands, download from the forum thread and put it in the / usr / share / openhab2 / addons / folder.
A typical gateway with the same radio module is connected to the server via USB.
Firmware for board
// Enable debug prints to serial monitor #define MY_DEBUG // Enable and select radio type attached #define MY_RADIO_NRF24 // Static node id #define MY_NODE_ID 1 #include <MySensors.h> #include <DallasTemperature.h> #define SKETCH_NAME "Test board" #define SKETCH_MAJOR_VER "1" #define SKETCH_MINOR_VER "0" // Item IDs #define CHILD_ID_BTN 3 #define CHILD_ID_TEMP 10 // Pin definitions #define PIN_BTN 2 #define PIN_BTN_LED 3 #define PIN_ONE_WIRE 7 // Messages MyMessage msgBtn(CHILD_ID_BTN, V_STATUS); MyMessage msgTemp(CHILD_ID_TEMP, V_TEMP); //OneWire temperature OneWire oneWire(PIN_ONE_WIRE); DallasTemperature temp(&oneWire); #define MAX_TEMP_SENSORS 10 int cntSensors = 0; // Don't support hotplug float arrSensors[MAX_TEMP_SENSORS]; DeviceAddress arrAddress[MAX_TEMP_SENSORS]; void before() { temp.begin(); } void presentation() { // Send the sketch version information to the gateway and Controller sendSketchInfo(SKETCH_NAME, SKETCH_MAJOR_VER "." SKETCH_MINOR_VER); // Present locally attached sensors present(CHILD_ID_BTN, S_BINARY); cntSensors = temp.getDeviceCount(); if (cntSensors > MAX_TEMP_SENSORS) cntSensors = MAX_TEMP_SENSORS; Serial.print("Temperature sensors found:"); Serial.print(cntSensors); Serial.println("."); for (int i = 0; i < cntSensors; i++) { present(CHILD_ID_TEMP + i, S_TEMP); arrSensors[i] = 0; temp.getAddress(arrAddress[i], i); } } void setup() { // Setup locally attached sensors pinMode(PIN_BTN, INPUT_PULLUP); pinMode(PIN_BTN_LED, OUTPUT); temp.setWaitForConversion(false); temp.setResolution(12); // 0,0625 grad celsius } void loop() { // Send locally attached sensor data here static unsigned long owNextConversTm = 0; if (0 == owNextConversTm) { temp.requestTemperatures(); int16_t owConversTm = temp.millisToWaitForConversion(temp.getResolution()); owNextConversTm = millis() + owConversTm + 50; // Wait a little more } else if (owNextConversTm < millis() && temp.isConversionComplete()) { for (int i = 0; i < cntSensors; i++) { if (temp.validFamily(arrAddress[i])) { int t1 = temp.getTempC(arrAddress[i]) * 10; float t = t1 / 10 + (t1 % 10) * 0.1; if (t != arrSensors[i]) { send(msgTemp.setSensor(CHILD_ID_TEMP + i).set(t, 1)); arrSensors[i] = t; Serial.print("Sensor #"); Serial.print(i); Serial.print(", temperature: "); Serial.print(t); Serial.println(" C."); } } } owNextConversTm = 0; } else if ((owNextConversTm + 30000) < millis()) { // It was couter reset owNextConversTm = 0; } static int currVal = HIGH; int val = digitalRead(PIN_BTN); if (val != currVal) { digitalWrite(PIN_BTN_LED, val == HIGH ? LOW : HIGH); send(msgBtn.set(val == LOW)); currVal = val; Serial.print("Btn state changed to "); Serial.println(val == HIGH ? "off." : "on."); } } Yes, I prefer to use ClassicUI (and the UI in OpenHab is also a plug-in). I want to add a graph for two thermal sensors (see them on the same graph).
First you need to install a plugin for rrd4j. Fortunately, it is in the repository.
The save setting is made in the /etc/openhab2/persistence/rrd4j.persist file. As can be understood from the path and name, it is possible to save different data to different backends because for each of them there will be a file with a schedule and a list of items.
The file consists of two groups of settings - a strategy, where the save interval in the Quartz syntax and elements are set, where strategies are set for items or groups.
Strategies { // Strategy name // | Seconds // | | Minutes // | | | Hours // | | | | Day of month // | | | | | Month // | | | | | | Day of week // | | | | | | | Year every5sec : "0/5 * * * * ?" every15sec : "0/15 * * * * ?" everyMinute : "0 * * * * ?" every30min : "0 30 * * * ?" everyHour : "0 0 * * * ?" everyDay : "0 0 0 * * ?" default = everyChange } Items { gTemperature* : strategy = everyMinute, restoreOnStartup } In my example below, gTemperature is a group that includes both items for temperature sensors (groups need to put an asterisk after the name, otherwise the value of the group, and not its members, will be saved).
Save the file, it will be re-read automatically. As you can see, we save sensor values every minute. Now this is the best option; and why so - I will tell below.
Where is the data stored? In the / var / lib / openhab2 / persistence / rrd4j / folder. There will be created a file for each item, and the file size will be immediately so as to store all the data, including the archive. This is declared as an important feature of RRD storages - the file does not grow uncontrollably.
root@chubarovo:/etc/openhab2# ll -h1 /var/lib/openhab2/persistence/rrd4j/ total 78K drwxr-xr-x 2 openhab openhab 4.0K Apr 7 21:53 ./ drwxr-xr-x 5 openhab openhab 4.0K Feb 18 18:59 ../ -rwxr-xr-x 1 openhab openhab 32 Dec 18 15:44 Readme.txt* -rw-r--r-- 1 openhab openhab 35K Apr 7 21:54 Test_temp1_soc.rrd -rw-r--r-- 1 openhab openhab 35K Apr 7 21:54 Test_temp2_soc.rrd Well, since everything is fine, add graphics to yourself in the sitemap:
sitemap test label=" " { Text item=Test_button_soc label=" [MAP(ru.map):%s]" Text item=Test_temp1_soc Text item=Test_temp2_soc Chart item=gTemperature refresh=60000 period=4h } Here’s how it looks on screen:
By the way, there are also graphics in the mobile application:
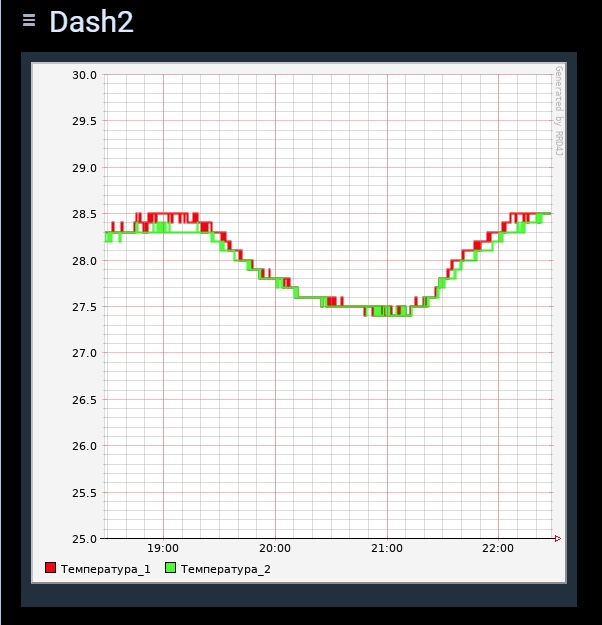
Another interesting feature of rrd4j (and the original RRDTools) is the built-in graphics rendering engine. In OpenHab, such a graph can be inserted in another UI - HabPanel. It looks old school:
The engine is available directly from the link. It should look something like this:
http://192.168.144.243:8080/rrdchart.png?groups=gTemperature&theme=black&period=h&h=464&w=447w and h - the size of the graph in pixels. The groups parameter specifies the names of the groups to display. For individual items you need to use the items parameter. If you need to show several groups / parameters, you must specify them separated by commas
Okay, how does it all work? How often is the value stored? How much is stored? Anyway, rrd4j has a lot of settings, but we didn’t do anything!
To view the current storage, we will use a graphical utility that runs with the plugin for OpenHab. There are no X on my test server, so I copied the data files and the .jar plug-in to the main Windows machine.
To run, of course, you need Java. It has a cool feature to run any appropriate class from .jar by name. We need org.rrd4j.inspector.RrdInspector and run it like this:
java -cp rrd4j-2.1.1.jar org.rrd4j.inspector.RrdInspector And this is what we will see for our archive:
Here lies the reason that there is no point in storing value more than once a minute! The data is recorded in the storage every 60 seconds, and if you try to save more often, the average of all values will be recorded.
It's time to consider configuring rrd4j, because I would like to take sensor readings more often. Yes, and I also want to record the state of the button, and not to store the average (what is the use of the button?), But the maximum value for the period, in order to know whether the button was pressed during the specified period.
As you already understood, the default configuration does not suit us. So it would be nice to change it. Storage settings are in /etc/openhab2/services/rrd4j.cfg. Now the file is empty, but there is a syntax hint above.
So, above, I already wrote common words on the format. Now it's time to do the configuration. As you can see from the example, the settings are in two lines: .def and .archives. In the .items parameter, items are listed through which the configuration will be applied. Those parameters for which there is no configuration of their own will be saved with the default settings (we saw them above in the Java Viewer).
Make settings for thermometers:
# each 15 sec temps.def=GAUGE,15,0,100,15 # 4h/15s : 1m/24h : 5m/7d temps.archives=AVERAGE,0.5,1,960:AVERAGE,0.5,4,1440:AVERAGE,0.5,20,2016 temps.items=Test_temp1_soc,Test_temp2_soc As you can see, the syntax is somewhat different from the classic RRDTools. In .def we set the value type to GAUGE - this is the storage of absolute values. Next is the heartbeat, the minimum, and the maximum possible values. And step.
Step is the normal interval between counts in seconds. I chose 15, as I wanted.
Hearbeat is added to step and this is the maximum time interval to save the value. If during this time (step + heartbeat = 30 seconds in my case) the value is not recorded, then rrd4j will save in the countdown NaN.
In .archives I set storage options. Everything that is written to the file is configured here. As you can see, there may be several archives. The syntax of one archive is given in the description in the file.
I use AVERAGE as an aggregate function. I have a temperature and when combining samples, I need to keep the average. Next is the xff parameter, which is poorly described on the Internet. I had to go to the source. It turned out to be a coefficient (in fact, a percentage), which determines at what amount of NaN, when grouping, the final NaN is recorded.
For example, for the second archive, where 4 values are combined, with a coefficient of 0.5, the final NaN will be recorded if two or more initial values are NaN.
The following parameters specify how many initial values are recorded in one archive and how many archive values need to be stored (overwritten cyclically).
In my setup, I created three archives with the following parameters:
• Store each value, a total of 960 pieces (960 * 15 seconds = 4 hours).
• Store the average of four values, a total of 1,440 pieces (1,440 * 15 seconds = 24 hours).
• Store the average of 20 values, total 2016 pieces (2016 * 15 seconds = 7 days).
We fix skills. Button settings:
# each 60 sec temps.def=DERIVE,60,0,100,60 # 6h/60s : 5m/24h : 5m/7d temps.archives=MAX,0.5,1,360:MAX,0.5,5,288:MAX,0.5,30,336 temps.items=Test_button_soc Here I save the values every 60 seconds and keep the maximum.
Yes. If in the persistence setting you specify saving more often than step in the rrd4j config, then the storage will group the values by the aggregate function from the first archive.
Now let's go back to the OpenHab setup (I bring only the Items part):
Items { gTemperature* : strategy = every15sec, restoreOnStartup Test_button_soc : strategy = everyMinute, everyChange } I asked for thermometers save every 15 seconds and set the settings for the button. We will save it every minute when changing, which together with the aggregate function MAX will allow you to record 1 in the archive if the button was pressed at least once for a minute.
I finish sitemap and see what I see:
OpenHab is a good solution for smart home and home automation. Use and expand the Russian community!
Source: https://habr.com/ru/post/353030/
All Articles