Better way To Code
From the translator:
I am neither a professional programmer nor a professional translator, but the appearance of the tool described in the article from the creator of the popular library
I was surprised to find that on Habré, and indeed on the Russian-language Internet, they have unjustly ignored this tool for more than a year. Therefore, I decided that I was simply obliged to contribute to the development of the art of programming, in JavaScript in particular.
Meet d3.express, an integrated research environment.
(since January 31, 2018 d3.express is called Observable and lives on beta.observablehq.com )
If you have ever had to blunt your code or understand someone else's, then you are not alone. This article is for you.
')
For the last eight years I have been developing tools for visualizing information. The most successful result of my efforts was the js-library D3 . However, the danger of such a long development of tools is that you forget why you are doing this : the tool becomes an end in itself, the benefits of its use fade into the background.
The purpose of the visualization tool is to build visualizations. But what is the purpose of visualization? A word to Ben Shneiderman (Per Ben Shneiderman):
These tasks are often solved with code. Alas, programming is damn hard! The name itself already suggests incomprehensibility. The word "programming" ( "Code" ) comes from machine code : low-level instructions executed by the processor. Since then, the code has become more friendly, but there is still a long way to go.

Ghost in the Shell (1995)
As a prime example, here is the Bash team for generating a background California population density map . It only returns a simplified geometry. A few more commands are needed to get the SVG.

This is not a machine code. From the point of view of the machine, this is a very high-level programming. On the other hand, this cannot be called human language: strange punctuation marks, incomprehensible abbreviations, nesting levels. And two languages: JavaScript clumsily woven into Bash.
Bret Victor gives us this brief definition of programming :
By “characters” he means that we do not directly manipulate the output of our program, but instead work with abstractions. These abstractions can be effective, but they can also be complex in terms of control. In the definition of Donald Norman, this is the abyss of assessment and the abyss of execution ( Gulf of Evaluation and Gulf of Execution ).
But it is obvious that some scripts are easier to read than others. One of the symptoms of a non-human code is “spaghetti”: code without structure and modularity, where in order to understand one part of the program, you must understand the entire program. This is often caused by a shared mutable state . Where part of the structure is modified by different parts of the program, it is very difficult to guess what its meaning is.
Well, in fact, how do we know what exactly the program does? If we cannot track all the states of the environment in our heads, reading the code is not enough. We use logs, debuggers and tests, but these tools are limited. A debagger, for example, can only show a few values at a specific point in time. We continue to experience tremendous difficulties in understanding the code, and can be perceived as a miracle if something basically works.
Despite these problems, we still write code for countless applications, more than ever. Why? Maybe we are masochists? (Maybe) We can't swap? (Partially.) Is there really no better solution?
In general, this critical definition is not. The code is often the best tool in our arsenal, because it is the most complete (general) of what we have; the code has almost unlimited expressiveness. Alternatives to code, as well as high-level software interfaces and languages, feel fine in specific areas. But these alternatives sacrifice universality for the sake of better efficiency in these areas.
If you cannot define a domain ( constrain the domain ), then most likely you will not be able to find a viable alternative to the code. There is no universal substitution, at least as long as people mostly think and communicate through language. It is very difficult to determine the field of science. Science is fundamental: to study the world, to derive meaning from empirical observations, to model systems, to calculate quantitative values.
The tool for promoting discoveries must be able to express new, original thoughts. As we do not use phrasal patterns to compose a written word, we cannot be limited to graphical templates for visualization or a limited list of formulas for statistical analysis. We need more than a configuration. We need a composition of primitives in the formation of our own design.
If our goal is to help people gain insight from observation, we need to consider the problem of how people write code . What Victor said about mathematics can also be applied to the code:
If we can’t get rid of the code, can we at least make it easier for people, with our sacroslike fingers and bounded-size brains?
To clarify this issue, I am building an integrated research environment called Observsable . It serves to analyze data, to understand systems and algorithms, to train and present various programming techniques, as well as to share interactive, visual explanations. In order to make visualization easier and, in turn, easier to make our discoveries, we must first make the programming process easier.
I cannot claim to make the programming process easier . The ideas we want to express, explore, and explain can be irreducibly complex. But reducing the cognitive load when programming, we can make an analysis of quantitative phenomena available for a wider audience.
The first principle of Observable is reactivity. Instead of issuing commands to change the overall state, each part of the state in the reactive program determines how it is calculated, and the environment controls their assessment; the runtime propagates the received state. Instead of issuing commands to change the general state, each part of the state in the reactive program determines how it is calculated, and the environment itself controls their assessment. The medium itself propagates the derived state. If you write formulas in Excel, you perform reactive programming.
Here is a simple notepad in Observable to illustrate reactive programming. A bit like the developer console in the browser besides the fact that our work is saved automatically and we can visit here in the future or share the work with others. And it is also reactive.

in imperative programming,
As programmers, we now only care about the current state. The environment itself manages state changes. This may seem like a minor thing here, but in large programs it removes a significant burden.
The research environment should do more than add up a few numbers, let's try working with the data. To download the data — Apple’s multi-year stock price statistics — we’ll use d3.csv . It uses the Fetch API to load a file from GitHub and then parse it to give us an array of objects.
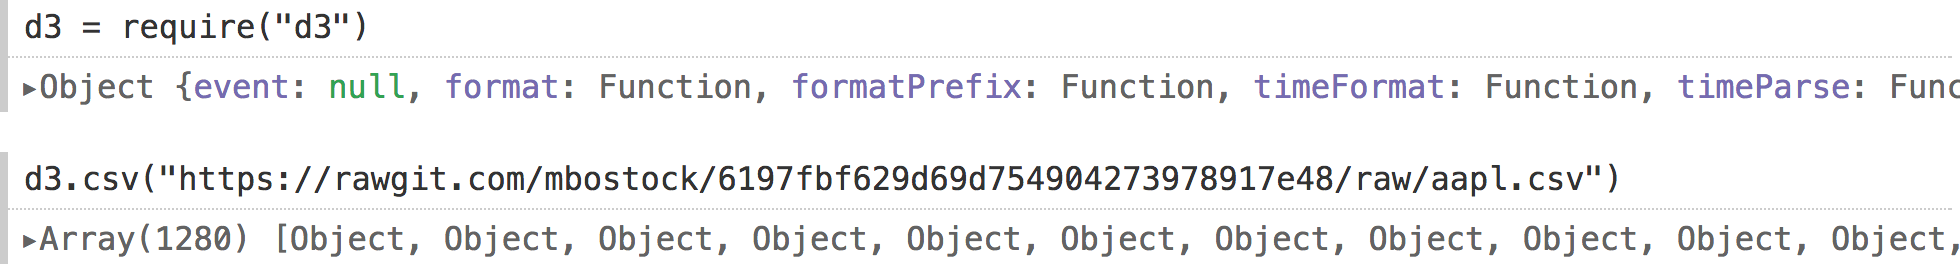
require ('d3') and data request are asynchronous. The imperative code could be a problem , but here we clearly noticed: cells that refer to "d3" are not calculated until the data is loaded.
Reactivity means that we can write most asynchronous code as if it were synchronous.
What does the data look like? Let's get a look:

d3.csv is conservative and does not infer data types such as numbers and strings, so all fields are strings. We need more accurate types. We can convert the “close” field to a number by applying the operator (+) to it and immediately see the effect: the purple line becomes a green number.

To parse the date you need a little more work, since JavaScript does not natively support this format.
Imagine we have a function parseTime, which parses the string and returns the “Date” entity. What happens if we call her?
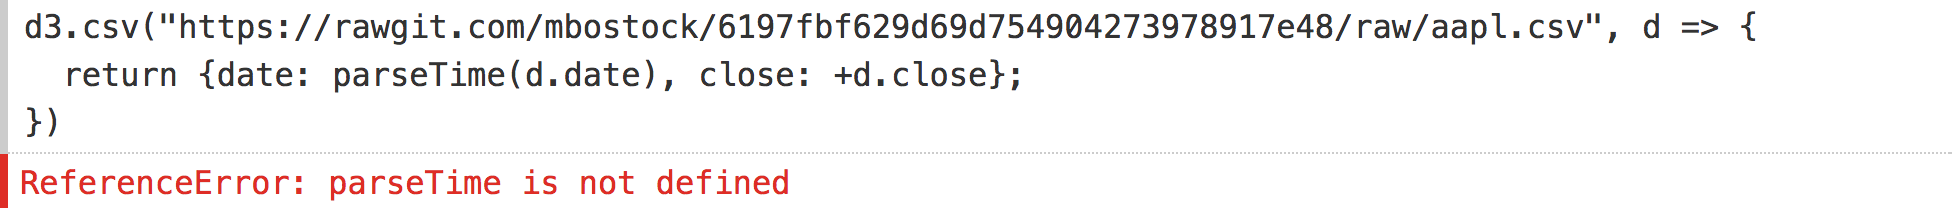
Oops! Threw an error. But the error is both local and temporary: other cells are not affected and it will disappear when we define parseTime. Therefore, notepads in Observable are not only reactive, they are also structured. Global errors no longer exist.
When defining parseTime, we again see the effect: the data is reloaded, parsed, and displayed. We still manipulate abstract symbols, but at least we do it less blindly.

Now we can query the data, say, to calculate the time range:

Oh, we forgot to give the name of the data! Let's fix:
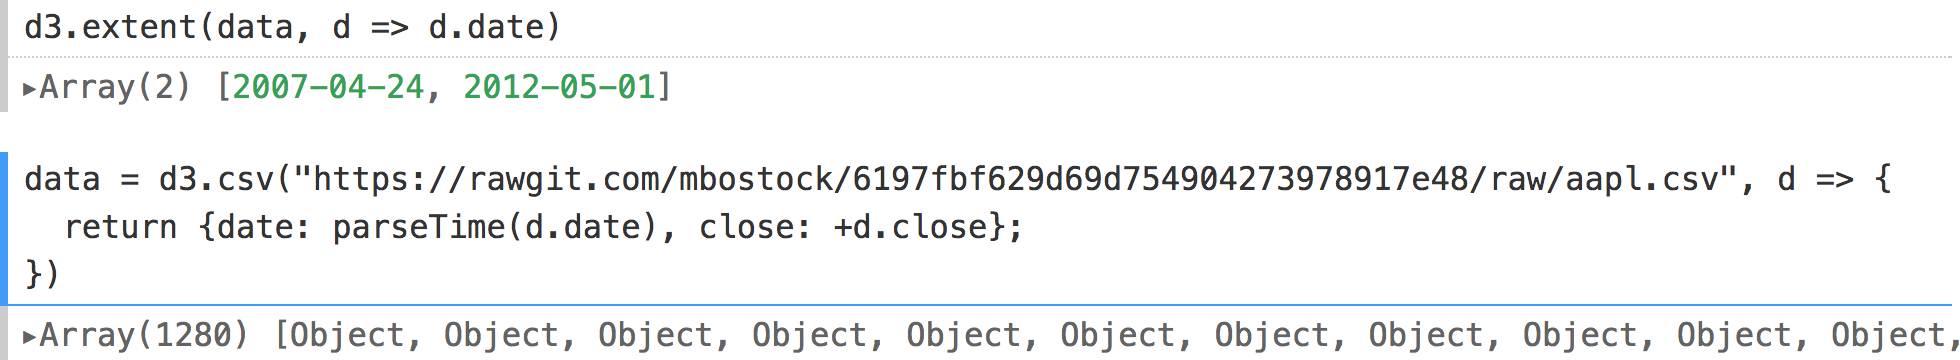
Here we find another “human” feature: cells can be written in any order.
As in the developer console, the result of the execution of the cell in Observable is immediately visible under the code. But unlike the console, Observable cells can display graphical user interfaces! Let's visualize our data on a simple line chart.
First, we define the size of the graphic: width, height, and margin.

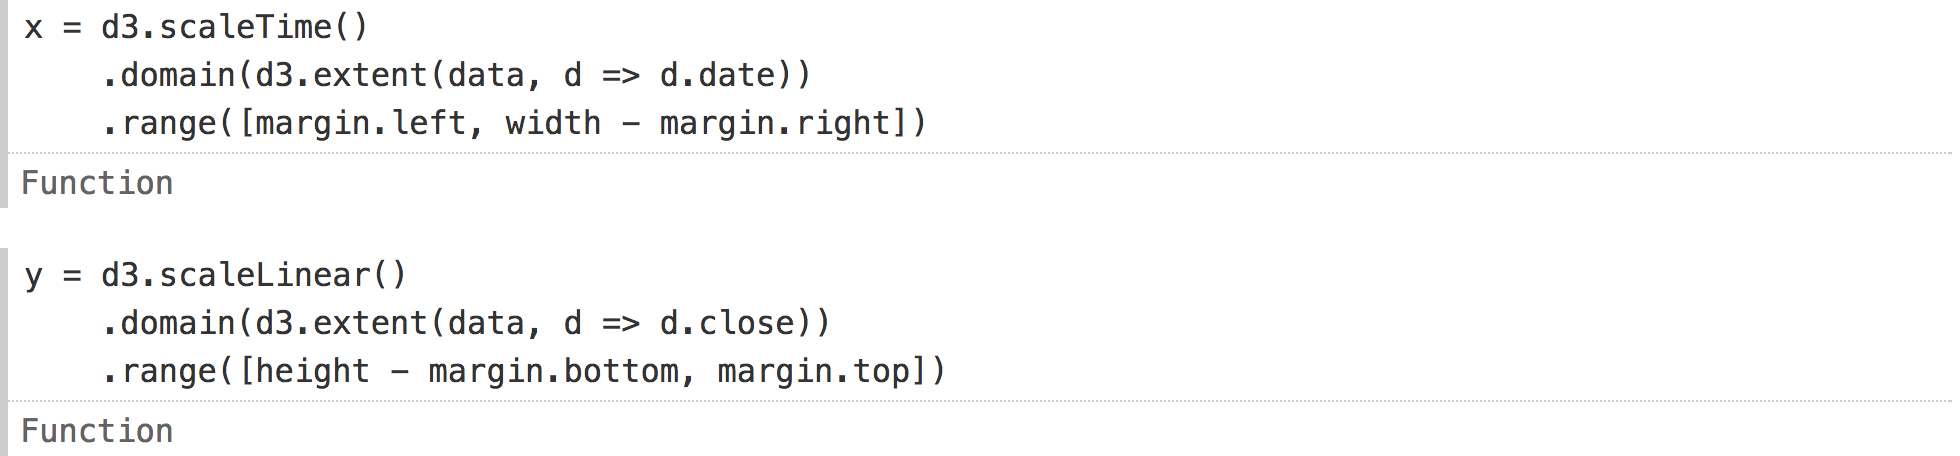
Now the scale : time for x and linear for y.
Finally, the SVG element. Since this definition is more complicated than our previous cells, we can use curly braces ({and}) to define it as a block, not an expression:

DOM.svg is a method for easily calling document.createElementNS . It returns a new SVG node with a certain width and height. Let's extend it to use d3-selection to manipulate the DOM:
I cannot show the code and the chart at the same time due to the limited screen size, so let's first look at the chart as it is assembled. This gives the sensation of visual feedback that you get as the three main components of the chart are determined: the x, y axes and lines.

This animation was made by entering each line of code in order (except for return, as it is needed to see everything):

This is a simple graph, but the topology of the program becomes more complex. Here is a directed acyclic link graph, itself made in Observable, using GraphViz :
Node 93 is an SVG element. A few observations: It is now very easy to make this schedule responsive. The width, height, and margin objects are constants, but if they were dynamic, the axes and the graph itself would be updated automatically. In a similar way, it is also easy to make a graph dynamically redefining data (data). We will see this soon with a streaming example.
But let's take a closer look at the reactive code. In imperative programming, the definition of variables is spread over the entire code, rather than being done in one place. For example, we can collect scaling for the x scale immediately after the page loads, but defer the definition of the domain until data is received.
Such a fragmented definition can be shuffled with other data and affect the purity of the code. It also encourages reuse: self-contained, statusless definitions are easier to copy / import into other documents.
You can create any DOM - HTML, canvas, WebGL, use any libraries you like.
Here is a chart made using Vega Lite :

How about a canvas? Let's say we need a globe. We can load the borders of the countries of the world and apply an orthogonal projection .
( Mesh , if interested, is a combined border, represented as a broken line. I use the mesh method, because this dataset contains polygons, and it is a little faster and more beautiful for rendering such objects. )

A powerful feature of reactive programming is that we can quickly replace a static definition, such as a fixed-size orthogonal projection, with a dynamic definition, such as a rotating projection. The environment itself will redraw the canvas whenever the projection changes.

Dynamic variables in Obsesrvable are implemented as generators , functions that return multiple values. For example, a while-true loop generator produces an infinite stream of values. The medium retrieves a new value from each active generator up to sixty times per second.

(looks better at 60 FPS)
Defining our canvas creates a new canvas every time it starts. This may be acceptable, but we can get better performance by reprocessing the canvas. The previous value of the variable is displayed as

Oh! Using the old

The glitch is easily fixed by cleaning the

So, by making it a bit more complicated, you can improve performance, and the resulting animation has a slight overhead compared to vanilla JavaScript.
If generators are good for animation scenarios, how about interaction? Generators to help again! Only now our generators are asynchronous, returning promises that are allowed whenever a new input appears.
To make the rotation interactive, let's first define the input range. Then we connect it to the generator, which gives the current value of the input whenever it changes. We could implement this generator manually, but there is a convenient built-in method called
Now we substitute the value as the longitude for rotating the interactive globe:

This is a brief definition of the user interface. But we can still reduce it by folding the definitions of

The ability to display arbitrary DOMs and expose arbitrary values to code makes the Observable interfaces very, well ... bright. You are not limited to sliders and drop-down menus. Here is the Cubehelix color picker, implemented as a table of sliders, one for each color channel.

When you drag the slider, its value is updated at the corresponding output, and then the generator displays the current color.

We can create any graphical interfaces that we want. And we can design smart programming interfaces to present their values to the code. This allows you to quickly create powerful interfaces for exploring data. Here is a bar chart showing the behavior of a few hundred stocks over a five year period. (I shortened the code, but it looks like this .)
In other environments, a histogram like this may be a visual dead end. You can look at it, but to check the base values you need to separately request data in the code. In Obsesrvable, we can quickly complete the visualization, and show the selection interactively. Then we can see the data under the cursor by direct manipulation.
The default object inspector is used here, but you can do anything online, for example, live totals, real-time statistics, or even associated visualizations.
To show that this is not magic, the code for adapting the d3-brush to Obsesrvable is given above. Upon the
By default, reactions occur instantaneously: when the value of a variable changes, the runtime recalculates derived variables and immediately updates the display. But such urgency is not always required and sometimes it is useful to animate transitions for a sense of the reality of an object . Here, for example, we can follow the columns as they are re-sorted:

Understanding the implementation of this diagram requires familiarity with D3, namely: keyed data and step transition , but even if this code is opaque, it hopefully demonstrates that today's open source libraries are easily used in Obsesrvable.
The visual output of the program helps to better perceive the current state of the program. Interactive programming helps to more thoroughly analyze the behavior of the program by typing: changing, deleting, reordering and observing what is happening.
For example, by removing the binding forces in the comments in the graph below, we better understand their contribution to the overall arrangement of the figures.
(Watch YouTube on how I play with it.)
You must have seen similar toys — for example, Steve Haroz has a great sandbox for d3-force. Here you do not need to create a user interface for playback; it comes free with interactive programming!
A more detailed approach to studying the behavior of the program is to supplement the code to display the internal state. Generators also help here. We can take a normal function like this to sum up an array of numbers:
And turn it into a generator that produces a local state at run time, in addition to the normal return value at the end:

Then, to understand the behavior, we can visualize or check the internal state . This approach provides a clear separation between our implementation of the algorithm and its study, rather than the implementation of the visualization code directly inside the algorithm.

As an example, let's look at the hierarchical packing structure of circles D3 .

We have a set of circles that we want to pack in as little space as possible without overlapping, like a cluster of penguins in Antarctica. Our task is to place the circles one by one until all the circles are placed.
Since we want the circles to be packed as tightly as possible, it is rather obvious that each circle we place must touch at least one ( actually two ) circles that we have already placed. But if we randomly select an existing circle as a tangent circle, we will spend a lot of time putting the new circle in the middle of the pack, where it will overlap other circles. Ideally, we only consider circles that are outside the package. But how can we effectively determine which circles are outside?

Wang's algorithm supports the "external chain", shown here in red, which represents these outer circles. When placing a new circle, he chooses a circle in the front chain, which is closest to the beginning. A new circle is located next to this circle and its neighbor on the front chain.
If this placement does not overlap with any other circle in the front chain, the algorithm proceeds to the next circle. If it overlaps, then we cut the front chain between the tangent circles and the overlapping circle, and the overlapping circle becomes a new touching circle. We repeat this process until there is an overlap.

I find this animation fascinating. If you look closely, you will see brief moments when a large circle is squeezed out of the package when the front chain is cut. This is not only pleasing to the eye, but also extremely useful for identifying a long-standing error in the implementation of D3, where very rarely it would overlap the wrong side of the front chain and the circles would overlap.
After we have assembled our circles, we need to calculate the circumference for packing so that the circular packing can be repeated along the hierarchy. The usual way to do this is to scan the front chain for a circle that is furthest from the origin. This is quite a decent assumption, but not accurate. Fortunately, there is a simple extension of the Welzl algorithm ( Welzl ) to calculatesmallest closed circle in linear time.

To see how the Welz algorithm works, suppose we already know the outer circle for some circles and want to include a new circle in it. If the new circle is inside the current circle, we can move on to the next circle. If the new circle is outside the vicious circle, we must expand the circle.


When the circle is outside a closed circle (left), it should touch the new outer circle (right).
However, we know something about this new circle: it is the only circle that is outside the outer circle and, therefore, it must touch the new outer circle. And if we know how to find one touching circle for the outer circle, we can find others recursively!
There is a bit of geometry, I am a bit of a hack, of course. We also need to calculate the boundary cases for recursion: outer circles for one, two, or three tangent circles. (This is the problem of Apollonius ) Geometry also dictates that there can be no more than three tangent circles, or the environment already contains all the circles, so we know that our recursive approach will eventually end.
Here is a more complete overview of the recursive algorithm showing the stack:

The left one is the uppermost level, where the set of contiguous circles is empty. The algorithm is repeated every time a new circle is outside the circle. During recursion, this new circle must be placed on a set of circles in contact with it. So, from left to right, there are zero, one, two, and three adjoining circles painted in black.
In addition to explaining how the algorithm works, this animation gives a sense of time that the algorithm spends at different levels of recursion. Since it processes the circles in a random order, the spanning circle expands quickly to bring the final answer closer. But whenever he repeats, he must reinstall all previous circles to make sure that they fit into the new surrounding circle.
One way to write less code is to reuse it. 440,000 or so packages published in npm indicate the popularity of this approach.
But libraries are an example of active reuse: they must be intentionally designed for reuse. And this is a significant burden. It's hard enough to develop an effective overall abstraction! (Contact any open source developer.) Implementing a “one-off” code, as is usually the case in the D3 examples, is simpler because you only need to consider a specific task, not an abstract class of tasks.
I find out if we can have better passive reuse in Observable. Where, using the structure of reactive documents, we can more easily reconfigure the code, even if this code was not specifically designed for reuse.
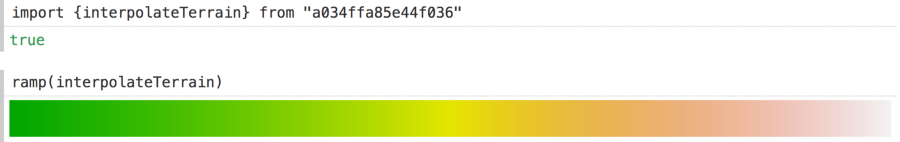
For starters, you can consider de facto notebooks as libraries. Let's say, in one laptop, I implement a custom color scale:

In another notebook, I can import this color scale and use it.
Import is also useful if you have created many notebooks for researching ideas and want to combine them into one unit.
More interestingly, Observable allows you to rebuild variable definitions during import. Here I define stream from real-time data via WebSocket. (again, the details of this code are not critical, for simplicity you can imagine an imaginary library ... )
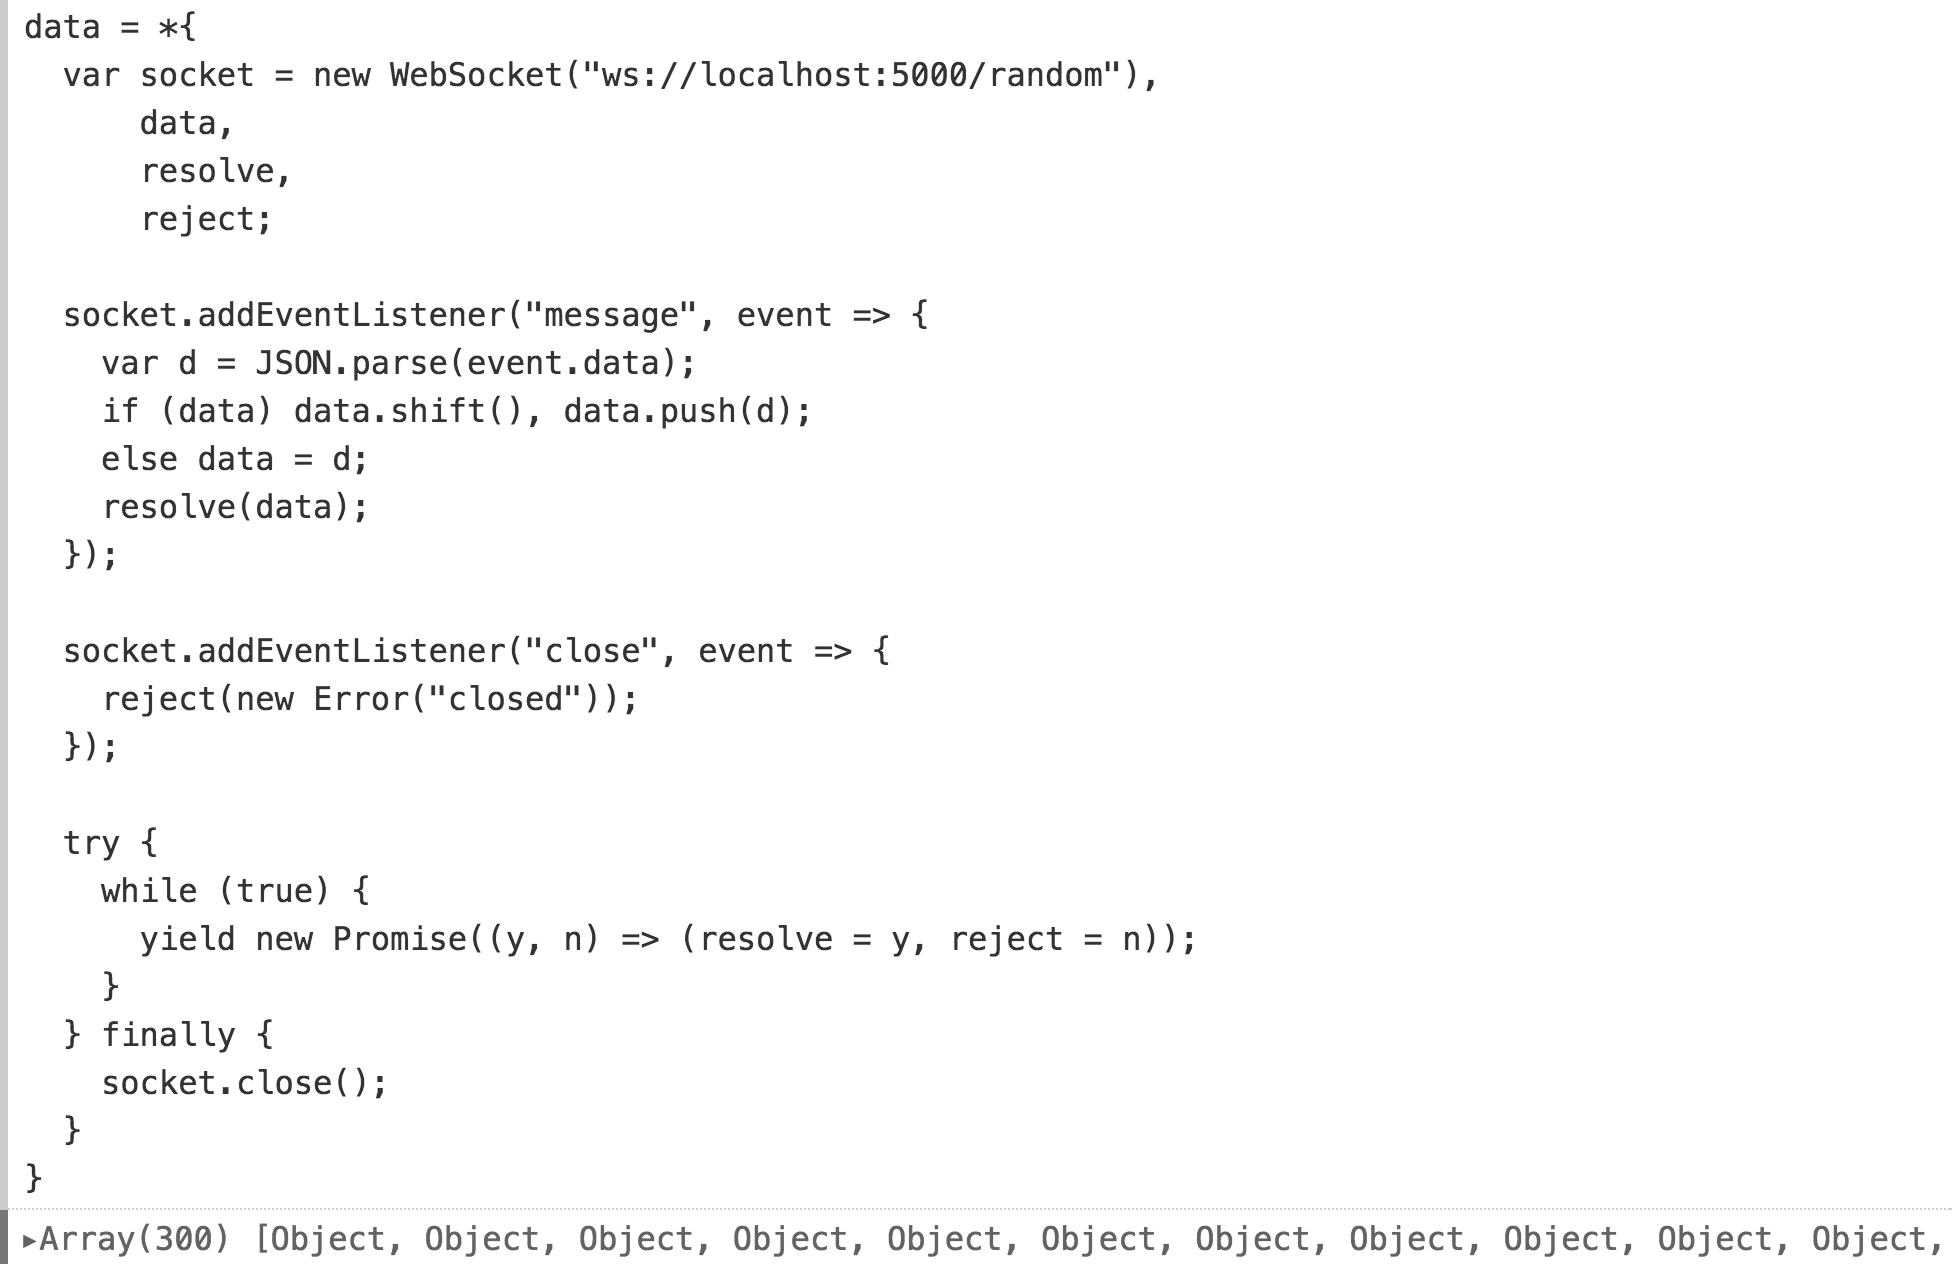
This data set has the same shape as our previous line graph: an array of objects with time and value. Can we reuse this schedule? Aha The operator
We can not only insert our dynamic data into a previously static diagram, but also, if necessary, scale the coordinate axes. Here we change the axle domains
Adding new definitions
Observable notebooks work in a browser, not in a desktop application or in the cloud; There is a server to save your scripts, but all calculations and rendering occur locally in the client. What does it mean to have a research environment on the web?
The web environment encompasses web standards, including vanilla JavaScript and DOM. It works with open source code, be it code snippets that you find on the Internet or in libraries published in npm. This minimizes the specialized knowledge necessary for productive work in a new environment.
There is a new syntax in Observable for reactivity, but I tried to keep it as small and familiar as possible, for example, using generators. These are four forms of variable definition:

The standard library is also minimal and not tied to the platform. You should be able to bring your existing code and knowledge to the Observable and vice versa, pick up your code and knowledge from the Observable.
The web environment first allows your code to work everywhere, because it works in a browser. No need to install anything. It becomes easier for another to repeat and check your analysis. In addition, your code for the study can gracefully go into the code for an explanation . You do not need to start from scratch when you want to share your ideas.
It's great that reporters and scientists share data and code. But the code on GitHub is not always easy to run: you need to play the necessary environment, operating system, application, packages, etc. If your code is already running in the browser, then it runs in any other browser. And that's the beauty of the Internet!
Creating more portable code for analysis can have an impact on our communication style. Once again I will quote Victor :
PS
If you want to help me develop Observable, this is great! Please contact me. You can find my email address on my github profile and connect with me on Twitter .
beta.observablehq.com
Thanks for reading!
I am neither a professional programmer nor a professional translator, but the appearance of the tool described in the article from the creator of the popular library
D3.js made a strong impression on me. I was surprised to find that on Habré, and indeed on the Russian-language Internet, they have unjustly ignored this tool for more than a year. Therefore, I decided that I was simply obliged to contribute to the development of the art of programming, in JavaScript in particular.
Meet d3.express, an integrated research environment.
(since January 31, 2018 d3.express is called Observable and lives on beta.observablehq.com )
If you have ever had to blunt your code or understand someone else's, then you are not alone. This article is for you.
')
For the last eight years I have been developing tools for visualizing information. The most successful result of my efforts was the js-library D3 . However, the danger of such a long development of tools is that you forget why you are doing this : the tool becomes an end in itself, the benefits of its use fade into the background.
The purpose of the visualization tool is to build visualizations. But what is the purpose of visualization? A word to Ben Shneiderman (Per Ben Shneiderman):
"The result of the visualization is enlightenment, not pictures »Visualization is the key. The key to insight . A way to think, understand, reveal and convey something about this world. If we see in visualization only the task of finding visual decoding, then we ignore a host of other tasks: finding meaningful data, cleaning it, transforming it into effective structures, statistical analysis, modeling, explaining our investigations ...
These tasks are often solved with code. Alas, programming is damn hard! The name itself already suggests incomprehensibility. The word "programming" ( "Code" ) comes from machine code : low-level instructions executed by the processor. Since then, the code has become more friendly, but there is still a long way to go.
Ghost in the Shell (1995)
As a prime example, here is the Bash team for generating a background California population density map . It only returns a simplified geometry. A few more commands are needed to get the SVG.
This is not a machine code. From the point of view of the machine, this is a very high-level programming. On the other hand, this cannot be called human language: strange punctuation marks, incomprehensible abbreviations, nesting levels. And two languages: JavaScript clumsily woven into Bash.
Bret Victor gives us this brief definition of programming :
Programming is the blind manipulation of symbols.By “blind,” he means the impossibility of seeing the results of our manipulations. We can edit the program, restart it and see the result. But programs are complex and dynamic, we do not have the ability to directly, directly observe the results of our editing.
By “characters” he means that we do not directly manipulate the output of our program, but instead work with abstractions. These abstractions can be effective, but they can also be complex in terms of control. In the definition of Donald Norman, this is the abyss of assessment and the abyss of execution ( Gulf of Evaluation and Gulf of Execution ).
But it is obvious that some scripts are easier to read than others. One of the symptoms of a non-human code is “spaghetti”: code without structure and modularity, where in order to understand one part of the program, you must understand the entire program. This is often caused by a shared mutable state . Where part of the structure is modified by different parts of the program, it is very difficult to guess what its meaning is.
Well, in fact, how do we know what exactly the program does? If we cannot track all the states of the environment in our heads, reading the code is not enough. We use logs, debuggers and tests, but these tools are limited. A debagger, for example, can only show a few values at a specific point in time. We continue to experience tremendous difficulties in understanding the code, and can be perceived as a miracle if something basically works.
Despite these problems, we still write code for countless applications, more than ever. Why? Maybe we are masochists? (Maybe) We can't swap? (Partially.) Is there really no better solution?
In general, this critical definition is not. The code is often the best tool in our arsenal, because it is the most complete (general) of what we have; the code has almost unlimited expressiveness. Alternatives to code, as well as high-level software interfaces and languages, feel fine in specific areas. But these alternatives sacrifice universality for the sake of better efficiency in these areas.
If you cannot define a domain ( constrain the domain ), then most likely you will not be able to find a viable alternative to the code. There is no universal substitution, at least as long as people mostly think and communicate through language. It is very difficult to determine the field of science. Science is fundamental: to study the world, to derive meaning from empirical observations, to model systems, to calculate quantitative values.
The tool for promoting discoveries must be able to express new, original thoughts. As we do not use phrasal patterns to compose a written word, we cannot be limited to graphical templates for visualization or a limited list of formulas for statistical analysis. We need more than a configuration. We need a composition of primitives in the formation of our own design.
If our goal is to help people gain insight from observation, we need to consider the problem of how people write code . What Victor said about mathematics can also be applied to the code:
The whole arsenal for understanding and predicting the quantitative indicators of our world should not be limited to ridiculous (freakish) tricks on manipulating abstract symbols.Improving our ability to program is not only making workflows more convenient or efficient. This is to enable people to better understand their world.
Introducing the Observable
If we can’t get rid of the code, can we at least make it easier for people, with our sacroslike fingers and bounded-size brains?
To clarify this issue, I am building an integrated research environment called Observsable . It serves to analyze data, to understand systems and algorithms, to train and present various programming techniques, as well as to share interactive, visual explanations. In order to make visualization easier and, in turn, easier to make our discoveries, we must first make the programming process easier.
I cannot claim to make the programming process easier . The ideas we want to express, explore, and explain can be irreducibly complex. But reducing the cognitive load when programming, we can make an analysis of quantitative phenomena available for a wider audience.
1. Reactivity
The first principle of Observable is reactivity. Instead of issuing commands to change the overall state, each part of the state in the reactive program determines how it is calculated, and the environment controls their assessment; the runtime propagates the received state. Instead of issuing commands to change the general state, each part of the state in the reactive program determines how it is calculated, and the environment itself controls their assessment. The medium itself propagates the derived state. If you write formulas in Excel, you perform reactive programming.
Here is a simple notepad in Observable to illustrate reactive programming. A bit like the developer console in the browser besides the fact that our work is saved automatically and we can visit here in the future or share the work with others. And it is also reactive.
in imperative programming,
c=a+b sets c to a+b . This is an assignment of value . If a or b change, c remains in the same value until we perform the new assignment of the value for c . In reactive programming, c=a+b is a variable description. This means that c is always a+b , even if a or b changes. The environment itself maintains the current value c .As programmers, we now only care about the current state. The environment itself manages state changes. This may seem like a minor thing here, but in large programs it removes a significant burden.
The research environment should do more than add up a few numbers, let's try working with the data. To download the data — Apple’s multi-year stock price statistics — we’ll use d3.csv . It uses the Fetch API to load a file from GitHub and then parse it to give us an array of objects.
require ('d3') and data request are asynchronous. The imperative code could be a problem , but here we clearly noticed: cells that refer to "d3" are not calculated until the data is loaded.
Reactivity means that we can write most asynchronous code as if it were synchronous.
What does the data look like? Let's get a look:
d3.csv is conservative and does not infer data types such as numbers and strings, so all fields are strings. We need more accurate types. We can convert the “close” field to a number by applying the operator (+) to it and immediately see the effect: the purple line becomes a green number.
To parse the date you need a little more work, since JavaScript does not natively support this format.
Imagine we have a function parseTime, which parses the string and returns the “Date” entity. What happens if we call her?
Oops! Threw an error. But the error is both local and temporary: other cells are not affected and it will disappear when we define parseTime. Therefore, notepads in Observable are not only reactive, they are also structured. Global errors no longer exist.
When defining parseTime, we again see the effect: the data is reloaded, parsed, and displayed. We still manipulate abstract symbols, but at least we do it less blindly.
Now we can query the data, say, to calculate the time range:
Oh, we forgot to give the name of the data! Let's fix:
Here we find another “human” feature: cells can be written in any order.
Visual output
As in the developer console, the result of the execution of the cell in Observable is immediately visible under the code. But unlike the console, Observable cells can display graphical user interfaces! Let's visualize our data on a simple line chart.
First, we define the size of the graphic: width, height, and margin.
Now the scale : time for x and linear for y.
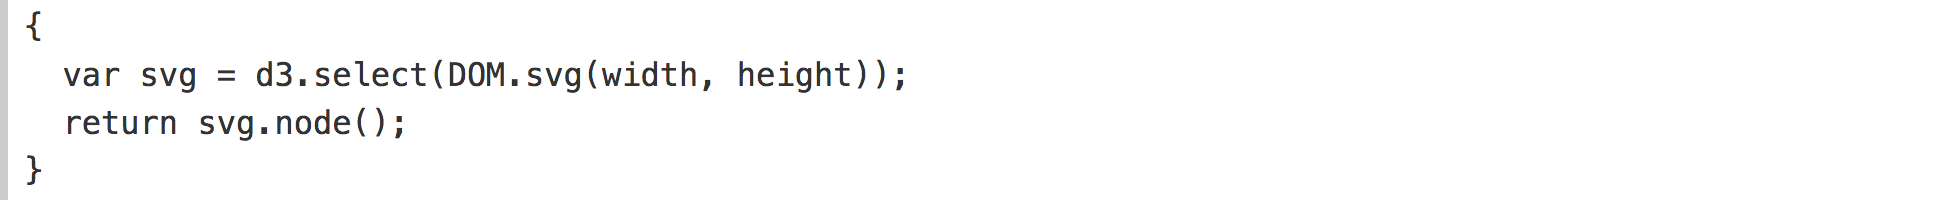
Finally, the SVG element. Since this definition is more complicated than our previous cells, we can use curly braces ({and}) to define it as a block, not an expression:
DOM.svg is a method for easily calling document.createElementNS . It returns a new SVG node with a certain width and height. Let's extend it to use d3-selection to manipulate the DOM:
I cannot show the code and the chart at the same time due to the limited screen size, so let's first look at the chart as it is assembled. This gives the sensation of visual feedback that you get as the three main components of the chart are determined: the x, y axes and lines.
This animation was made by entering each line of code in order (except for return, as it is needed to see everything):
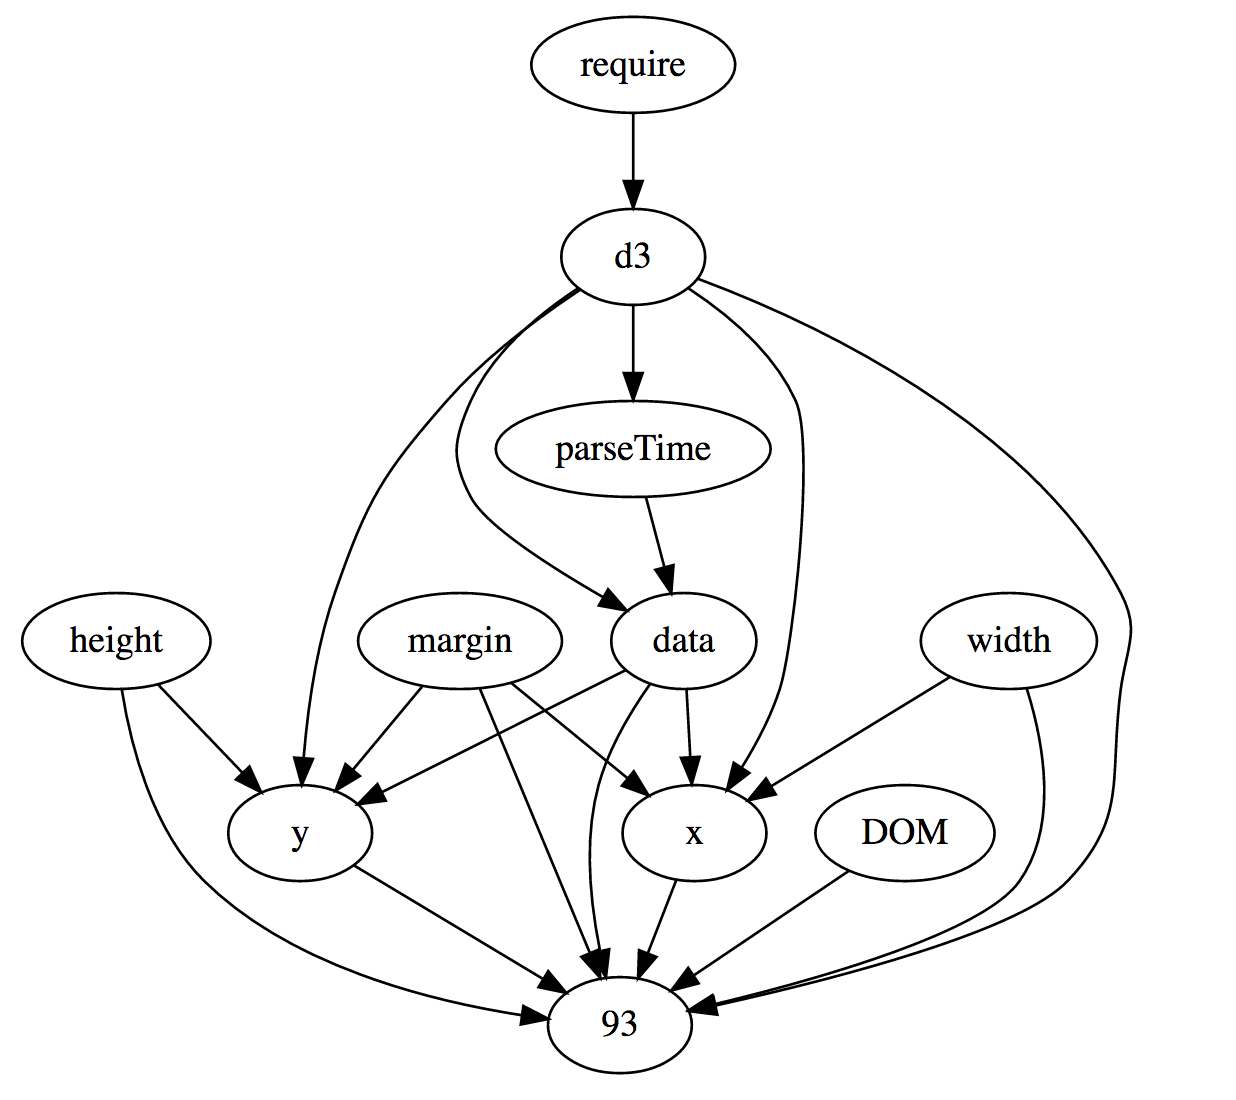
This is a simple graph, but the topology of the program becomes more complex. Here is a directed acyclic link graph, itself made in Observable, using GraphViz :
Node 93 is an SVG element. A few observations: It is now very easy to make this schedule responsive. The width, height, and margin objects are constants, but if they were dynamic, the axes and the graph itself would be updated automatically. In a similar way, it is also easy to make a graph dynamically redefining data (data). We will see this soon with a streaming example.
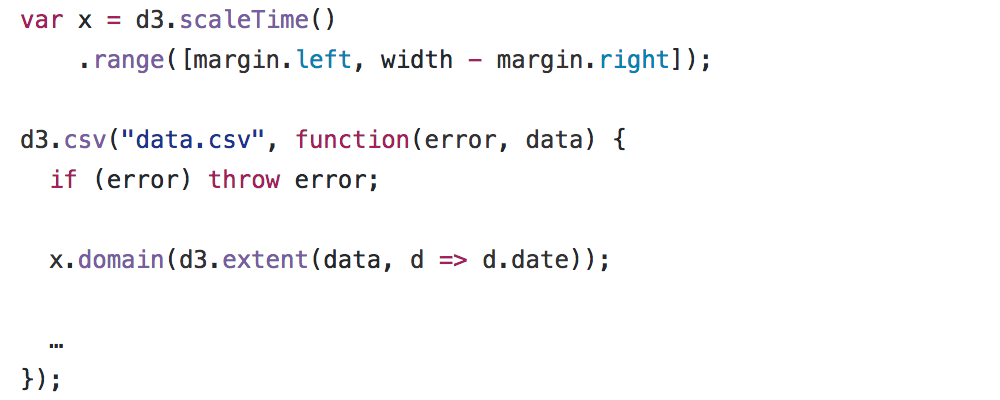
But let's take a closer look at the reactive code. In imperative programming, the definition of variables is spread over the entire code, rather than being done in one place. For example, we can collect scaling for the x scale immediately after the page loads, but defer the definition of the domain until data is received.
Such a fragmented definition can be shuffled with other data and affect the purity of the code. It also encourages reuse: self-contained, statusless definitions are easier to copy / import into other documents.
You can create any DOM - HTML, canvas, WebGL, use any libraries you like.
Here is a chart made using Vega Lite :
Animation
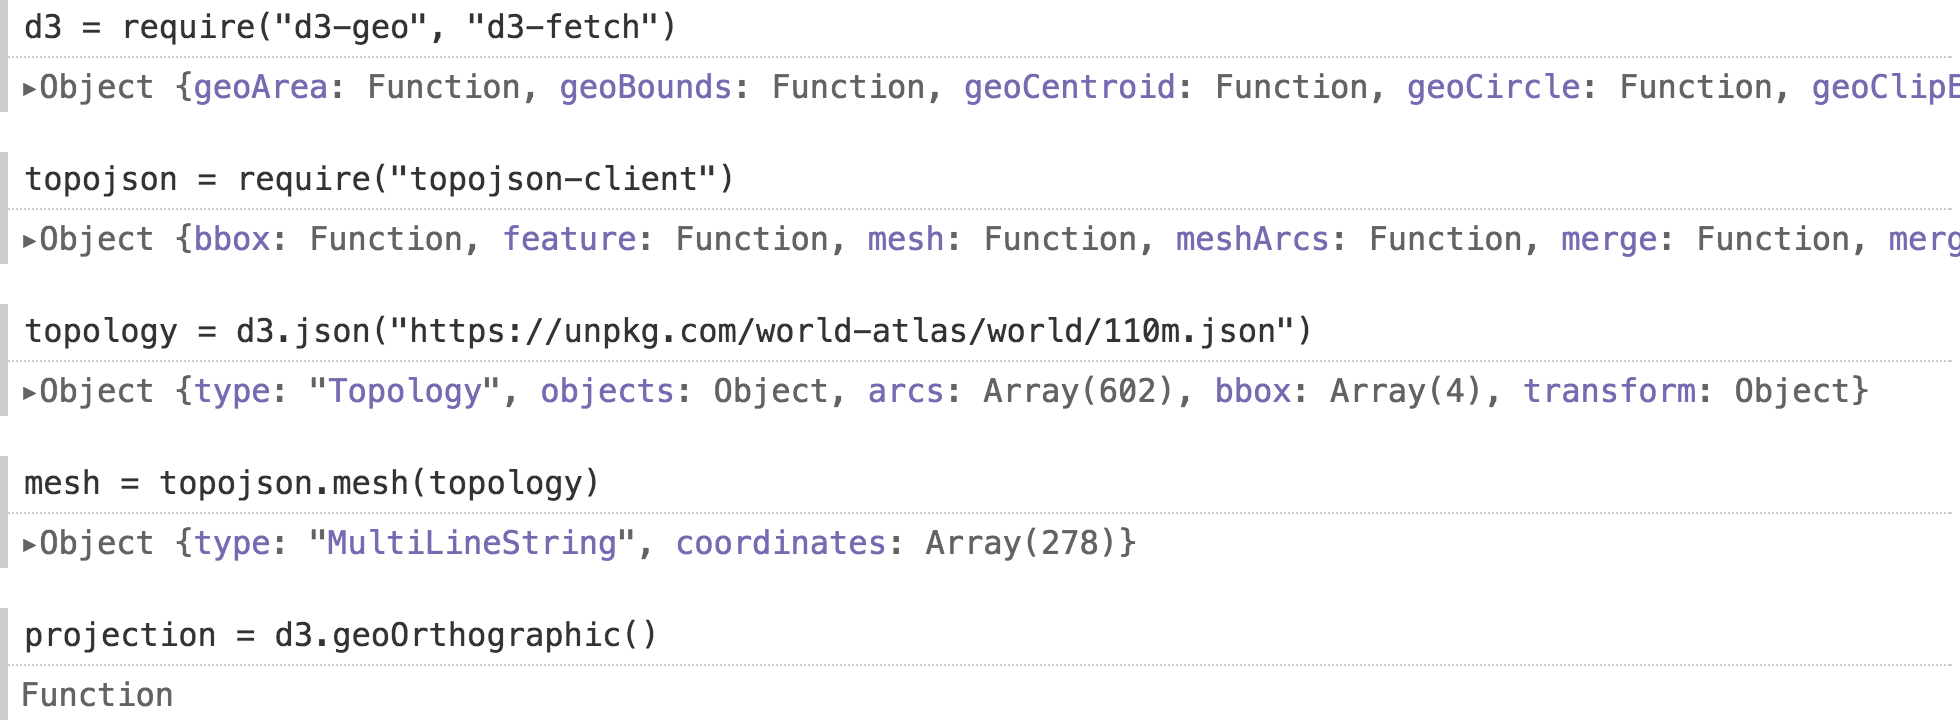
How about a canvas? Let's say we need a globe. We can load the borders of the countries of the world and apply an orthogonal projection .
( Mesh , if interested, is a combined border, represented as a broken line. I use the mesh method, because this dataset contains polygons, and it is a little faster and more beautiful for rendering such objects. )
A powerful feature of reactive programming is that we can quickly replace a static definition, such as a fixed-size orthogonal projection, with a dynamic definition, such as a rotating projection. The environment itself will redraw the canvas whenever the projection changes.
Dynamic variables in Obsesrvable are implemented as generators , functions that return multiple values. For example, a while-true loop generator produces an infinite stream of values. The medium retrieves a new value from each active generator up to sixty times per second.
(looks better at 60 FPS)
Defining our canvas creates a new canvas every time it starts. This may be acceptable, but we can get better performance by reprocessing the canvas. The previous value of the variable is displayed as
this .Oh! Using the old
canvas we blur our globe:The glitch is easily fixed by cleaning the
canvas before redrawing.So, by making it a bit more complicated, you can improve performance, and the resulting animation has a slight overhead compared to vanilla JavaScript.
Interaction
If generators are good for animation scenarios, how about interaction? Generators to help again! Only now our generators are asynchronous, returning promises that are allowed whenever a new input appears.
To make the rotation interactive, let's first define the input range. Then we connect it to the generator, which gives the current value of the input whenever it changes. We could implement this generator manually, but there is a convenient built-in method called
Generators.input .Now we substitute the value as the longitude for rotating the interactive globe:
This is a brief definition of the user interface. But we can still reduce it by folding the definitions of
range and angle into one cell, using the Observable viewof operator. It shows the input to the user, but for the code, it represents the current value.The ability to display arbitrary DOMs and expose arbitrary values to code makes the Observable interfaces very, well ... bright. You are not limited to sliders and drop-down menus. Here is the Cubehelix color picker, implemented as a table of sliders, one for each color channel.
When you drag the slider, its value is updated at the corresponding output, and then the generator displays the current color.
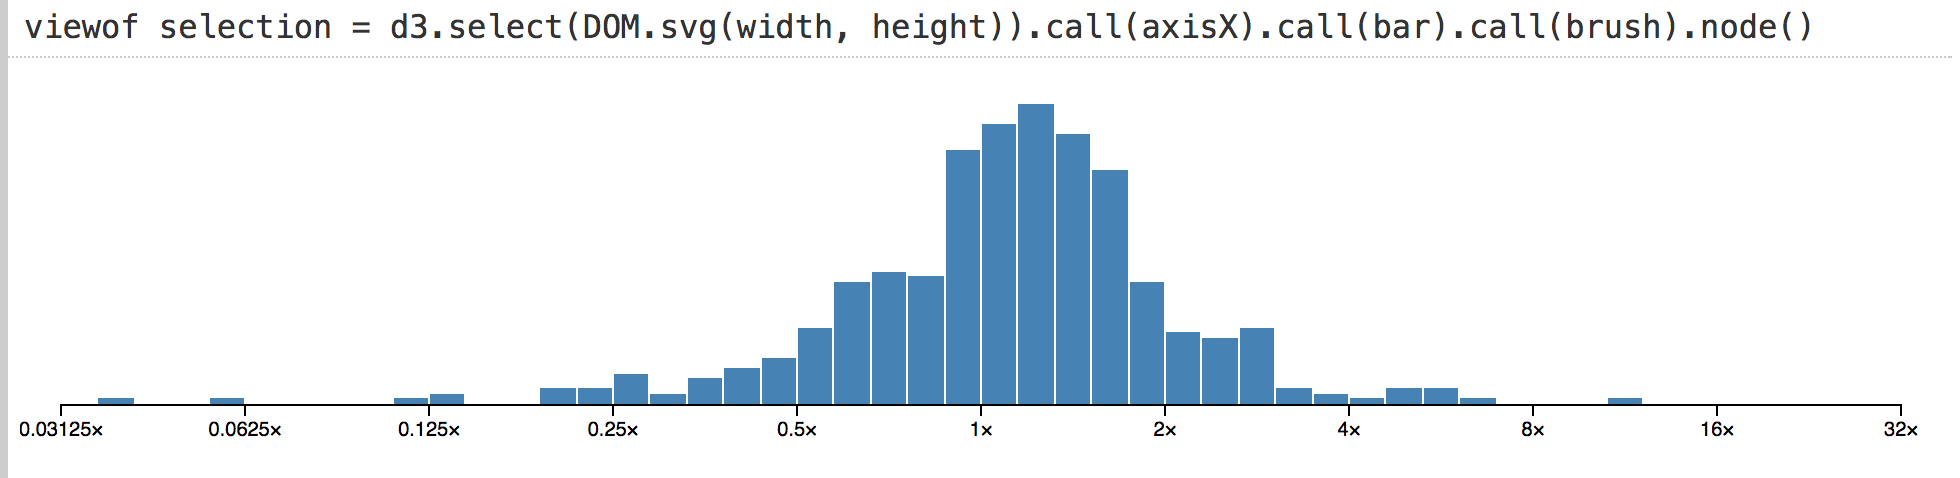
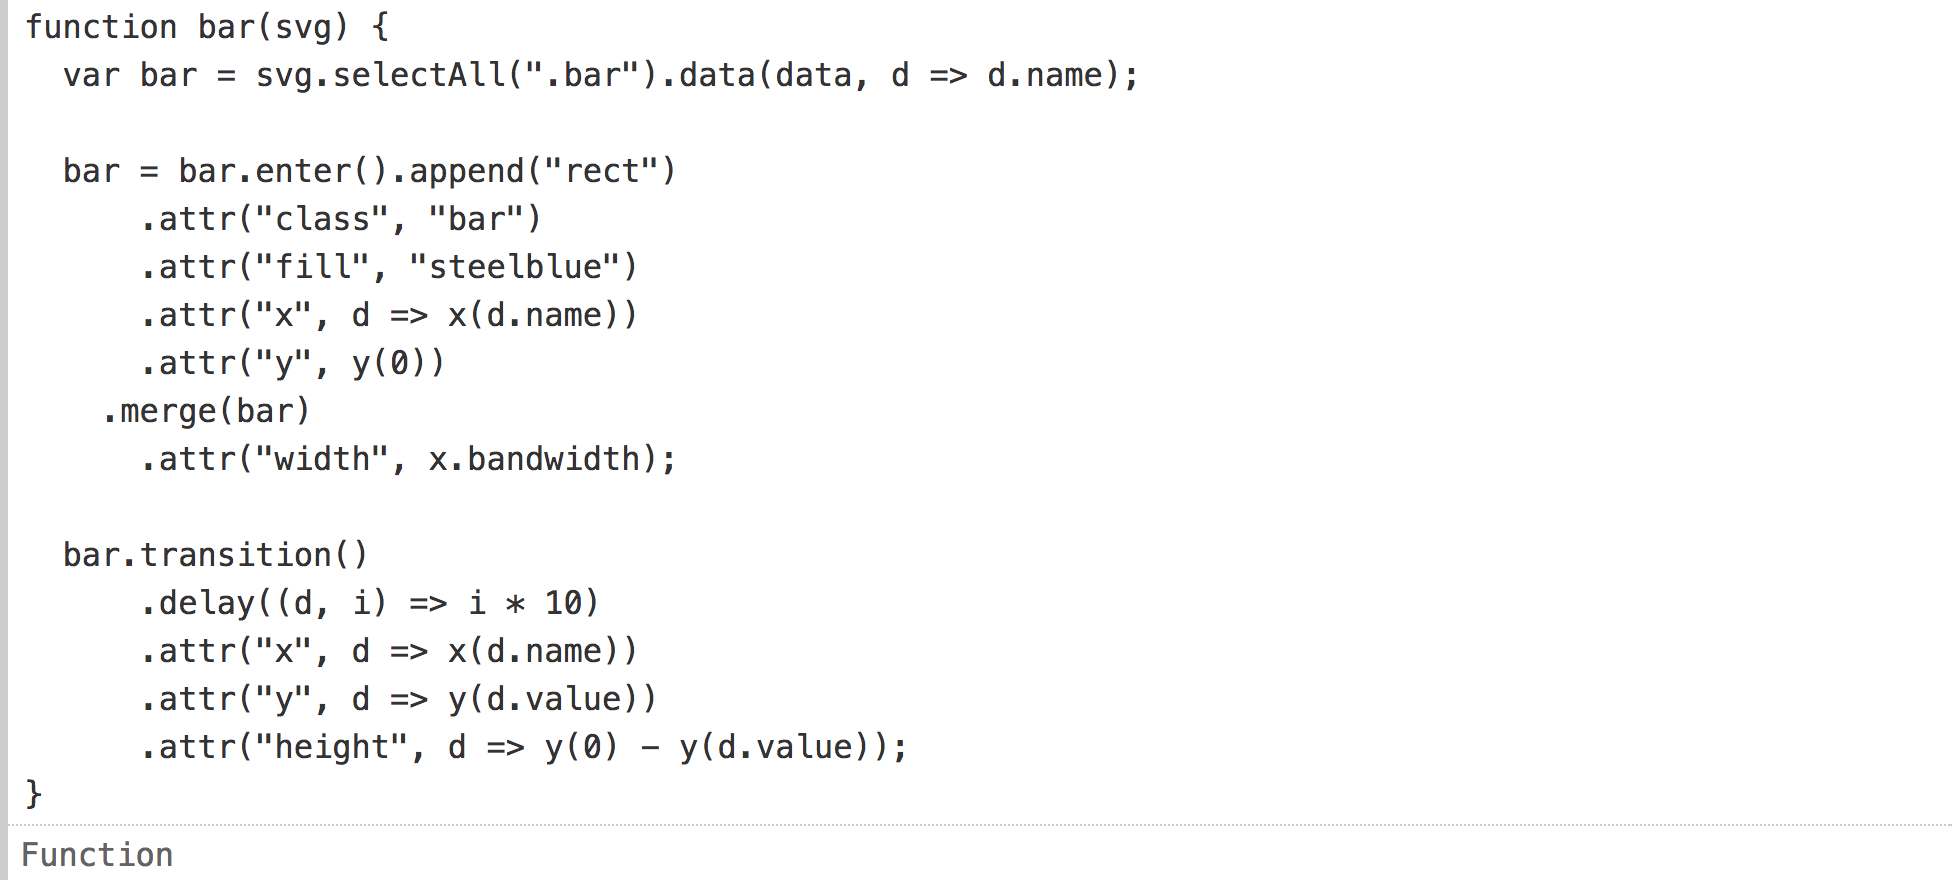
We can create any graphical interfaces that we want. And we can design smart programming interfaces to present their values to the code. This allows you to quickly create powerful interfaces for exploring data. Here is a bar chart showing the behavior of a few hundred stocks over a five year period. (I shortened the code, but it looks like this .)
In other environments, a histogram like this may be a visual dead end. You can look at it, but to check the base values you need to separately request data in the code. In Obsesrvable, we can quickly complete the visualization, and show the selection interactively. Then we can see the data under the cursor by direct manipulation.
The default object inspector is used here, but you can do anything online, for example, live totals, real-time statistics, or even associated visualizations.
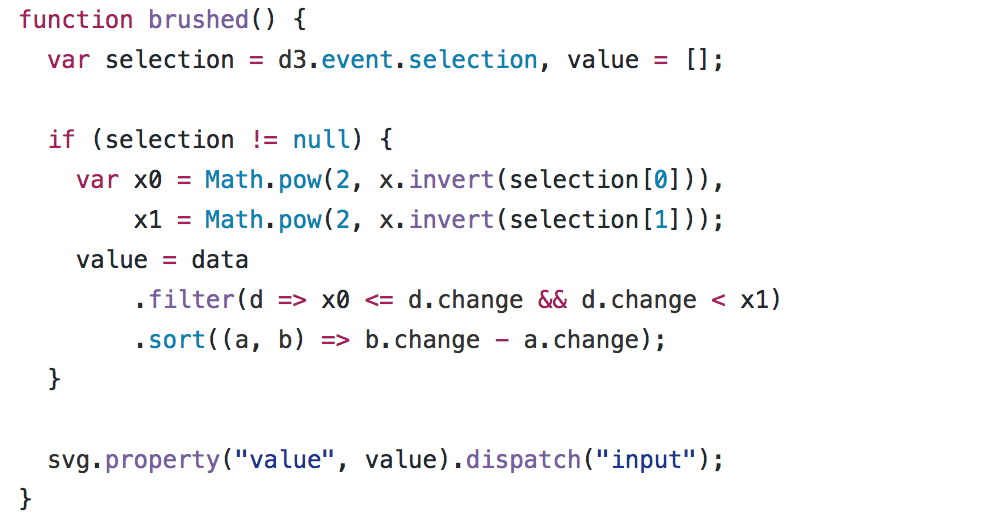
To show that this is not magic, the code for adapting the d3-brush to Obsesrvable is given above. Upon the
brush event, we calculate the new filtered data, set it as the value of the SVG node, and send the input event.Animated transitions
By default, reactions occur instantaneously: when the value of a variable changes, the runtime recalculates derived variables and immediately updates the display. But such urgency is not always required and sometimes it is useful to animate transitions for a sense of the reality of an object . Here, for example, we can follow the columns as they are re-sorted:
Understanding the implementation of this diagram requires familiarity with D3, namely: keyed data and step transition , but even if this code is opaque, it hopefully demonstrates that today's open source libraries are easily used in Obsesrvable.
2. Visibility
The visual output of the program helps to better perceive the current state of the program. Interactive programming helps to more thoroughly analyze the behavior of the program by typing: changing, deleting, reordering and observing what is happening.
For example, by removing the binding forces in the comments in the graph below, we better understand their contribution to the overall arrangement of the figures.
(Watch YouTube on how I play with it.)
You must have seen similar toys — for example, Steve Haroz has a great sandbox for d3-force. Here you do not need to create a user interface for playback; it comes free with interactive programming!
Algorithm Visualization
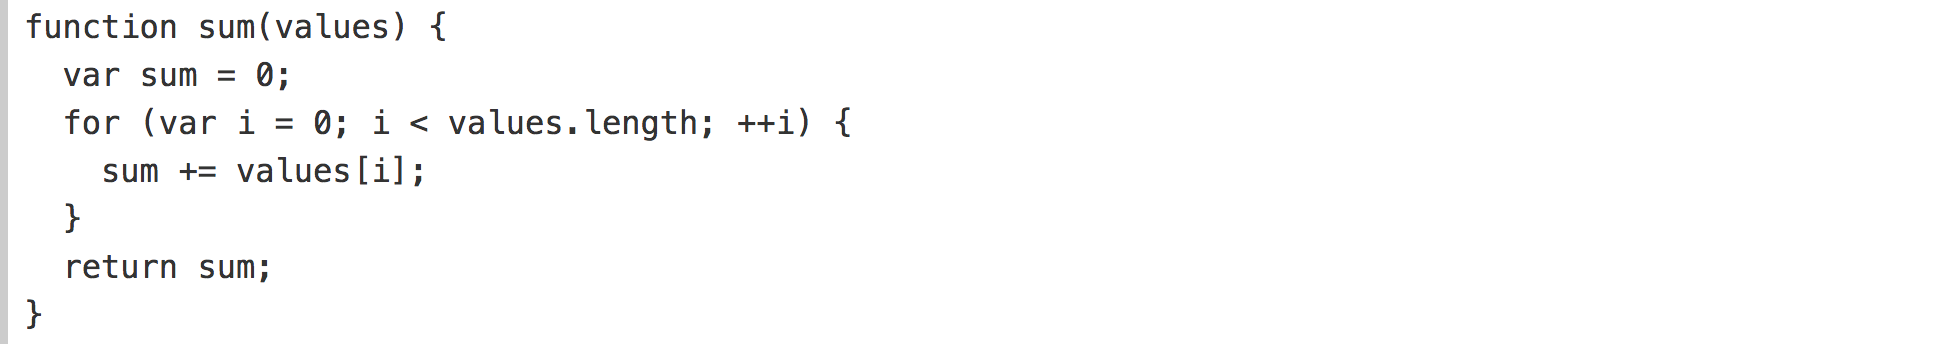
A more detailed approach to studying the behavior of the program is to supplement the code to display the internal state. Generators also help here. We can take a normal function like this to sum up an array of numbers:
And turn it into a generator that produces a local state at run time, in addition to the normal return value at the end:
Then, to understand the behavior, we can visualize or check the internal state . This approach provides a clear separation between our implementation of the algorithm and its study, rather than the implementation of the visualization code directly inside the algorithm.
As an example, let's look at the hierarchical packing structure of circles D3 .
We have a set of circles that we want to pack in as little space as possible without overlapping, like a cluster of penguins in Antarctica. Our task is to place the circles one by one until all the circles are placed.
Since we want the circles to be packed as tightly as possible, it is rather obvious that each circle we place must touch at least one ( actually two ) circles that we have already placed. But if we randomly select an existing circle as a tangent circle, we will spend a lot of time putting the new circle in the middle of the pack, where it will overlap other circles. Ideally, we only consider circles that are outside the package. But how can we effectively determine which circles are outside?
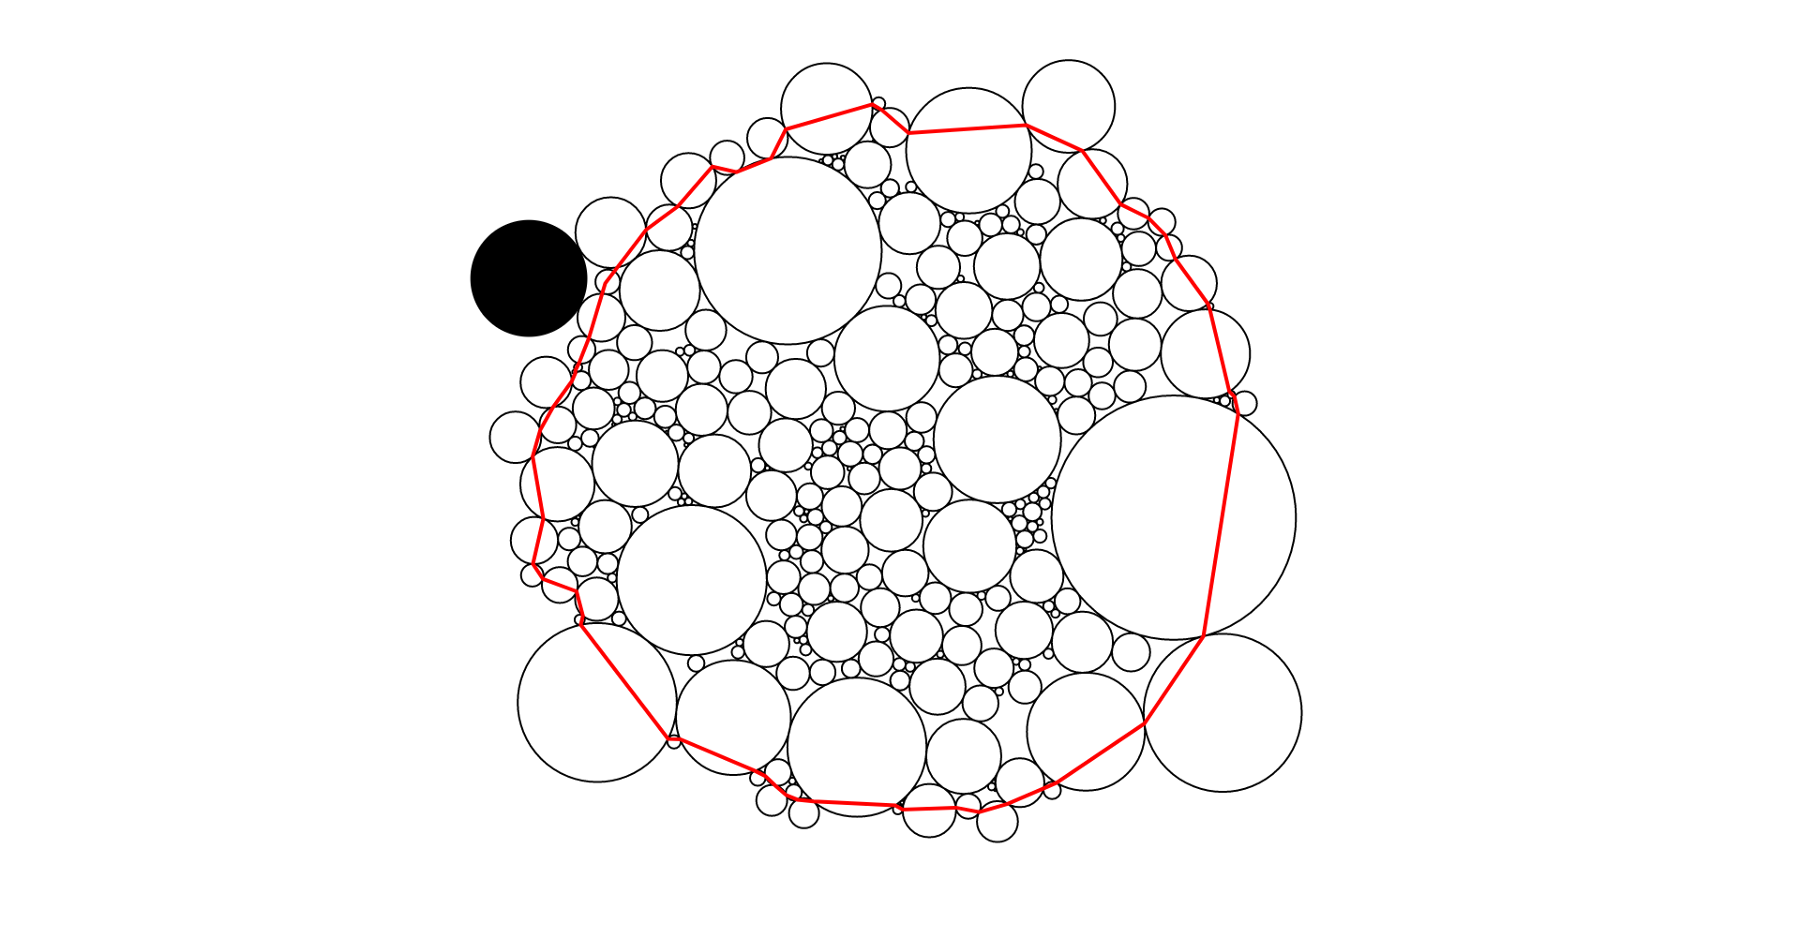
Wang's algorithm supports the "external chain", shown here in red, which represents these outer circles. When placing a new circle, he chooses a circle in the front chain, which is closest to the beginning. A new circle is located next to this circle and its neighbor on the front chain.
If this placement does not overlap with any other circle in the front chain, the algorithm proceeds to the next circle. If it overlaps, then we cut the front chain between the tangent circles and the overlapping circle, and the overlapping circle becomes a new touching circle. We repeat this process until there is an overlap.
I find this animation fascinating. If you look closely, you will see brief moments when a large circle is squeezed out of the package when the front chain is cut. This is not only pleasing to the eye, but also extremely useful for identifying a long-standing error in the implementation of D3, where very rarely it would overlap the wrong side of the front chain and the circles would overlap.
After we have assembled our circles, we need to calculate the circumference for packing so that the circular packing can be repeated along the hierarchy. The usual way to do this is to scan the front chain for a circle that is furthest from the origin. This is quite a decent assumption, but not accurate. Fortunately, there is a simple extension of the Welzl algorithm ( Welzl ) to calculatesmallest closed circle in linear time.
To see how the Welz algorithm works, suppose we already know the outer circle for some circles and want to include a new circle in it. If the new circle is inside the current circle, we can move on to the next circle. If the new circle is outside the vicious circle, we must expand the circle.
When the circle is outside a closed circle (left), it should touch the new outer circle (right).
However, we know something about this new circle: it is the only circle that is outside the outer circle and, therefore, it must touch the new outer circle. And if we know how to find one touching circle for the outer circle, we can find others recursively!
There is a bit of geometry, I am a bit of a hack, of course. We also need to calculate the boundary cases for recursion: outer circles for one, two, or three tangent circles. (This is the problem of Apollonius ) Geometry also dictates that there can be no more than three tangent circles, or the environment already contains all the circles, so we know that our recursive approach will eventually end.
Here is a more complete overview of the recursive algorithm showing the stack:
The left one is the uppermost level, where the set of contiguous circles is empty. The algorithm is repeated every time a new circle is outside the circle. During recursion, this new circle must be placed on a set of circles in contact with it. So, from left to right, there are zero, one, two, and three adjoining circles painted in black.
In addition to explaining how the algorithm works, this animation gives a sense of time that the algorithm spends at different levels of recursion. Since it processes the circles in a random order, the spanning circle expands quickly to bring the final answer closer. But whenever he repeats, he must reinstall all previous circles to make sure that they fit into the new surrounding circle.
3. Reusability
One way to write less code is to reuse it. 440,000 or so packages published in npm indicate the popularity of this approach.
But libraries are an example of active reuse: they must be intentionally designed for reuse. And this is a significant burden. It's hard enough to develop an effective overall abstraction! (Contact any open source developer.) Implementing a “one-off” code, as is usually the case in the D3 examples, is simpler because you only need to consider a specific task, not an abstract class of tasks.
I find out if we can have better passive reuse in Observable. Where, using the structure of reactive documents, we can more easily reconfigure the code, even if this code was not specifically designed for reuse.
For starters, you can consider de facto notebooks as libraries. Let's say, in one laptop, I implement a custom color scale:
In another notebook, I can import this color scale and use it.
Import is also useful if you have created many notebooks for researching ideas and want to combine them into one unit.
More interestingly, Observable allows you to rebuild variable definitions during import. Here I define stream from real-time data via WebSocket. (again, the details of this code are not critical, for simplicity you can imagine an imaginary library ... )
This data set has the same shape as our previous line graph: an array of objects with time and value. Can we reuse this schedule? Aha The operator
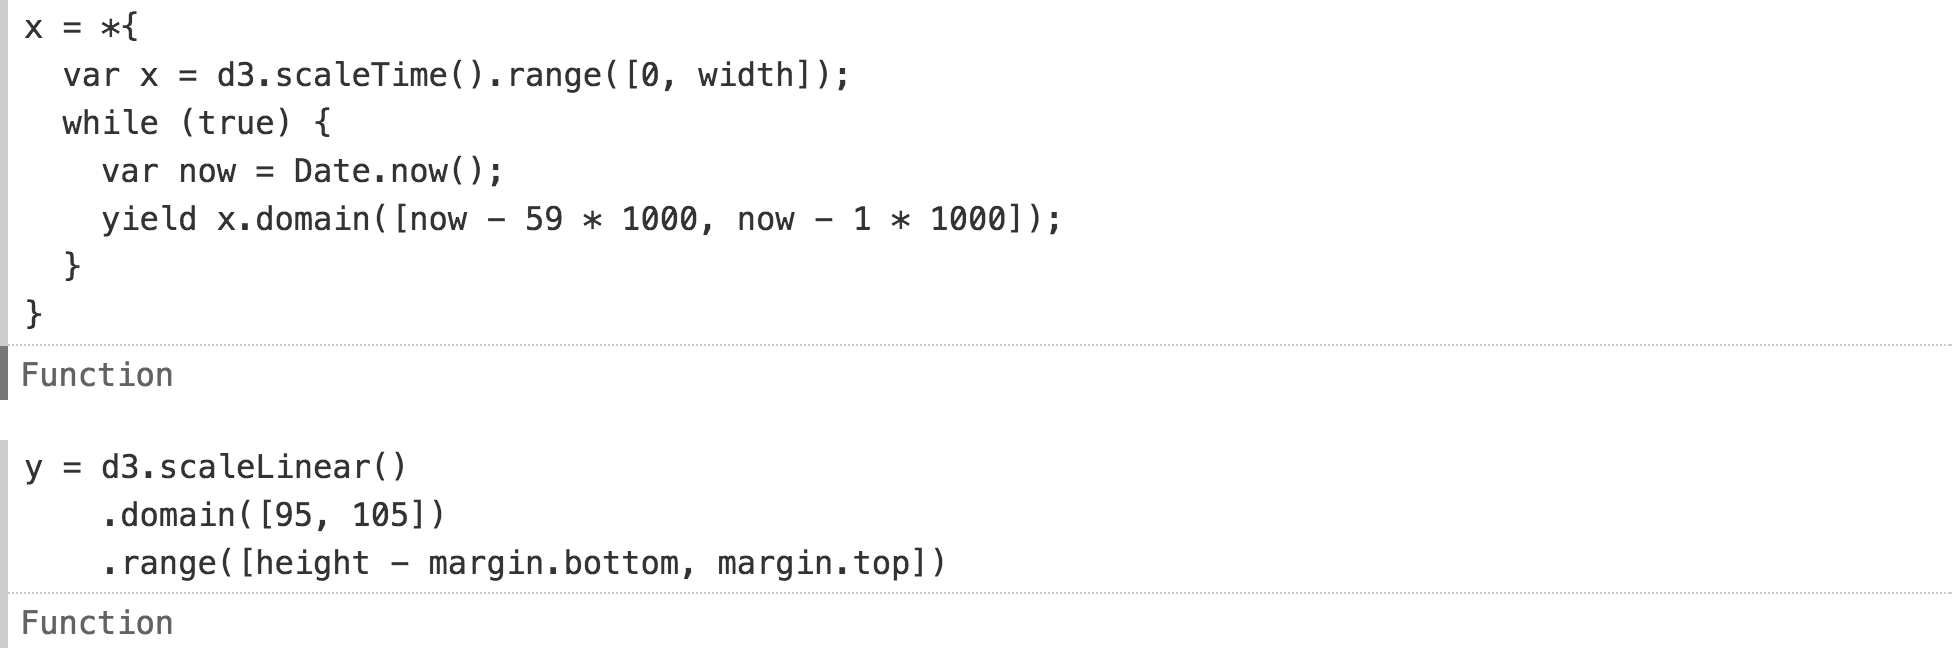
withallows you to enter local variables in the imported variables, replacing the original definitions.We can not only insert our dynamic data into a previously static diagram, but also, if necessary, scale the coordinate axes. Here we change the axle domains
xand ythe appropriate sizes for this data. the axis xnow shows the last sixty seconds or so.Adding new definitions
xand yto the operatorwith, the graph now smoothly slides at 60 FPS, and the axis is yalready distractingly not twitching:4. Portability
Observable notebooks work in a browser, not in a desktop application or in the cloud; There is a server to save your scripts, but all calculations and rendering occur locally in the client. What does it mean to have a research environment on the web?
The web environment encompasses web standards, including vanilla JavaScript and DOM. It works with open source code, be it code snippets that you find on the Internet or in libraries published in npm. This minimizes the specialized knowledge necessary for productive work in a new environment.
There is a new syntax in Observable for reactivity, but I tried to keep it as small and familiar as possible, for example, using generators. These are four forms of variable definition:
The standard library is also minimal and not tied to the platform. You should be able to bring your existing code and knowledge to the Observable and vice versa, pick up your code and knowledge from the Observable.
The web environment first allows your code to work everywhere, because it works in a browser. No need to install anything. It becomes easier for another to repeat and check your analysis. In addition, your code for the study can gracefully go into the code for an explanation . You do not need to start from scratch when you want to share your ideas.
It's great that reporters and scientists share data and code. But the code on GitHub is not always easy to run: you need to play the necessary environment, operating system, application, packages, etc. If your code is already running in the browser, then it runs in any other browser. And that's the beauty of the Internet!
Creating more portable code for analysis can have an impact on our communication style. Once again I will quote Victor :
An active reader asks questions, considers alternatives, questions assumptions, and even questions the author's credibility. The active reader is trying to summarize concrete examples and come up with concrete examples for generalizations. An active reader does not passively absorb information, but uses the arguments of the author as a springboard for critical thinking and deep understanding.
PS
If you want to help me develop Observable, this is great! Please contact me. You can find my email address on my github profile and connect with me on Twitter .
beta.observablehq.com
Thanks for reading!
Source: https://habr.com/ru/post/352994/
All Articles