Never Fail Twice, or how to build a monitoring system from scratch
We had 2 virtual machines, 75 sites, tens of thousands of monitoring machines, thousands of metrics, two databases and one ActiveMQ line, Python and a whole host of libraries of all sorts and colors, pandas, as well as numpy, dash, flask, SQL Alchemy. Not that it was the necessary supply for the system, but if it began to assemble the components, it becomes difficult to stop. The only thing that made me fear was javascript. Nothing in the world is more helpless, irresponsible and vicious than JS zombies. I knew that sooner or later we will move on to this rubbish.

Monitoring distributed systems is quite a non-trivial task, where there are pitfalls. On the other hand, there are a huge number of both commercial and open-source solutions for various monitoring tasks. Under the cut on why open decisions did not fit us, what we understood from the analysis of successful and unsuccessful monitoring projects, and why it was decided to build Yet Another Alert System. It was a fascinating adventure, where at the stages from analyzing data in Python to the final solution and building the system, we met almost all of Computer Science and even a bit of matane.
If we consider the problem of monitoring in general, the tasks are divided into two main groups.
')
Why is it difficult?
- Monitoring a complex distributed system is already an engineering problem in itself
- Various problems lead to implicit changes in system behavior.
- Many different metrics of one system
- Different metrics correlate among themselves
I work as a Technical Architect in a large company, and we have problems with timely detection of problems in production systems.
We operate financial transactions in highly regulated markets. The system architecture is service-oriented, the components have complex business logic, there are different backend options for different clients of the (B2B) company.
Firstly, due to the high complexity of the products and the huge number of settings, there are situations when incorrect settings lead to degradation of financial indicators, or hidden bugs in the logic affect the overall functionality of the entire system.
Secondly, there are specific 3d-party integration for different countries, and the problems arising from the partners begin to flow to us. Problems of this kind are not caught by low level monitoring; to solve them, you need to monitor key indicators (KPI), compare them with system statistics and look for correlations.
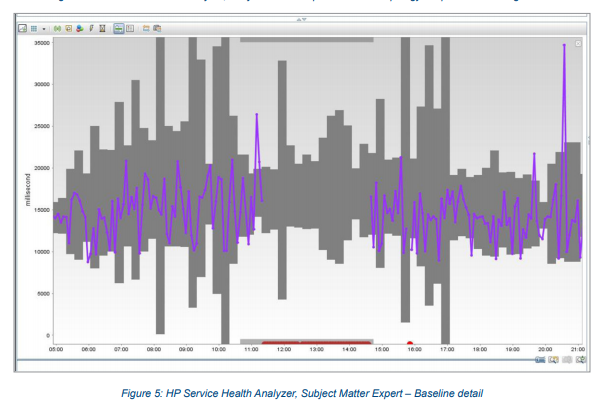
The company had previously implemented a solution from Hewlett Packard Service Health Analyzer, which was (to put it mildly) imperfect. Judging by the marketing prospectus, it is a system that studies itself and provides early detection of problems. In fact, it was a black box that could not be configured, with all the problems needed to contact HP and wait for months until the support engineers did something that wouldn't work as well. And yet - a terrible user interface, an old JVM ecosystem (Java 6.0), and, most importantly, a large number of False Positives and (worse,) False Negatives, that is, some serious problems were either not detected or were caught much later than it should , which was expressed in a very specific financial loss.
The figure shows that the granularity of SHA is 15 minutes - this means that even in case of problems, the minimum reaction time is 15 minutes ...
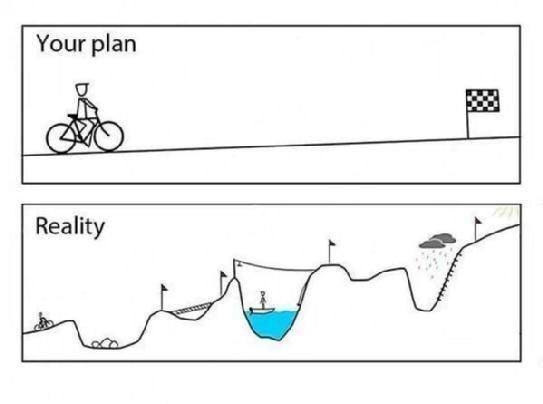
That is, it all often looked something like this ...

Many companies tried to build their monitoring systems. These were not always success stories.
Etsy is an online marketplace for handmade goods. The headquarters of the company is located in New York. The company collected more than 250,000 different metrics from its servers and tried to look for anomalies in the metrics using complex mathematical algorithms. But…
Meet Kale.
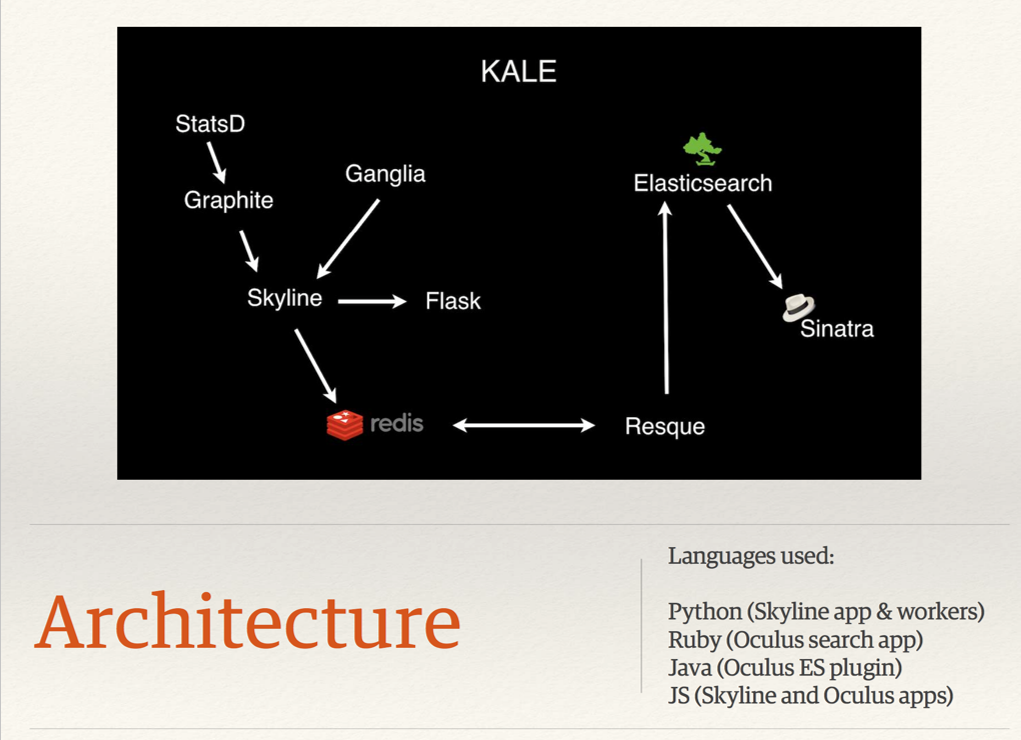
One of the problems Kale was that the system used a lot of different technological stacks. In the diagram you can see 4 different stacks, plus 2 frameworks. To develop and maintain the system, highly skilled engineers were required who were familiar with these stacks. The search for bugs also required knowledge in many stacks.
The second problem is the monitoring approach itself. Kale was only looking for anomalies. But if you have 250,000 metrics, then for every tick hundreds of anomalies will be statistically observed. If you expand the permissible limits, then problems will slip. If narrowed, there will be a huge number of false positives.
Etsy engineers tried to fight the number False Positives, but after three years of development the project was closed. On this topic there is a good video from Andrew Clegg.
I want to highlight one slide from this video.
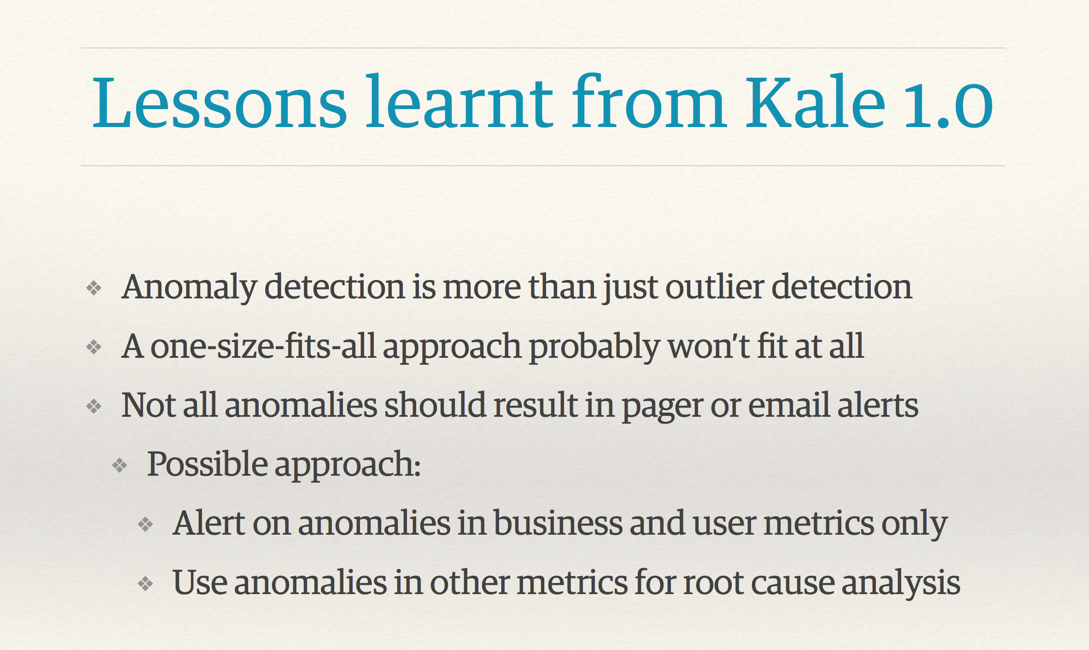
Finding anomalies is more than catching outliers. Outliers emissions will be observed on any real production data in normal operation mode. Not all anomalies should lead to alarm triggering at all levels.
A universal approach is not suitable for anything; There are no free lunches. That's why HP's SHA solution doesn't work as it should, trying to be a versatile tool.
And interestingly, the possible approaches to solving these problems.
Send an alert on anomalies in business and user metrics
Use other metrics for root cause analysis.
The book Site Reliability Engineering has a whole chapter devoted to the issue of monitoring the production of Google systems. In short,
On these principles, Google built a successful BorgMon system.
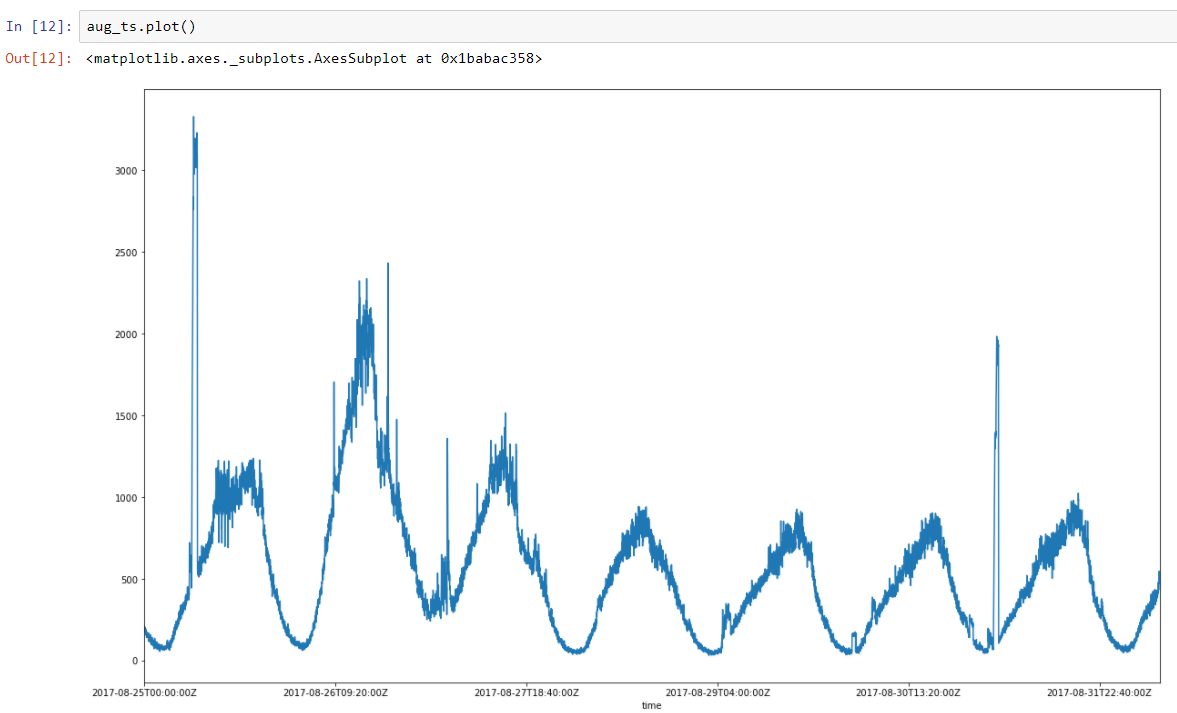
Time series is a data series indexed by time. If we take as a series of economic processes (from the production of champagne to sales in stores or online transactions), then they have some common properties: the processes are regular, have a certain frequency, usually have seasonal periods and trend lines. Using this information, you can simplify the analysis.
Take a weekly series of real data on the number of transactions. We can see a pronounced regularity (two peaks are performance tests). There is daily regularity, plus an increase in activity on Friday and on weekends, after which the activity begins to subside until the next weekend.
On Habré there were many quite good materials on this subject, for example here .
On Medium there is my introduction to time series modeling (in english): Time series modeling .
In a nutshell: each measurement contains signal components and measurement / noise errors. There are many factors that affect both the processes themselves and the metrics collected.
Point = Sig + err
We have a model that describes the signal. If the model is subtracted from the measurement, then the better the model captures the signal, the more the result of the subtraction will tend to stationarity or white noise - and this is easy to verify.
In an article on Medium, I gave examples of modeling linear and segmented regression.
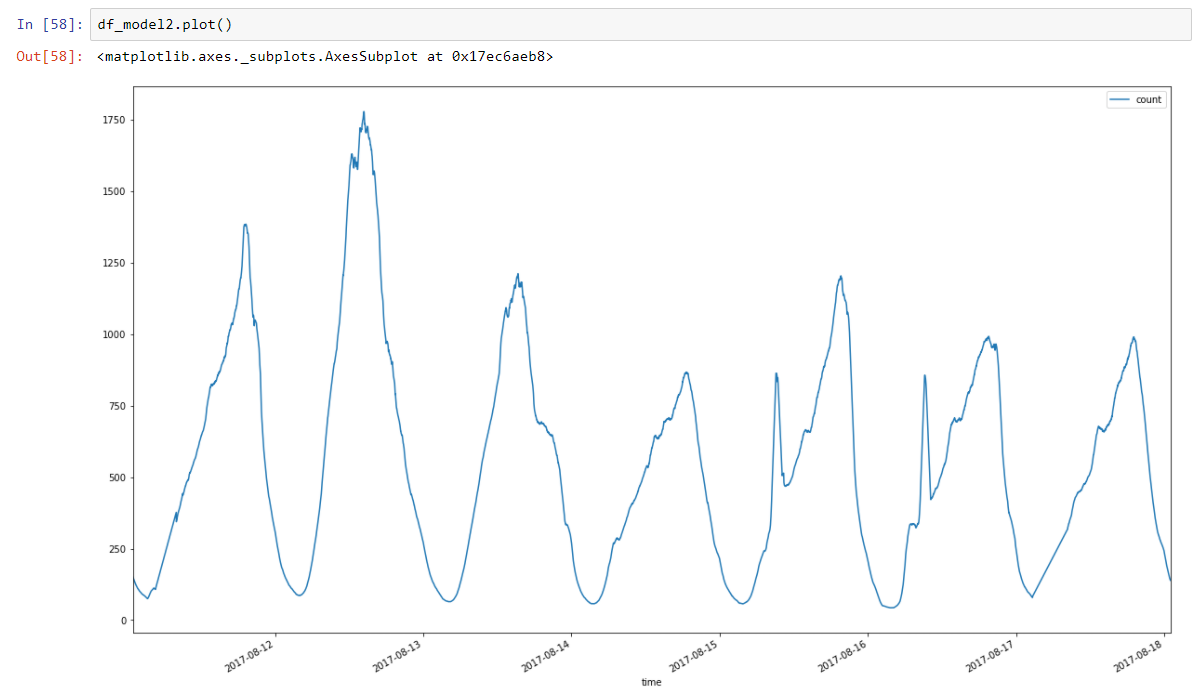
For the monitoring system, I chose modeling using sliding statistics for mean and scatter. The moving average is essentially a low pass filter that smooths the noise and leaves the main trend lines. Here are our data on the number of transactions in another week, after the passage of the moving average with a window of 60 minutes (peaks removed):
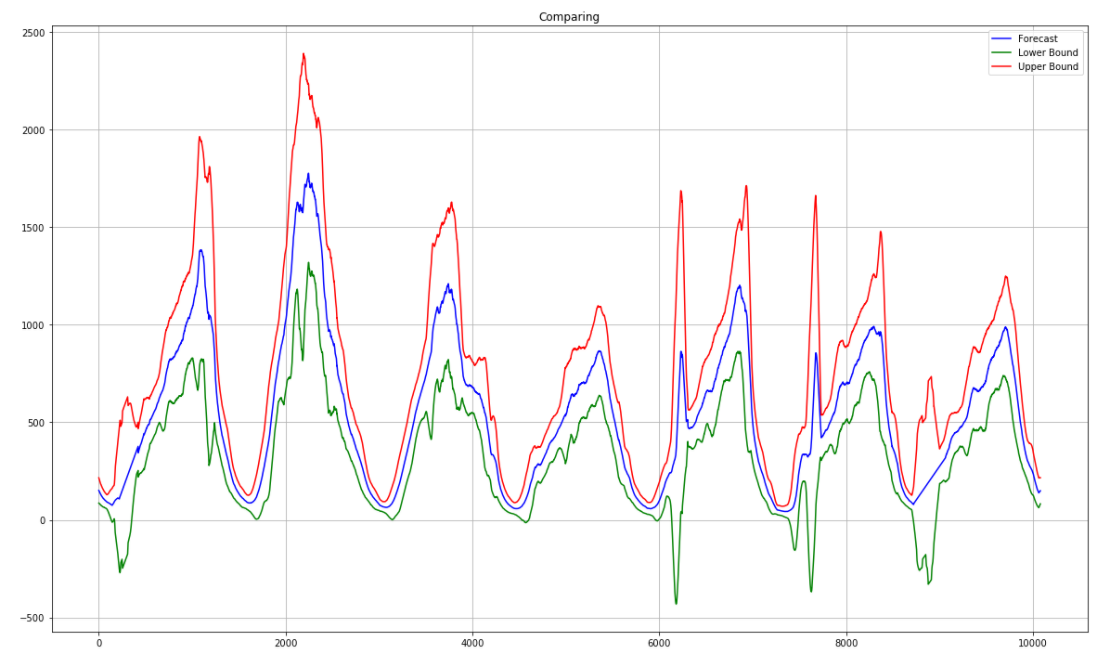
We also collect and moving variance to set the permissible boundaries of the model. As a result, we get something from Salvador Dali.
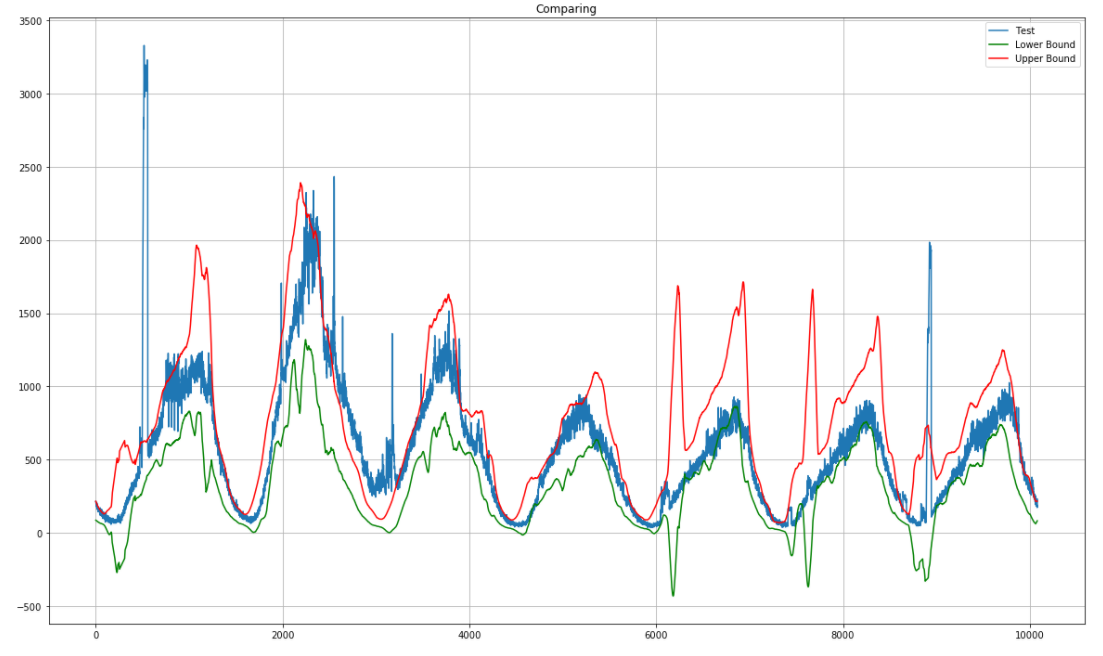
We enter here the data for another week and we can immediately see outliers.
Now we have everything we need to build our Alert System.
The Kale project experience speaks about a very important point. Alerting is not the same as searching for anomalies and outliers in metrics, since, as already mentioned, there will always be anomalies on single metrics.
In fact, we have two logical levels.
- The first is to search for anomalies in the metrics and send a notification of the violation, if an anomaly is found. This is the level of issue of information.
- The second level is a component that receives information about violations and decides whether this is a critical incident or not.
In this way, we humans act when we investigate a problem. We look at something, if we detect deviations from the norm, we look again, and then make a decision based on the observations.
At the beginning of the project, we decided to try Kapacitor, since it has the ability to define custom functions in Python. But each function sits in a separate process, which would create an overhead for hundreds and thousands of metrics. Because of this and some other problems, it was decided to abandon it.
For building your own system, Python was chosen as the main stack, because there is an excellent ecosystem for data analysis, fast libraries (pandas, numpy, etc.), excellent support for web solutions. You name it.
For me, this was the first big project, fully and entirely executed in Python. I myself came to Python from the Java world. I did not want to multiply the zoo of stacks for one system, which was ultimately rewarded.
The system is built as a set of loosely coupled components or services that spin in their processes on their Python VM. This is natural for a general logical partitioning (events emitter / rules engine) and gives other advantages.
Each component does a limited number of specific things. In the future, this will allow you to quickly expand the system and add new user interfaces without affecting the basic logic and not being afraid to break it. Between the components are fairly clear boundaries.
Distributed deploy is convenient if you need to locate the agent locally to closer to the site that it monitors - or you can aggregate together a large number of different systems.
Communication must be message-based, since the entire system must be asynchronous.
I chose ActiveMQ as the Message Queue, but if I want to change, for example, with RabbitMQ, there will be no problems, since all the components communicate using the standard STOMP protocol.
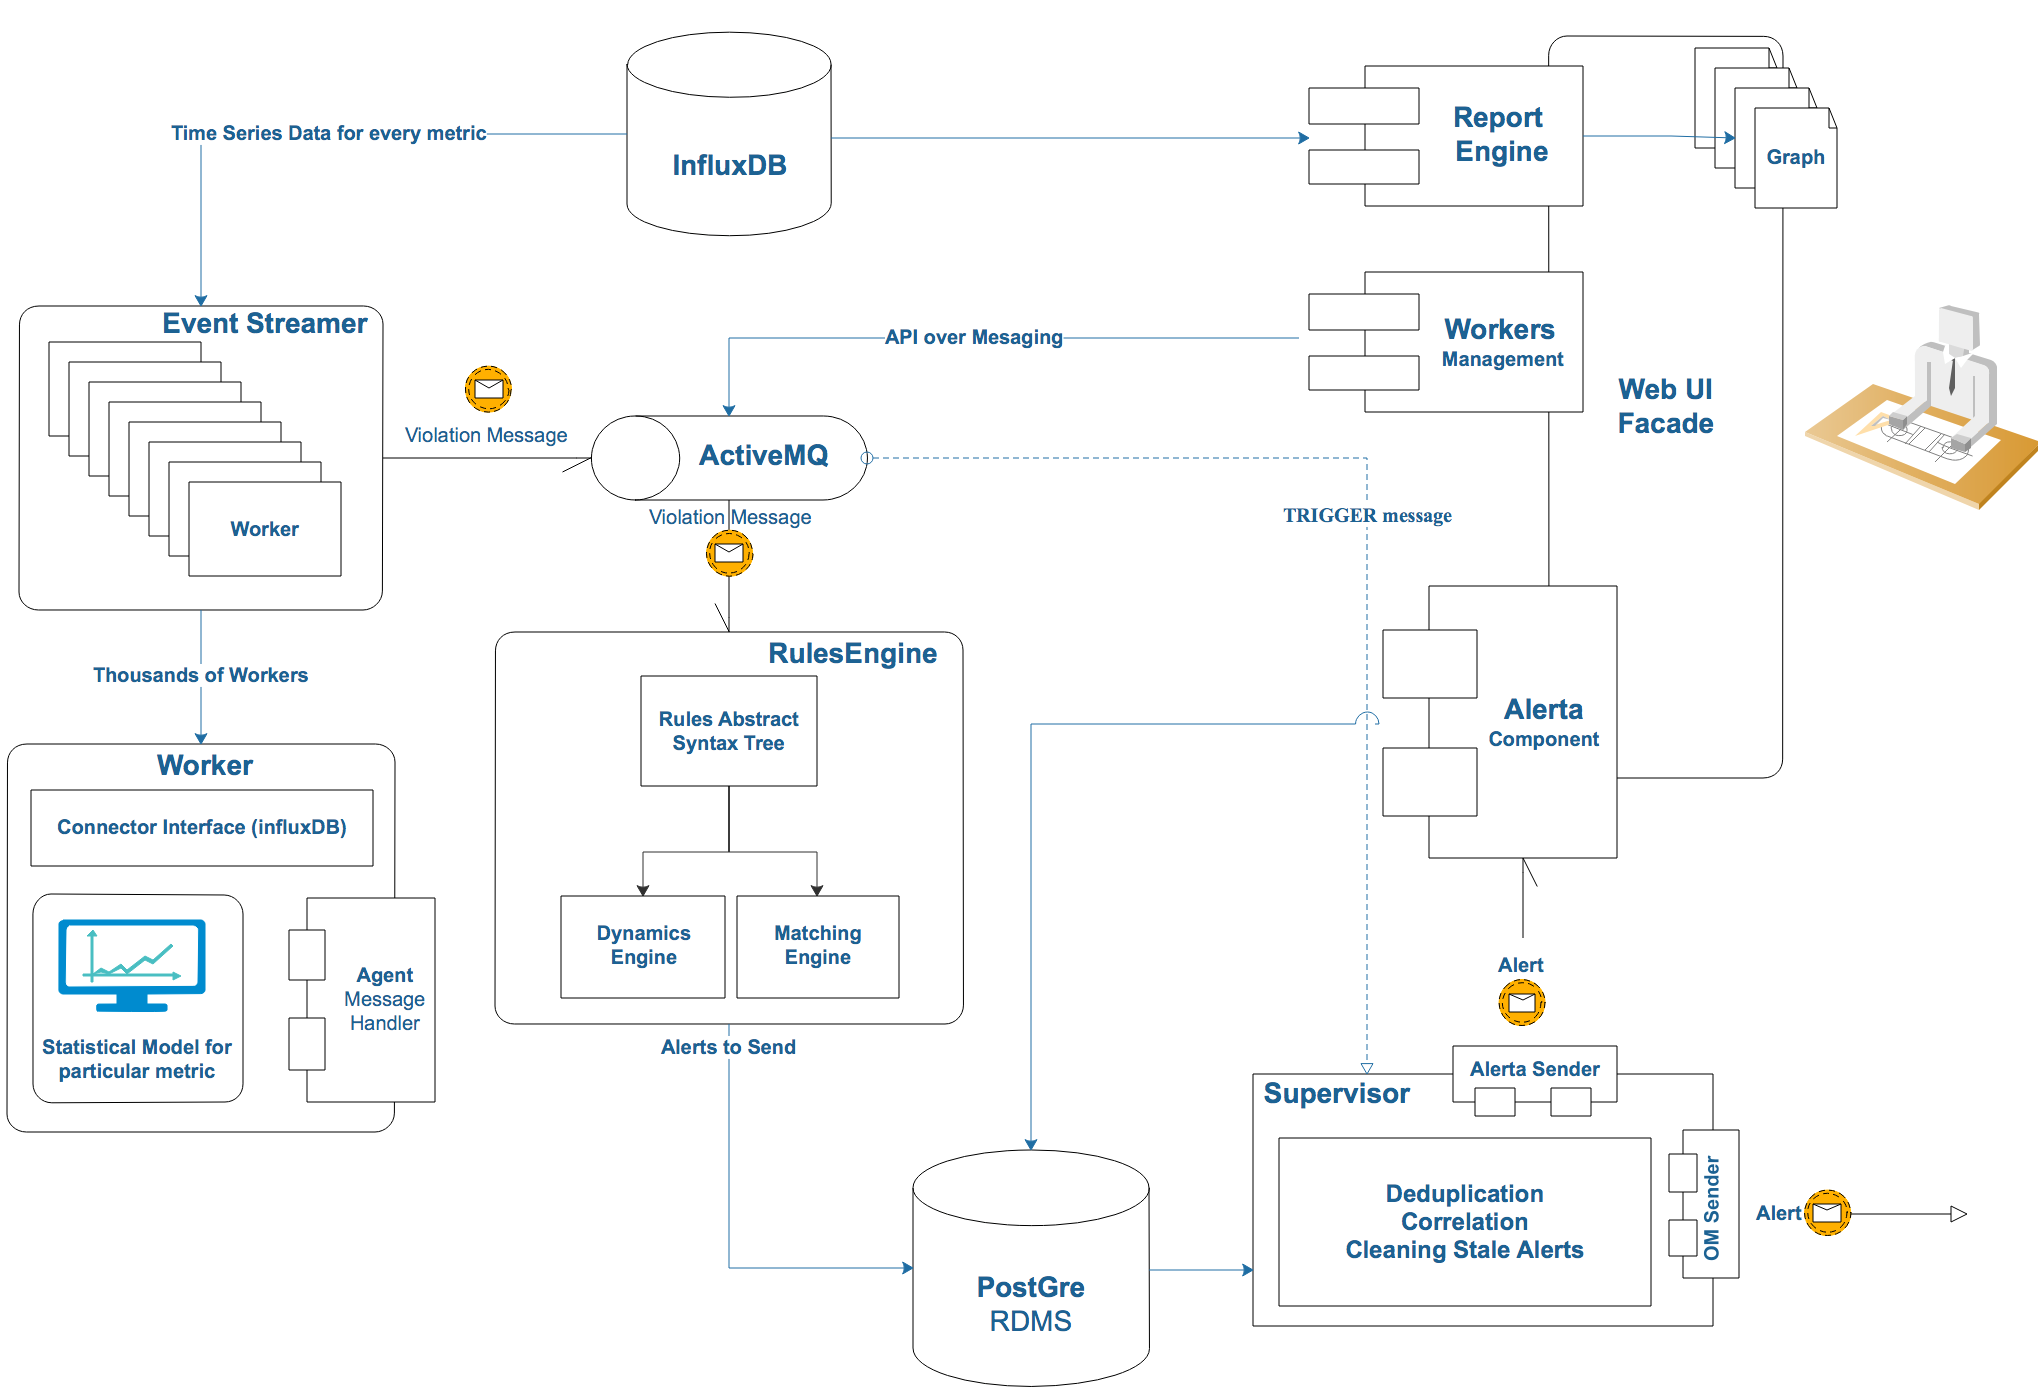
Event streamer is a component that stores statistical models, selects data at certain intervals, and finds outliers. It is quite simple ustroen:
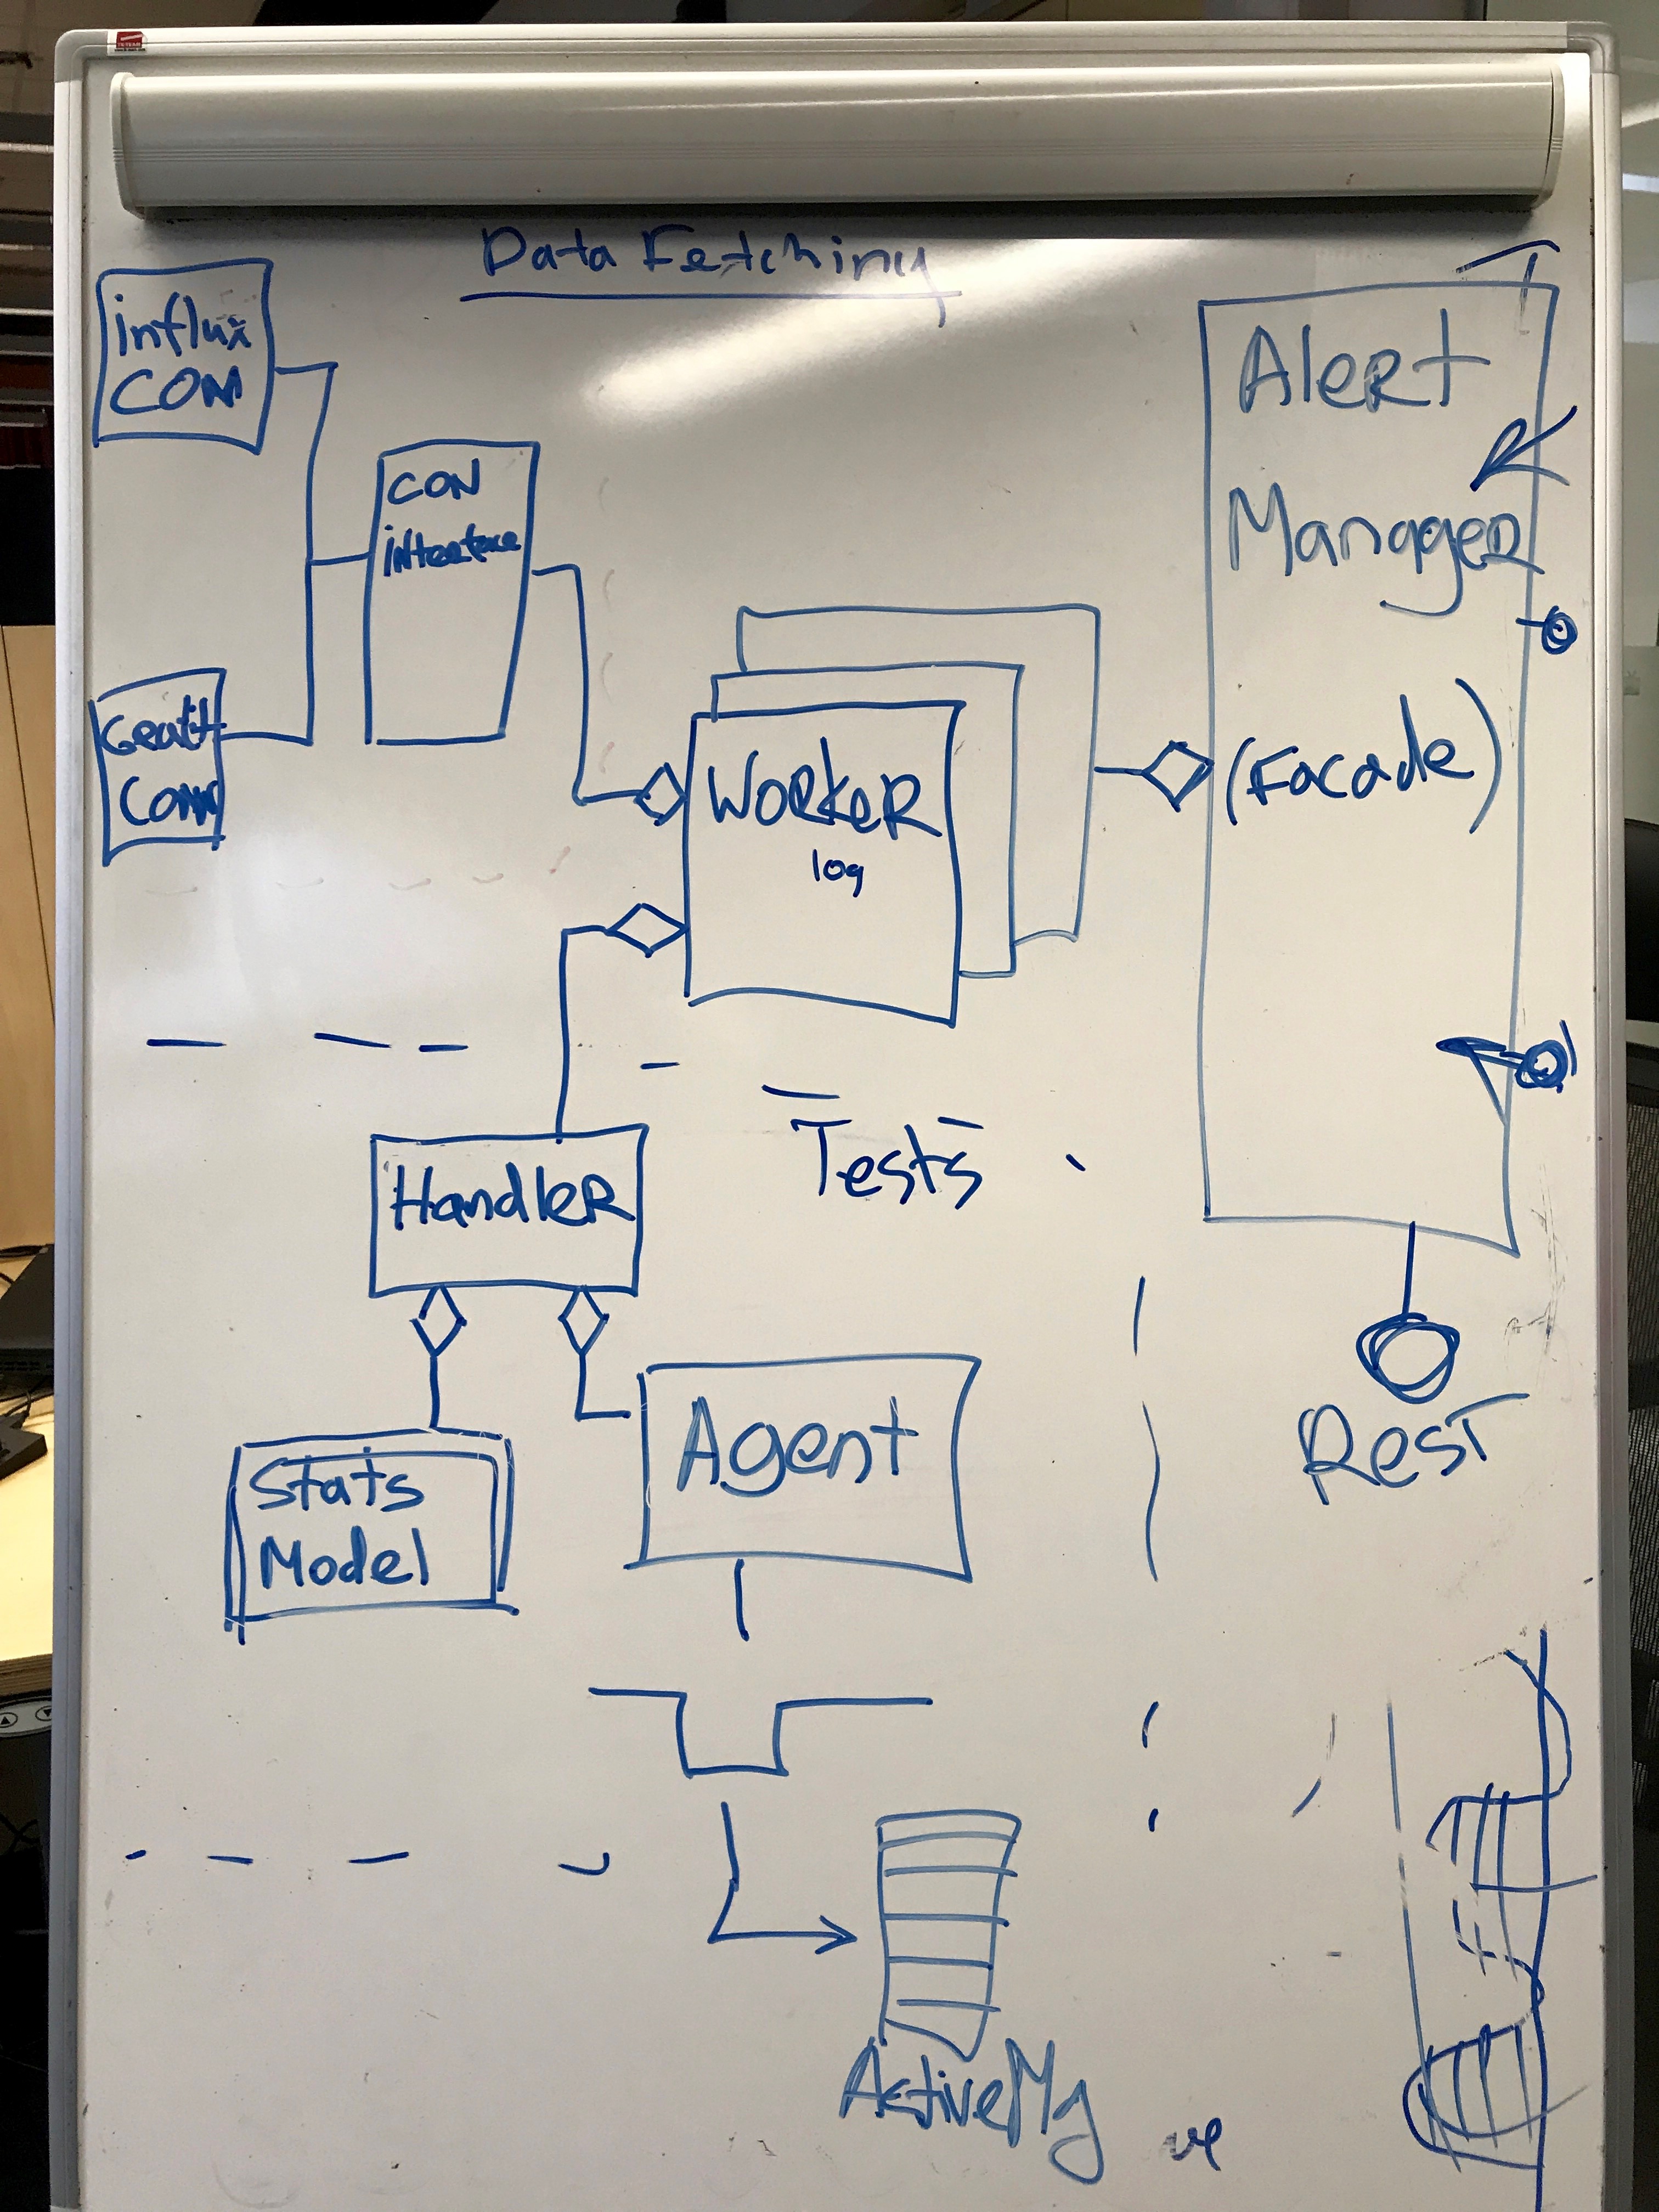
Worker is the main working unit that stores one model of the same metric along with meta-information. It consists of the date of the connector and the handler to which the data is transmitted. The handler tests them on a statistical model, and if it detects violations, then sends them to the agent, which sends the event to the queue.
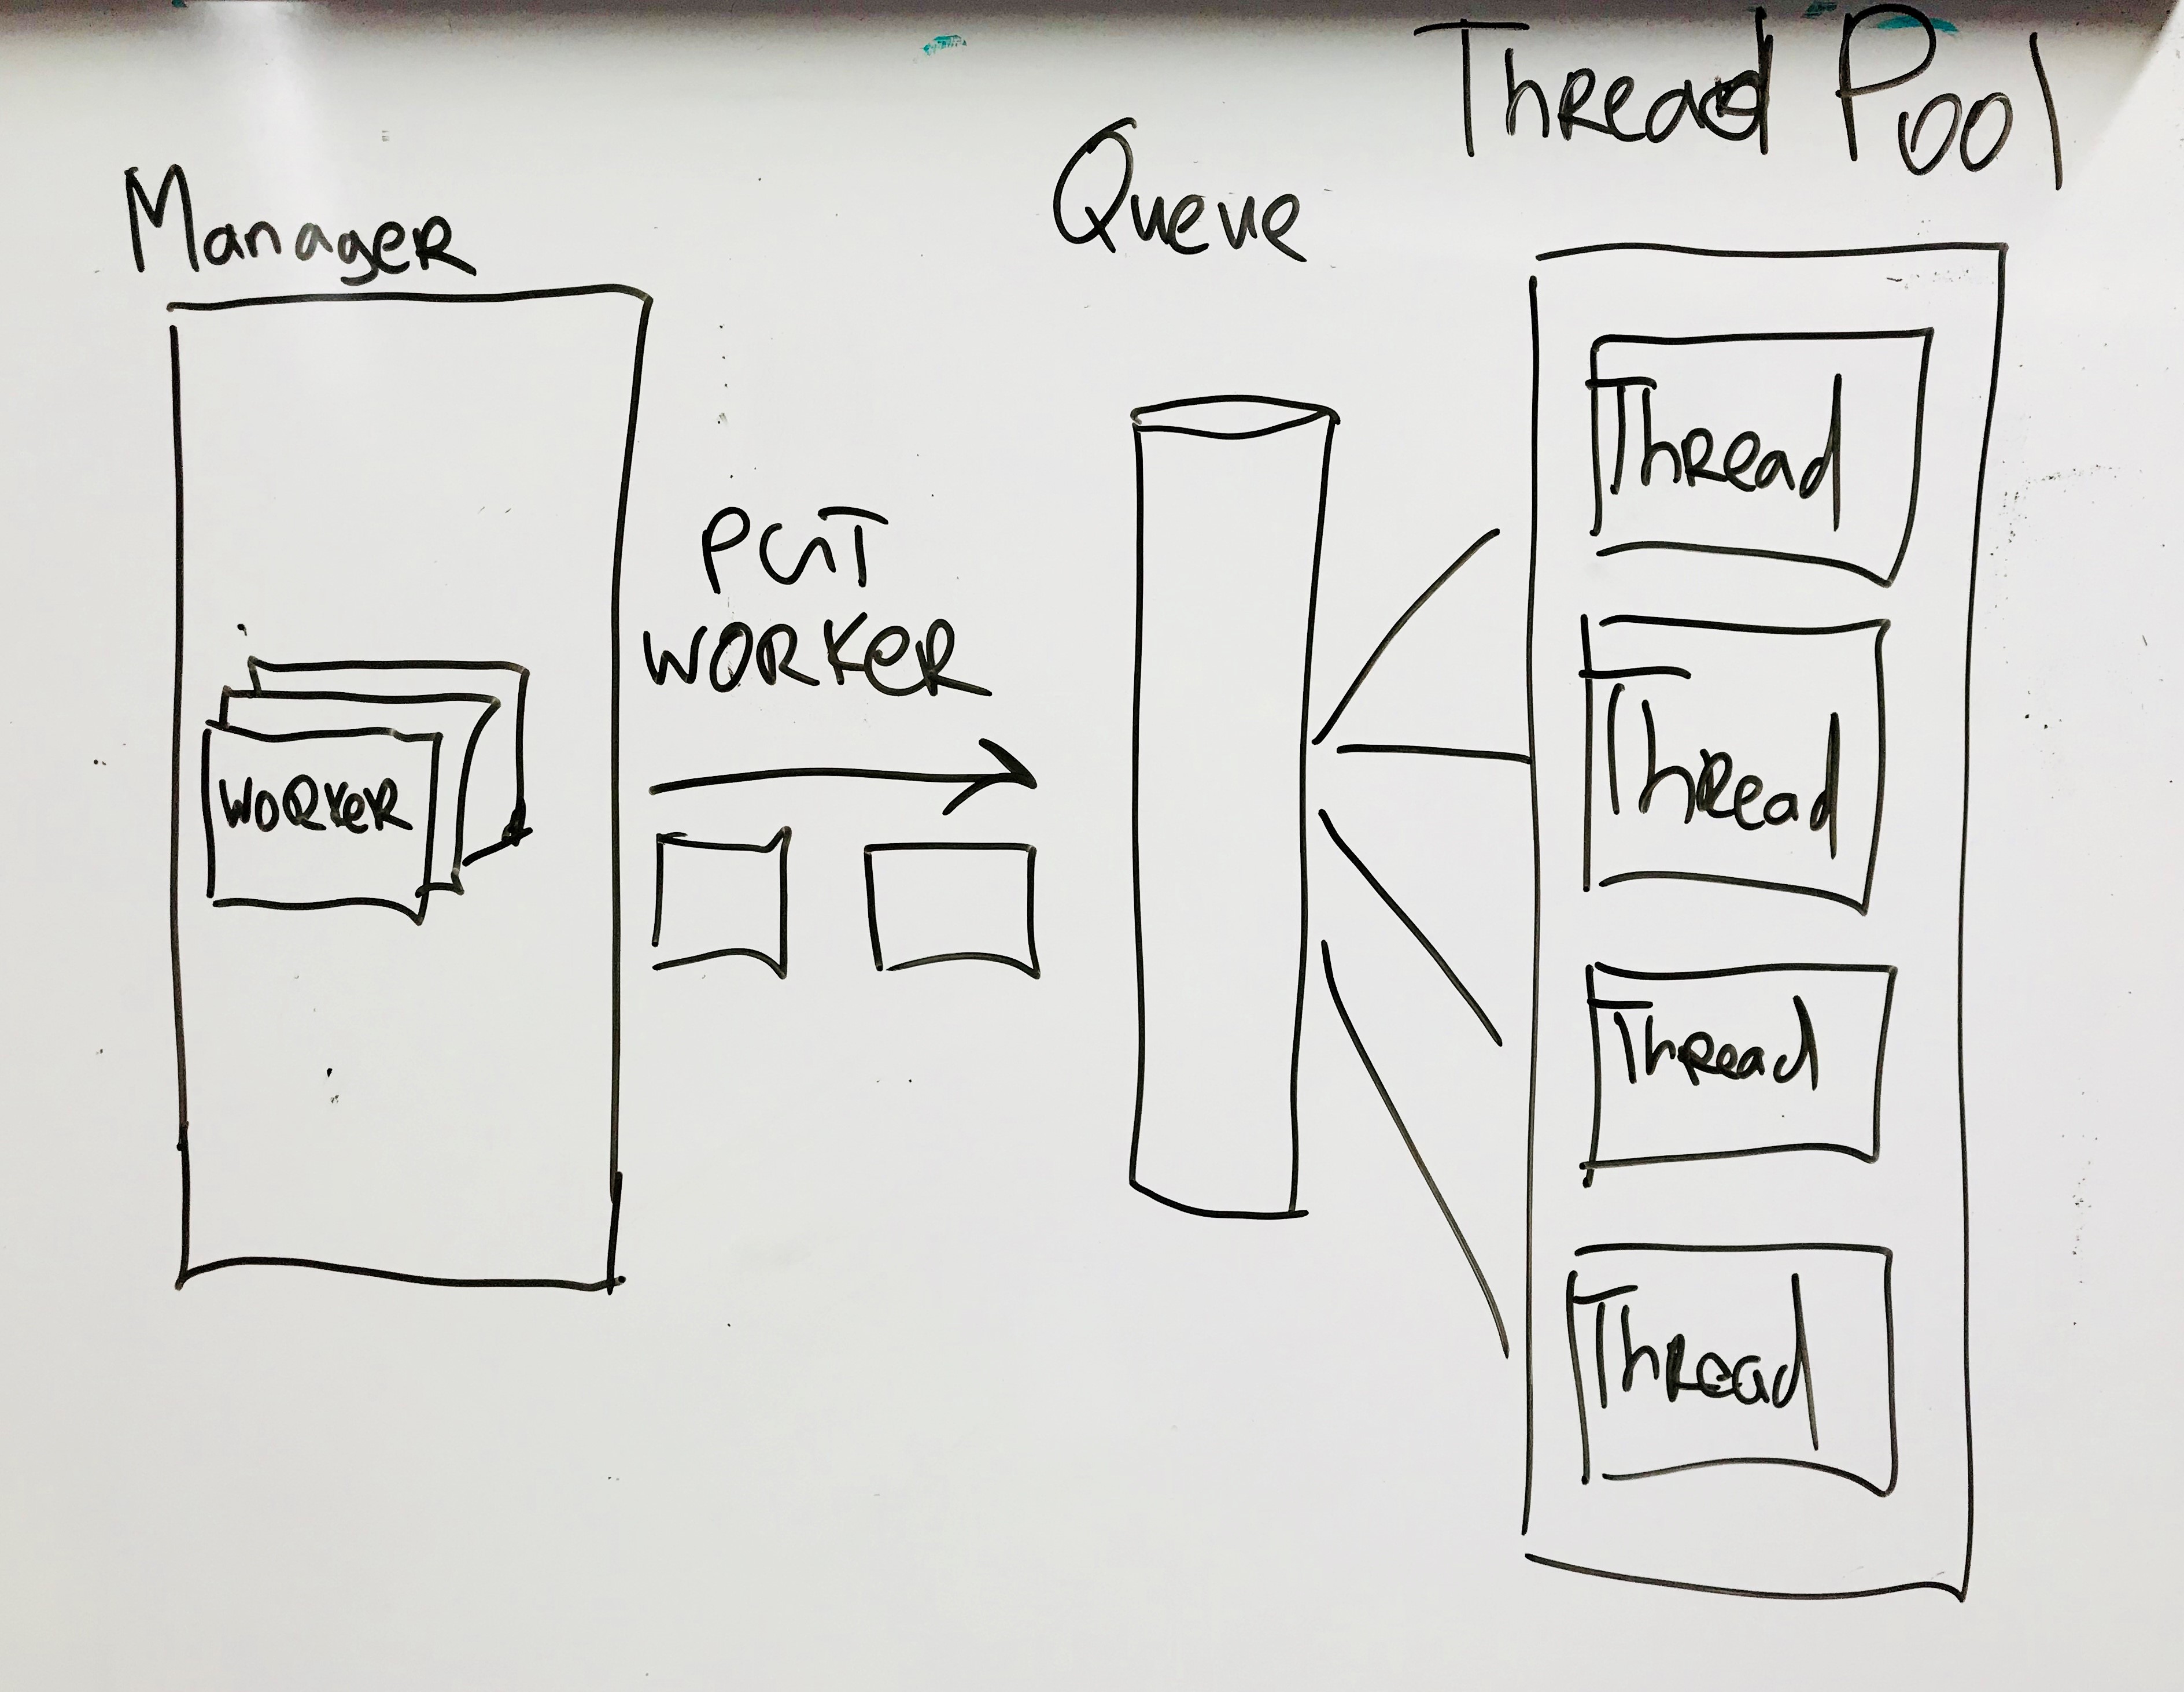
Workers are completely independent of each other, each cycle is executed through a pool of threads. Since most of the time is spent on I / O operations, Global Interpreter Lock Python does not greatly affect the result. The number of threads is set in the config; on the current configuration, the optimal number was 8 threads.
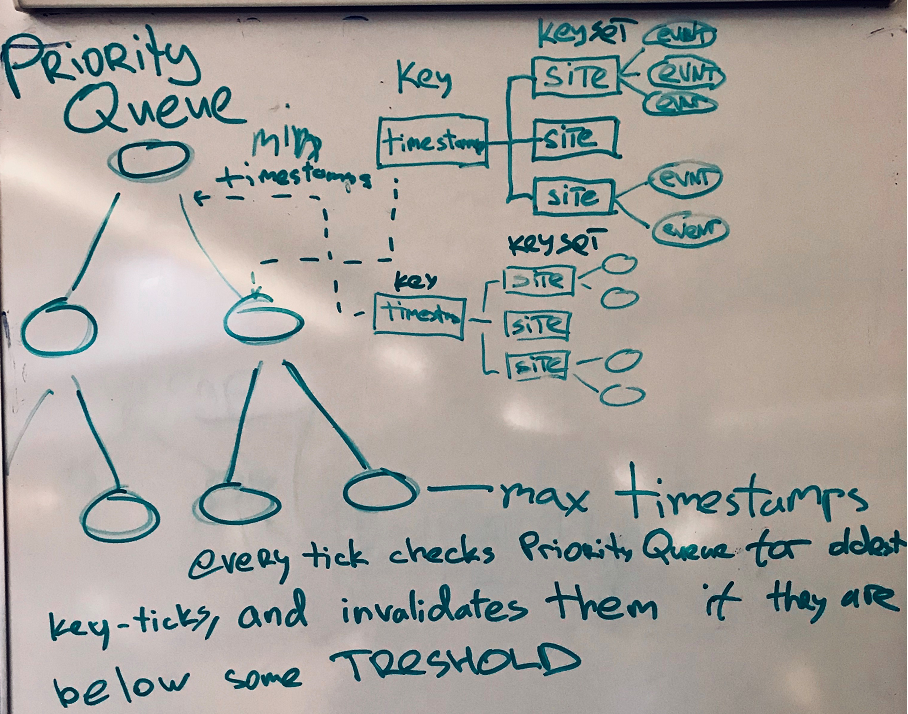
Now for the Consumer part. The component is subscribed to a topic in the queue, and when a message arrives it adds it to the dictionary associated with the tick and with each site. The system stores all the events in a certain window and deletes the oldest ones upon receipt of each new message. In order not to view the entire dictionary, the keys are stored in the Priority Queue, ordered by timestamp.
Architecturally, the component looks like this.
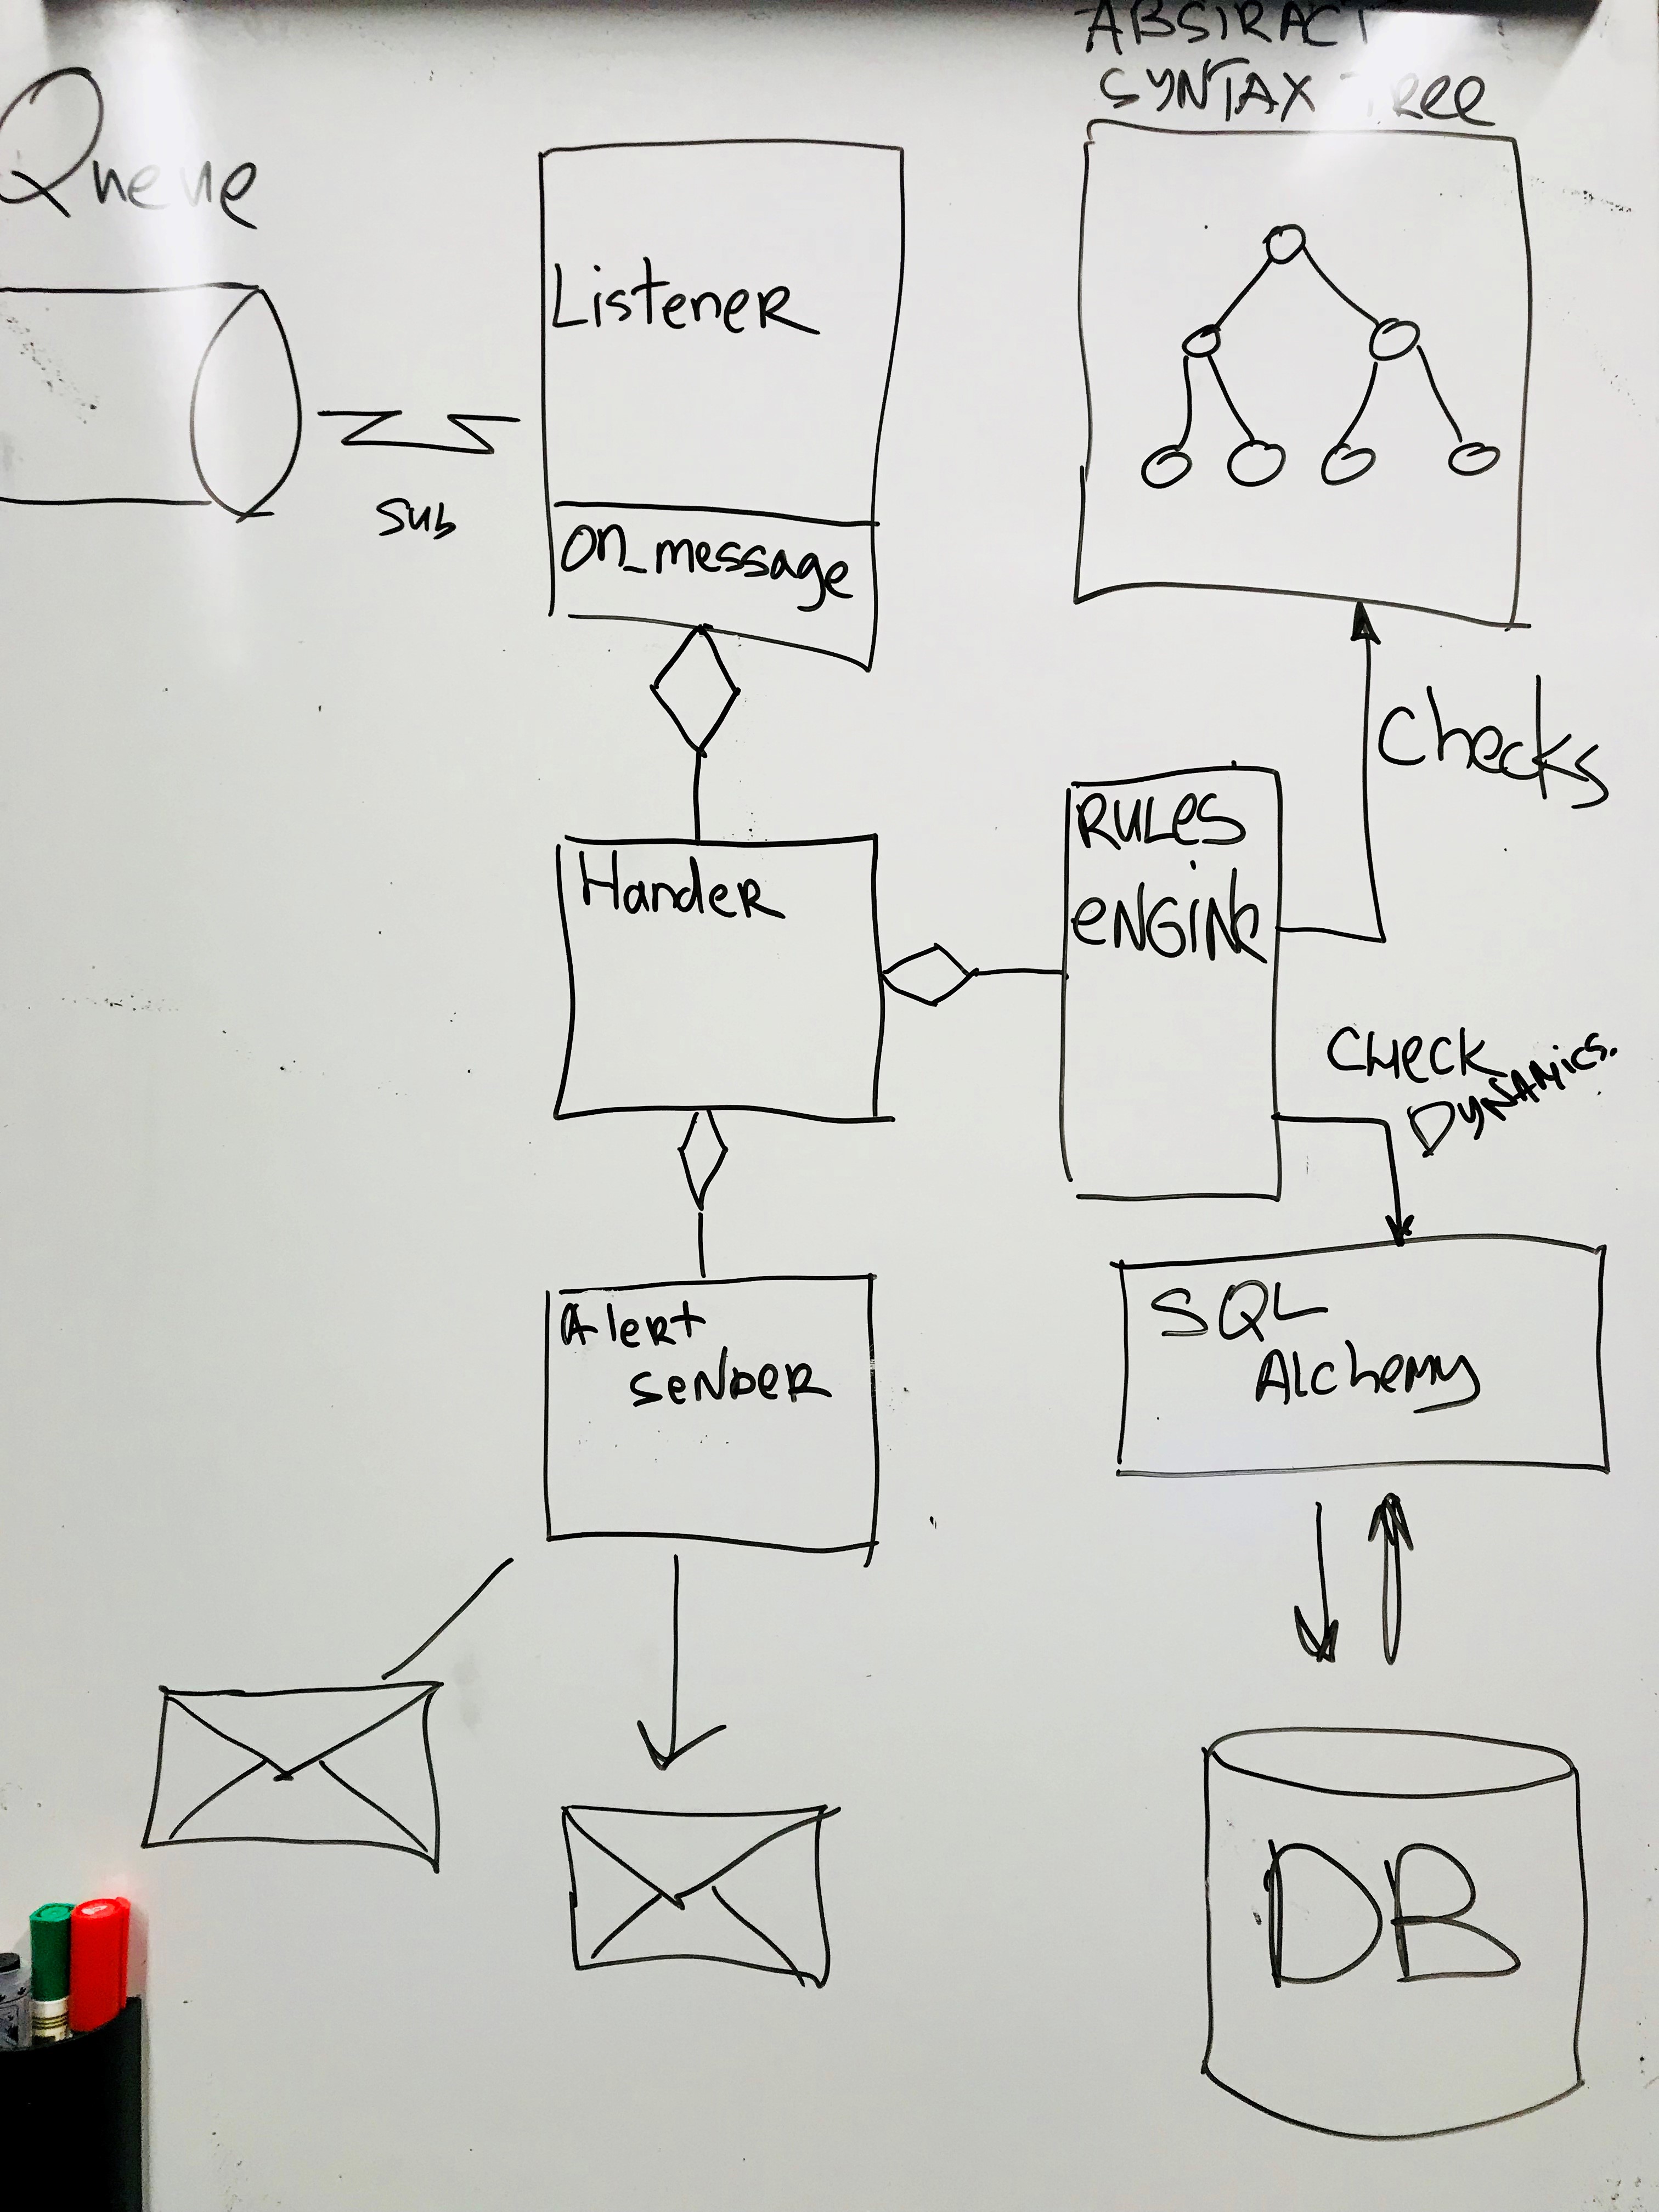
Each message is sent to the Rule Engine, and then the fun begins. At the very beginning of development, I rigidly set the rules in the code: when one metric falls and the other grows, then send an alert. But this solution is not universal and requires getting into the code for any extension. Therefore, I needed some kind of language that sets the rules. Then I had to remember the Abstract Syntactic Trees and define a simple language to describe the rules.
The rules are described in the YAML format, but you can use any other, just add your parser. Rules are defined as regular expressions for the names of metrics or simply for prefixes of metrics. Speed is the speed of degradation of metrics, more on that below.
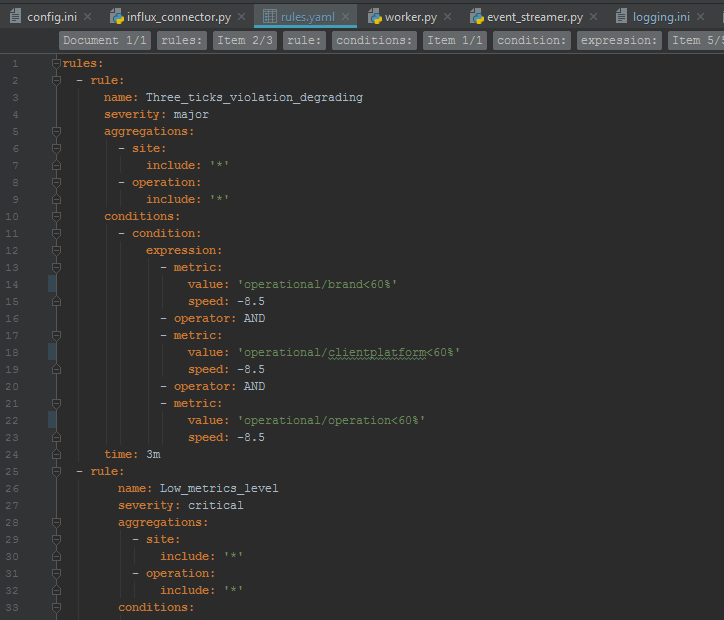
When the component is started, the rules are read and the syntax tree is built. When each message is received, all events from this site for one tick are checked according to the specified rules, and if the rule is triggered, an alert is generated. There are several rules that worked.
If we consider the dynamics of incidents developing in time, then we can also take into account the speed of the fall (severity level) and the change in speed (forecast severity change)
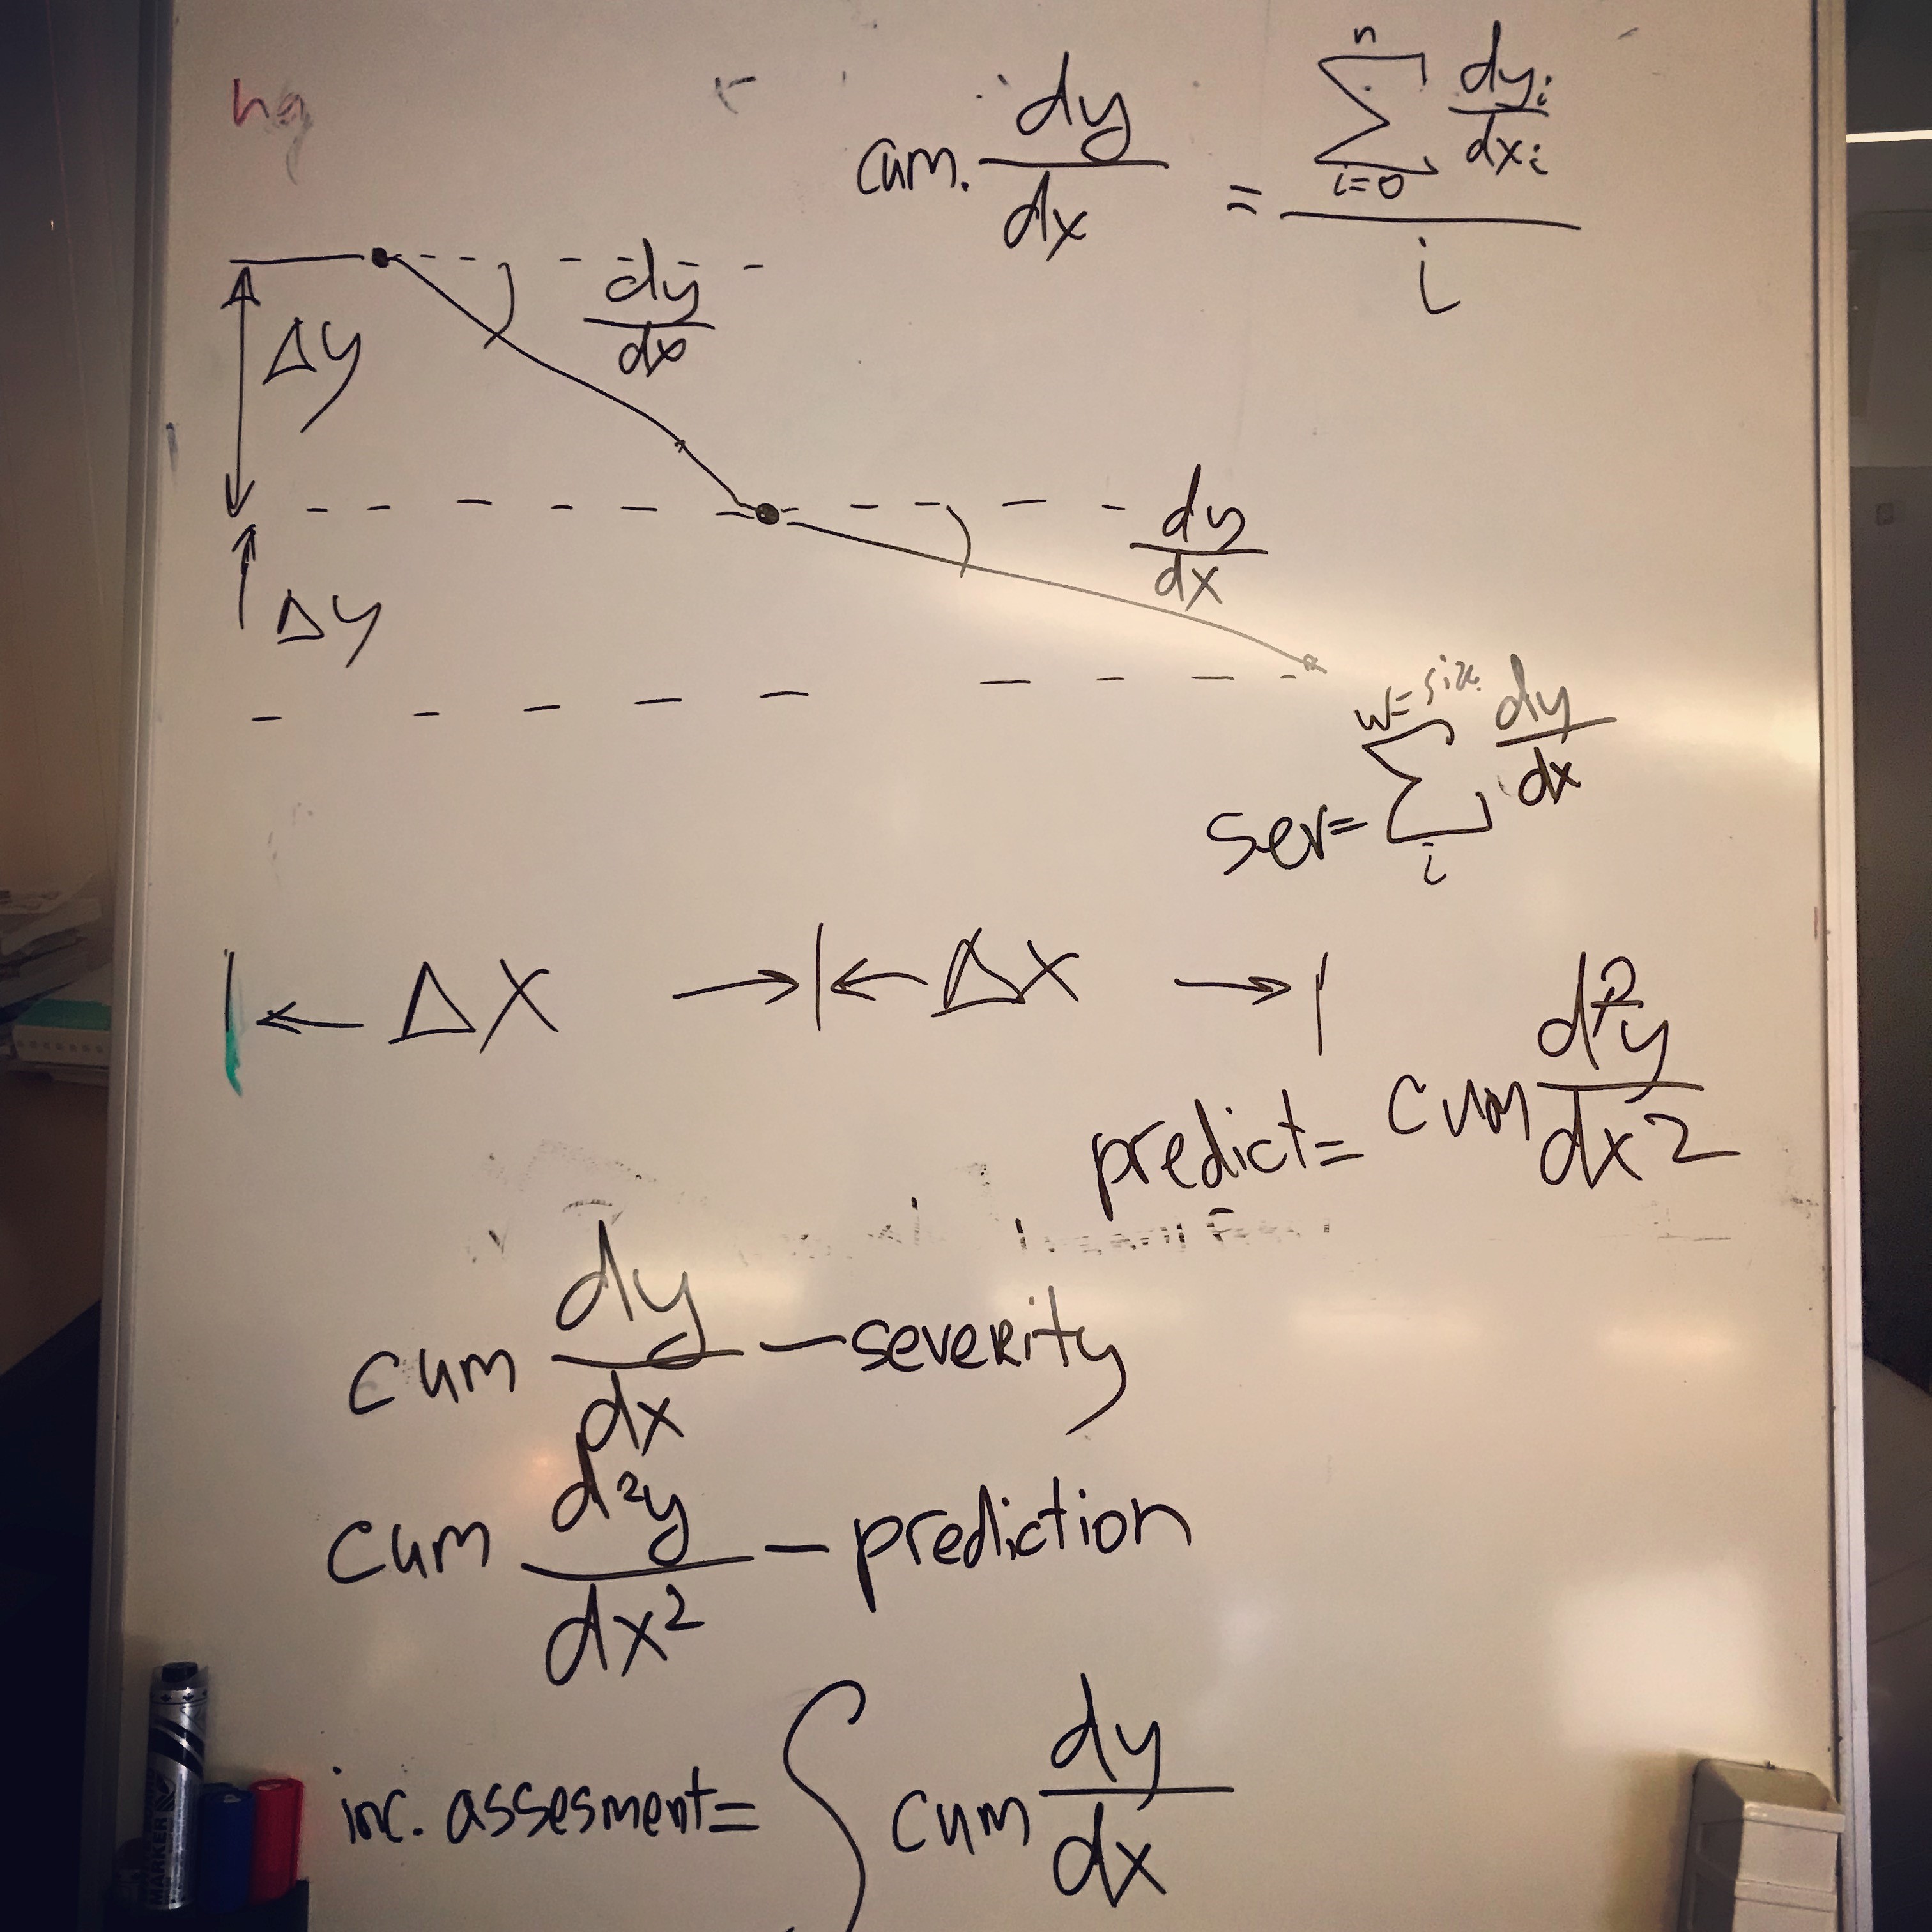
Velocity is the slope or discrete derivative, which is calculated for each violation. The same applies to acceleration, a discrete derivative of the second order.
These values can be set in the rules. Cumulative derivatives of the first and second orders can be taken into account in the overall assessment of the incident.
To store historical events using the database via ORM (SQL Alchemy)
So, we have a working backend. Now you need a user interface for managing the system and reporting on the metrics triggered by a specific rule.
I wanted to stay the maximum in one stack. And here comes Dash dash.plot.ly.
This is a framework for data visualization add-on over Flask and Plotly. You can make interactive web interfaces not in a week or two, but in a matter of hours. Not a single line of Javascript, easy extensibility, and the output is ReactJS-based WebUI and perfect integration with Python.
One of the components through the WebUI controls the start, stop, build of Workers. Since we do not know in what state the component storing the workers, whether the calculations have completed or not, all API calls go through messages (Remote Procedures Call over Messaging).
A separate component builds an on-demand dynamic report that contains metrics associated with this alert. When an alert is generated, a link to the report is generated in one of the properties. Also, if desired, it is possible to receive live stream.
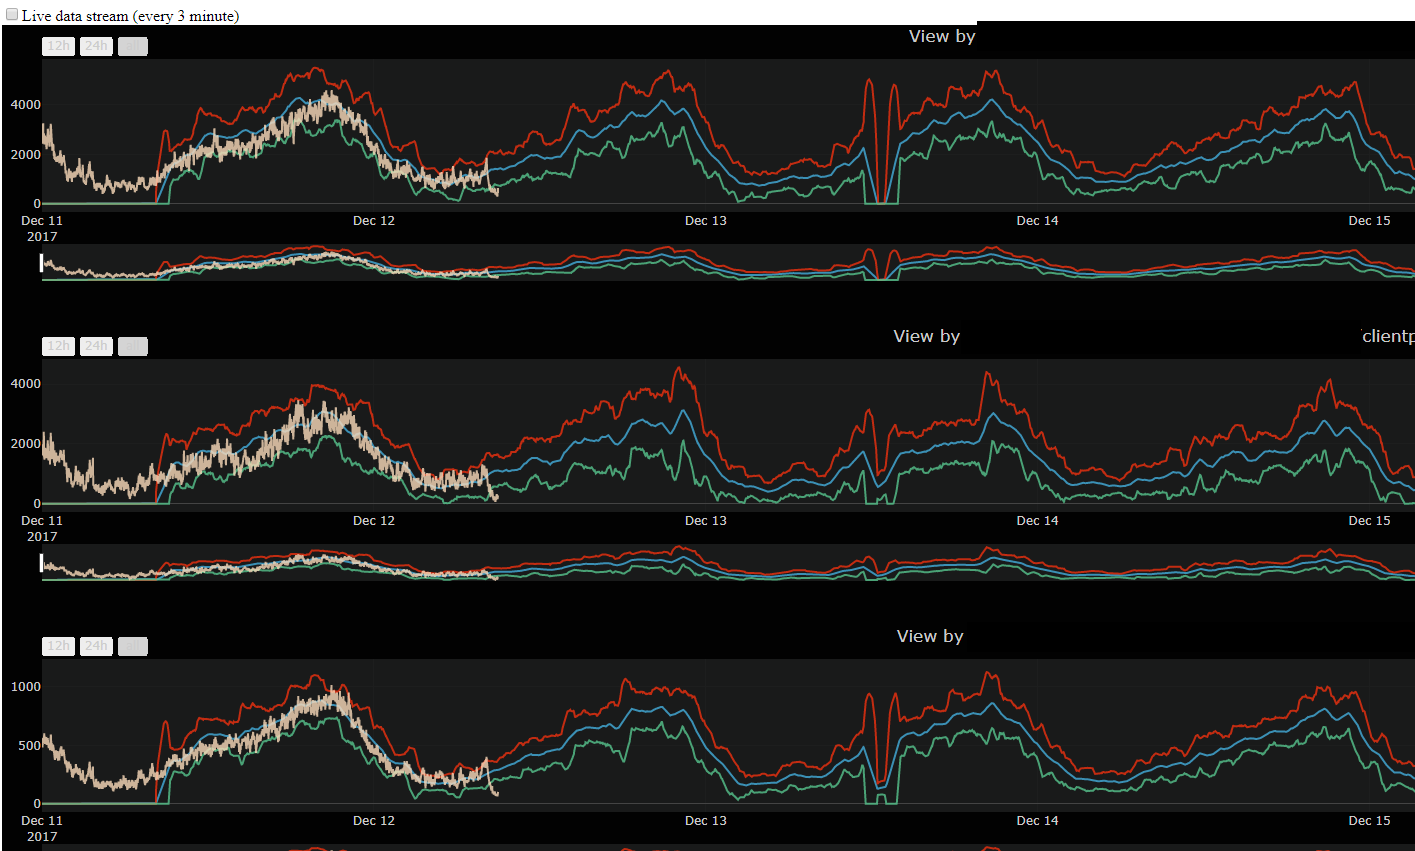
Integration with Grafana is also done and you can click on the link to go to Grafana.
There is one more moment. Since the alert flies every time the rules are triggered, with long downtime several alerts will be generated every minute. Need a system of accounting and deduplication. We already had such a system in the company and I integrated there, but my colleague found an excellent alternative solution.
Meet Alert .
This is a great tool that integrated very easily, including the user interface that I built into the WebUI system. Alerta has ready integration with Email, Slack, HipChat and so on. She can write Alerts back to influxDB for further visualization in Grafana.
From the moment of the first rally to the release in production, just over 6 months passed. We catch most of the incidents a few minutes earlier (on average 12-15) than the old alert system HP. In addition, the system detects and signals some problems that were slipping through other monitoring systems.
Now we are building up statistics in order to more precisely set up the rules. There are further plans for the development of the system, for example, try to look at the metrics through Convolution Networks (third-party project).
It was a very interesting adventure, on which we met abstract syntax trees, priority queues, matan and a lot more. At the moment, the system consists of 5 components (microservices), together with Alerta - 7 components. The company has the intention to release this system in open source, but this requires a few more months.
An adventure that is still ongoing.
Never fails
Monitoring distributed systems is quite a non-trivial task, where there are pitfalls. On the other hand, there are a huge number of both commercial and open-source solutions for various monitoring tasks. Under the cut on why open decisions did not fit us, what we understood from the analysis of successful and unsuccessful monitoring projects, and why it was decided to build Yet Another Alert System. It was a fascinating adventure, where at the stages from analyzing data in Python to the final solution and building the system, we met almost all of Computer Science and even a bit of matane.
If we consider the problem of monitoring in general, the tasks are divided into two main groups.
')
- Low Level Monitoring - monitoring infrastructure by the parameters of the CPU, Disk usage networking, Java Heap Usage, GC cycles and so on. Everything is quite simple here and there are many working ready-made solutions. In many cases, fairly simple thresholds; in the case of a JVM, you can monitor the regularity of the processes on the Java heap sawtooth graphs - increasing the frequency of the peaks may indicate problems in memory management and frequent GC cycles.
- High Level Monitoring - when business indicators (BI) or Key Performance Indicators (KPI) are selected as metrics, such as volumes of user sessions, transactions, payments, etc. Low level monitoring cannot adequately reflect what is happening in the system at the level of business logic.
Why is it difficult?
- Monitoring a complex distributed system is already an engineering problem in itself
- Various problems lead to implicit changes in system behavior.
- Many different metrics of one system
- Different metrics correlate among themselves
I work as a Technical Architect in a large company, and we have problems with timely detection of problems in production systems.
We operate financial transactions in highly regulated markets. The system architecture is service-oriented, the components have complex business logic, there are different backend options for different clients of the (B2B) company.
Low level monitoring and tests do not cover a whole range of problems.
Firstly, due to the high complexity of the products and the huge number of settings, there are situations when incorrect settings lead to degradation of financial indicators, or hidden bugs in the logic affect the overall functionality of the entire system.
Secondly, there are specific 3d-party integration for different countries, and the problems arising from the partners begin to flow to us. Problems of this kind are not caught by low level monitoring; to solve them, you need to monitor key indicators (KPI), compare them with system statistics and look for correlations.
The company had previously implemented a solution from Hewlett Packard Service Health Analyzer, which was (to put it mildly) imperfect. Judging by the marketing prospectus, it is a system that studies itself and provides early detection of problems. In fact, it was a black box that could not be configured, with all the problems needed to contact HP and wait for months until the support engineers did something that wouldn't work as well. And yet - a terrible user interface, an old JVM ecosystem (Java 6.0), and, most importantly, a large number of False Positives and (worse,) False Negatives, that is, some serious problems were either not detected or were caught much later than it should , which was expressed in a very specific financial loss.
The figure shows that the granularity of SHA is 15 minutes - this means that even in case of problems, the minimum reaction time is 15 minutes ...
That is, it all often looked something like this ...
On the shoulders of giants
Many companies tried to build their monitoring systems. These were not always success stories.
Etsy - Kale System
Etsy is an online marketplace for handmade goods. The headquarters of the company is located in New York. The company collected more than 250,000 different metrics from its servers and tried to look for anomalies in the metrics using complex mathematical algorithms. But…
Meet Kale.
One of the problems Kale was that the system used a lot of different technological stacks. In the diagram you can see 4 different stacks, plus 2 frameworks. To develop and maintain the system, highly skilled engineers were required who were familiar with these stacks. The search for bugs also required knowledge in many stacks.
The second problem is the monitoring approach itself. Kale was only looking for anomalies. But if you have 250,000 metrics, then for every tick hundreds of anomalies will be statistically observed. If you expand the permissible limits, then problems will slip. If narrowed, there will be a huge number of false positives.
Etsy engineers tried to fight the number False Positives, but after three years of development the project was closed. On this topic there is a good video from Andrew Clegg.
I want to highlight one slide from this video.
Finding anomalies is more than catching outliers. Outliers emissions will be observed on any real production data in normal operation mode. Not all anomalies should lead to alarm triggering at all levels.
A universal approach is not suitable for anything; There are no free lunches. That's why HP's SHA solution doesn't work as it should, trying to be a versatile tool.
And interestingly, the possible approaches to solving these problems.
Send an alert on anomalies in business and user metrics
Use other metrics for root cause analysis.
Google SRE teams BorgMon
The book Site Reliability Engineering has a whole chapter devoted to the issue of monitoring the production of Google systems. In short,
- Google aimed for simpler and faster monitoring systems with better tools for post hoc analysis.
- Their goal was to avoid magical systems that automatically teach thresholds or automatically seek correlations. A person should be well aware of what is happening in the system and according to what rules alerts are generated.
- The rules for problem response systems were kept as simple as possible. They gave a very fast response time to simple, localized, serious anomalies.
- A person should be well aware of what is happening in the system and according to what rules alerts are generated.
On these principles, Google built a successful BorgMon system.
Time series
Time series is a data series indexed by time. If we take as a series of economic processes (from the production of champagne to sales in stores or online transactions), then they have some common properties: the processes are regular, have a certain frequency, usually have seasonal periods and trend lines. Using this information, you can simplify the analysis.
Take a weekly series of real data on the number of transactions. We can see a pronounced regularity (two peaks are performance tests). There is daily regularity, plus an increase in activity on Friday and on weekends, after which the activity begins to subside until the next weekend.
On Habré there were many quite good materials on this subject, for example here .
On Medium there is my introduction to time series modeling (in english): Time series modeling .
In a nutshell: each measurement contains signal components and measurement / noise errors. There are many factors that affect both the processes themselves and the metrics collected.
Point = Sig + err
We have a model that describes the signal. If the model is subtracted from the measurement, then the better the model captures the signal, the more the result of the subtraction will tend to stationarity or white noise - and this is easy to verify.
In an article on Medium, I gave examples of modeling linear and segmented regression.
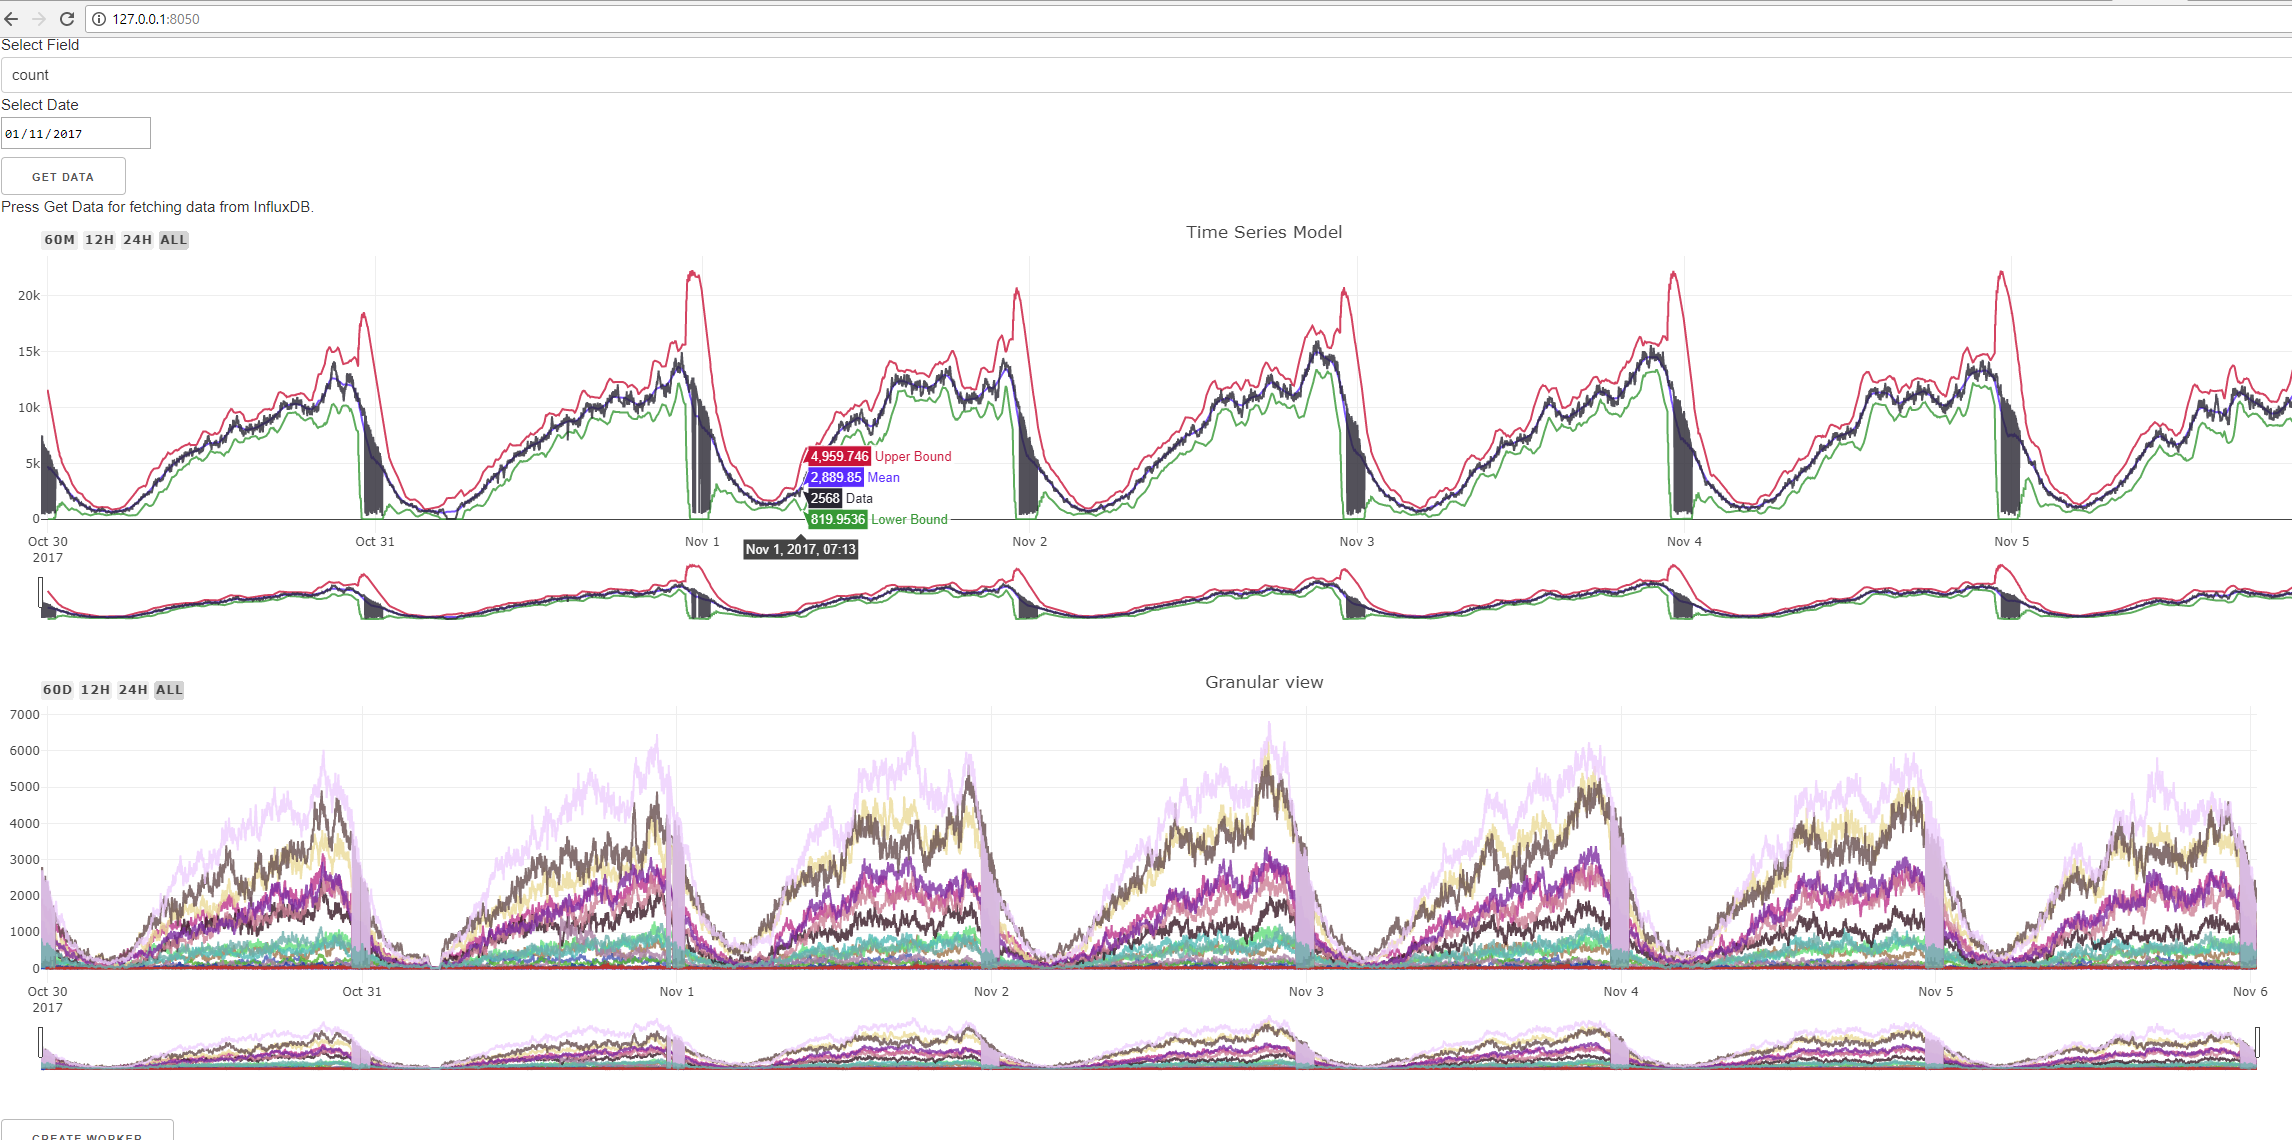
For the monitoring system, I chose modeling using sliding statistics for mean and scatter. The moving average is essentially a low pass filter that smooths the noise and leaves the main trend lines. Here are our data on the number of transactions in another week, after the passage of the moving average with a window of 60 minutes (peaks removed):
We also collect and moving variance to set the permissible boundaries of the model. As a result, we get something from Salvador Dali.
We enter here the data for another week and we can immediately see outliers.
Now we have everything we need to build our Alert System.
An important digression.
The Kale project experience speaks about a very important point. Alerting is not the same as searching for anomalies and outliers in metrics, since, as already mentioned, there will always be anomalies on single metrics.
In fact, we have two logical levels.
- The first is to search for anomalies in the metrics and send a notification of the violation, if an anomaly is found. This is the level of issue of information.
- The second level is a component that receives information about violations and decides whether this is a critical incident or not.
In this way, we humans act when we investigate a problem. We look at something, if we detect deviations from the norm, we look again, and then make a decision based on the observations.
At the beginning of the project, we decided to try Kapacitor, since it has the ability to define custom functions in Python. But each function sits in a separate process, which would create an overhead for hundreds and thousands of metrics. Because of this and some other problems, it was decided to abandon it.
For building your own system, Python was chosen as the main stack, because there is an excellent ecosystem for data analysis, fast libraries (pandas, numpy, etc.), excellent support for web solutions. You name it.
For me, this was the first big project, fully and entirely executed in Python. I myself came to Python from the Java world. I did not want to multiply the zoo of stacks for one system, which was ultimately rewarded.
General architecture.
The system is built as a set of loosely coupled components or services that spin in their processes on their Python VM. This is natural for a general logical partitioning (events emitter / rules engine) and gives other advantages.
Each component does a limited number of specific things. In the future, this will allow you to quickly expand the system and add new user interfaces without affecting the basic logic and not being afraid to break it. Between the components are fairly clear boundaries.
Distributed deploy is convenient if you need to locate the agent locally to closer to the site that it monitors - or you can aggregate together a large number of different systems.
Communication must be message-based, since the entire system must be asynchronous.
I chose ActiveMQ as the Message Queue, but if I want to change, for example, with RabbitMQ, there will be no problems, since all the components communicate using the standard STOMP protocol.
Event streamer is a component that stores statistical models, selects data at certain intervals, and finds outliers. It is quite simple ustroen:
Worker is the main working unit that stores one model of the same metric along with meta-information. It consists of the date of the connector and the handler to which the data is transmitted. The handler tests them on a statistical model, and if it detects violations, then sends them to the agent, which sends the event to the queue.
Workers are completely independent of each other, each cycle is executed through a pool of threads. Since most of the time is spent on I / O operations, Global Interpreter Lock Python does not greatly affect the result. The number of threads is set in the config; on the current configuration, the optimal number was 8 threads.
Now for the Consumer part. The component is subscribed to a topic in the queue, and when a message arrives it adds it to the dictionary associated with the tick and with each site. The system stores all the events in a certain window and deletes the oldest ones upon receipt of each new message. In order not to view the entire dictionary, the keys are stored in the Priority Queue, ordered by timestamp.
Architecturally, the component looks like this.
Each message is sent to the Rule Engine, and then the fun begins. At the very beginning of development, I rigidly set the rules in the code: when one metric falls and the other grows, then send an alert. But this solution is not universal and requires getting into the code for any extension. Therefore, I needed some kind of language that sets the rules. Then I had to remember the Abstract Syntactic Trees and define a simple language to describe the rules.
The rules are described in the YAML format, but you can use any other, just add your parser. Rules are defined as regular expressions for the names of metrics or simply for prefixes of metrics. Speed is the speed of degradation of metrics, more on that below.
When the component is started, the rules are read and the syntax tree is built. When each message is received, all events from this site for one tick are checked according to the specified rules, and if the rule is triggered, an alert is generated. There are several rules that worked.
If we consider the dynamics of incidents developing in time, then we can also take into account the speed of the fall (severity level) and the change in speed (forecast severity change)
Velocity is the slope or discrete derivative, which is calculated for each violation. The same applies to acceleration, a discrete derivative of the second order.
These values can be set in the rules. Cumulative derivatives of the first and second orders can be taken into account in the overall assessment of the incident.
To store historical events using the database via ORM (SQL Alchemy)
So, we have a working backend. Now you need a user interface for managing the system and reporting on the metrics triggered by a specific rule.
I wanted to stay the maximum in one stack. And here comes Dash dash.plot.ly.
This is a framework for data visualization add-on over Flask and Plotly. You can make interactive web interfaces not in a week or two, but in a matter of hours. Not a single line of Javascript, easy extensibility, and the output is ReactJS-based WebUI and perfect integration with Python.
One of the components through the WebUI controls the start, stop, build of Workers. Since we do not know in what state the component storing the workers, whether the calculations have completed or not, all API calls go through messages (Remote Procedures Call over Messaging).
A separate component builds an on-demand dynamic report that contains metrics associated with this alert. When an alert is generated, a link to the report is generated in one of the properties. Also, if desired, it is possible to receive live stream.
Integration with Grafana is also done and you can click on the link to go to Grafana.
There is one more moment. Since the alert flies every time the rules are triggered, with long downtime several alerts will be generated every minute. Need a system of accounting and deduplication. We already had such a system in the company and I integrated there, but my colleague found an excellent alternative solution.
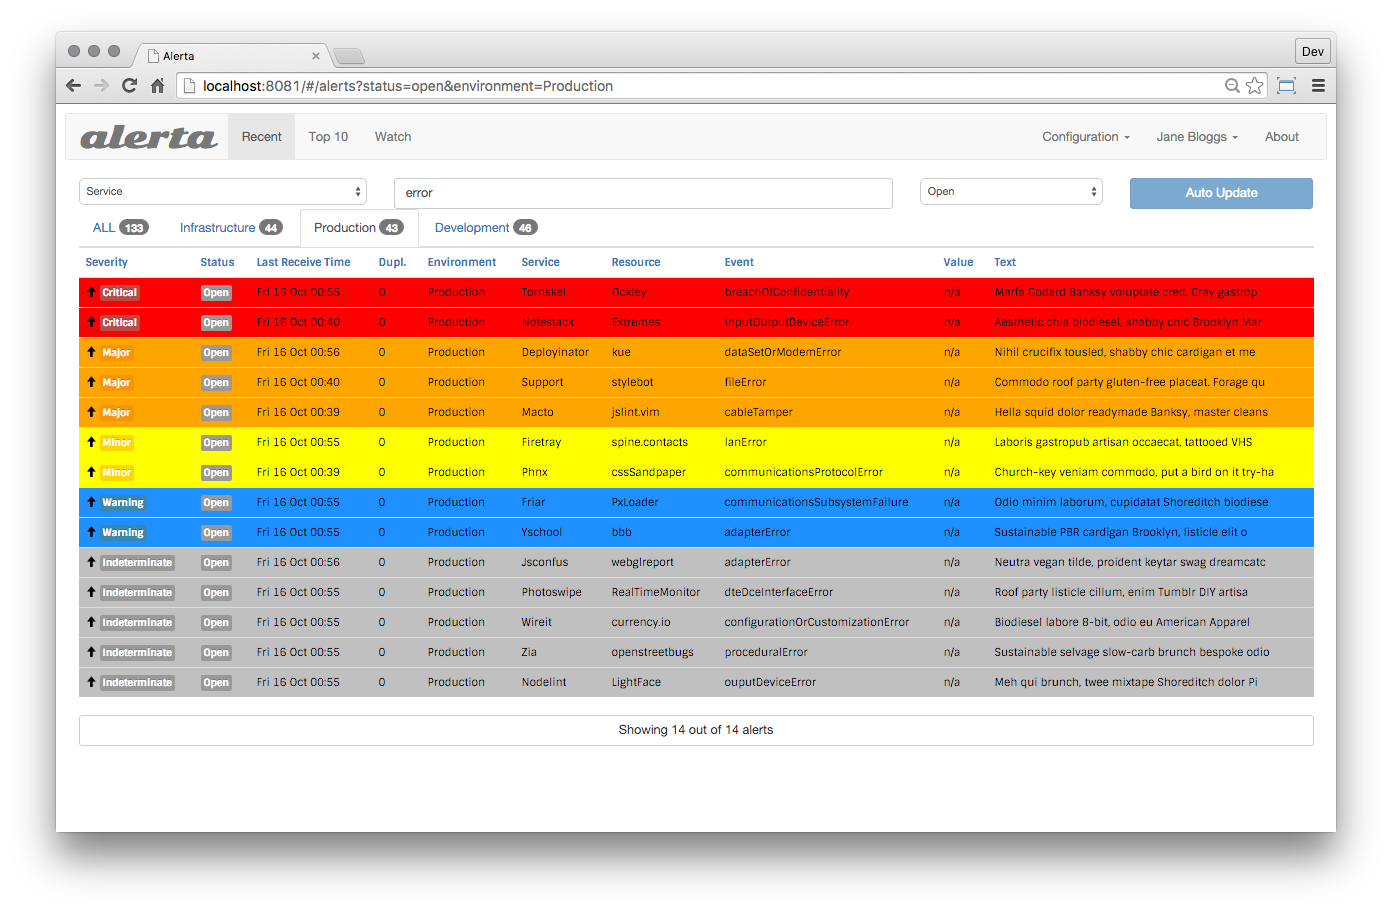
Meet Alert .
At-a-glance 'visualization. If you’re on a single screen.Alert is a tool used to consolidate and deduplicate signals from many sources along with their visualization and accounting.
This is a great tool that integrated very easily, including the user interface that I built into the WebUI system. Alerta has ready integration with Email, Slack, HipChat and so on. She can write Alerts back to influxDB for further visualization in Grafana.
From the moment of the first rally to the release in production, just over 6 months passed. We catch most of the incidents a few minutes earlier (on average 12-15) than the old alert system HP. In addition, the system detects and signals some problems that were slipping through other monitoring systems.
Now we are building up statistics in order to more precisely set up the rules. There are further plans for the development of the system, for example, try to look at the metrics through Convolution Networks (third-party project).
It was a very interesting adventure, on which we met abstract syntax trees, priority queues, matan and a lot more. At the moment, the system consists of 5 components (microservices), together with Alerta - 7 components. The company has the intention to release this system in open source, but this requires a few more months.
An adventure that is still ongoing.
Source: https://habr.com/ru/post/352980/
All Articles