Splunk - Installing agents to collect Windows and Linux logs
We are often asked questions about how to load various data into Splunk . One of the most common sources of interest turned out to be the Windows and Linux logs, which allow you to track and manage operating system problems. By uploading data to Splunk, you can analyze the performance of all systems in one place, even when you have dozens or hundreds of different sources.
In this article we will explain step by step how to load data from Windows and Linux into Splunk for further processing and analysis.
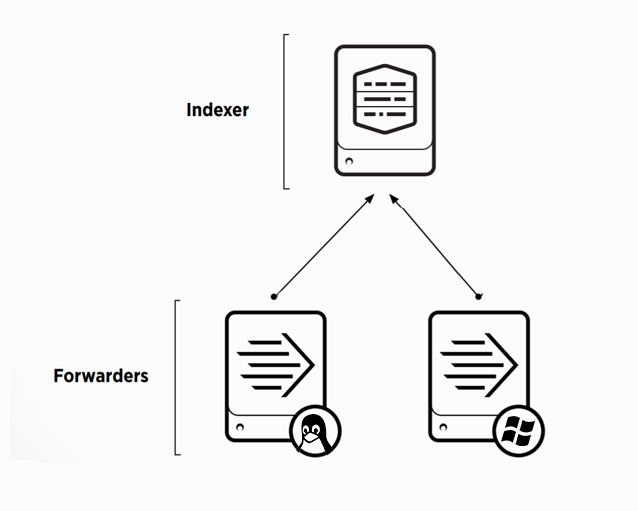
In order to start collecting data we need the following system elements:
')
In order to upload logs to Splunk, you must first configure the indexer, this will require:
At this stage, we finish the preliminary adjustment of the indexer and proceed to installing the agents on Windows and Linux machines.
A universal tool for uploading logs is a special agent - Splunk Universal Forwarder . Universal Forwarder is a version of Splunk Enterprise with significantly limited functionality, the only task of which is to collect data from the host and send it.
Download it at this link .
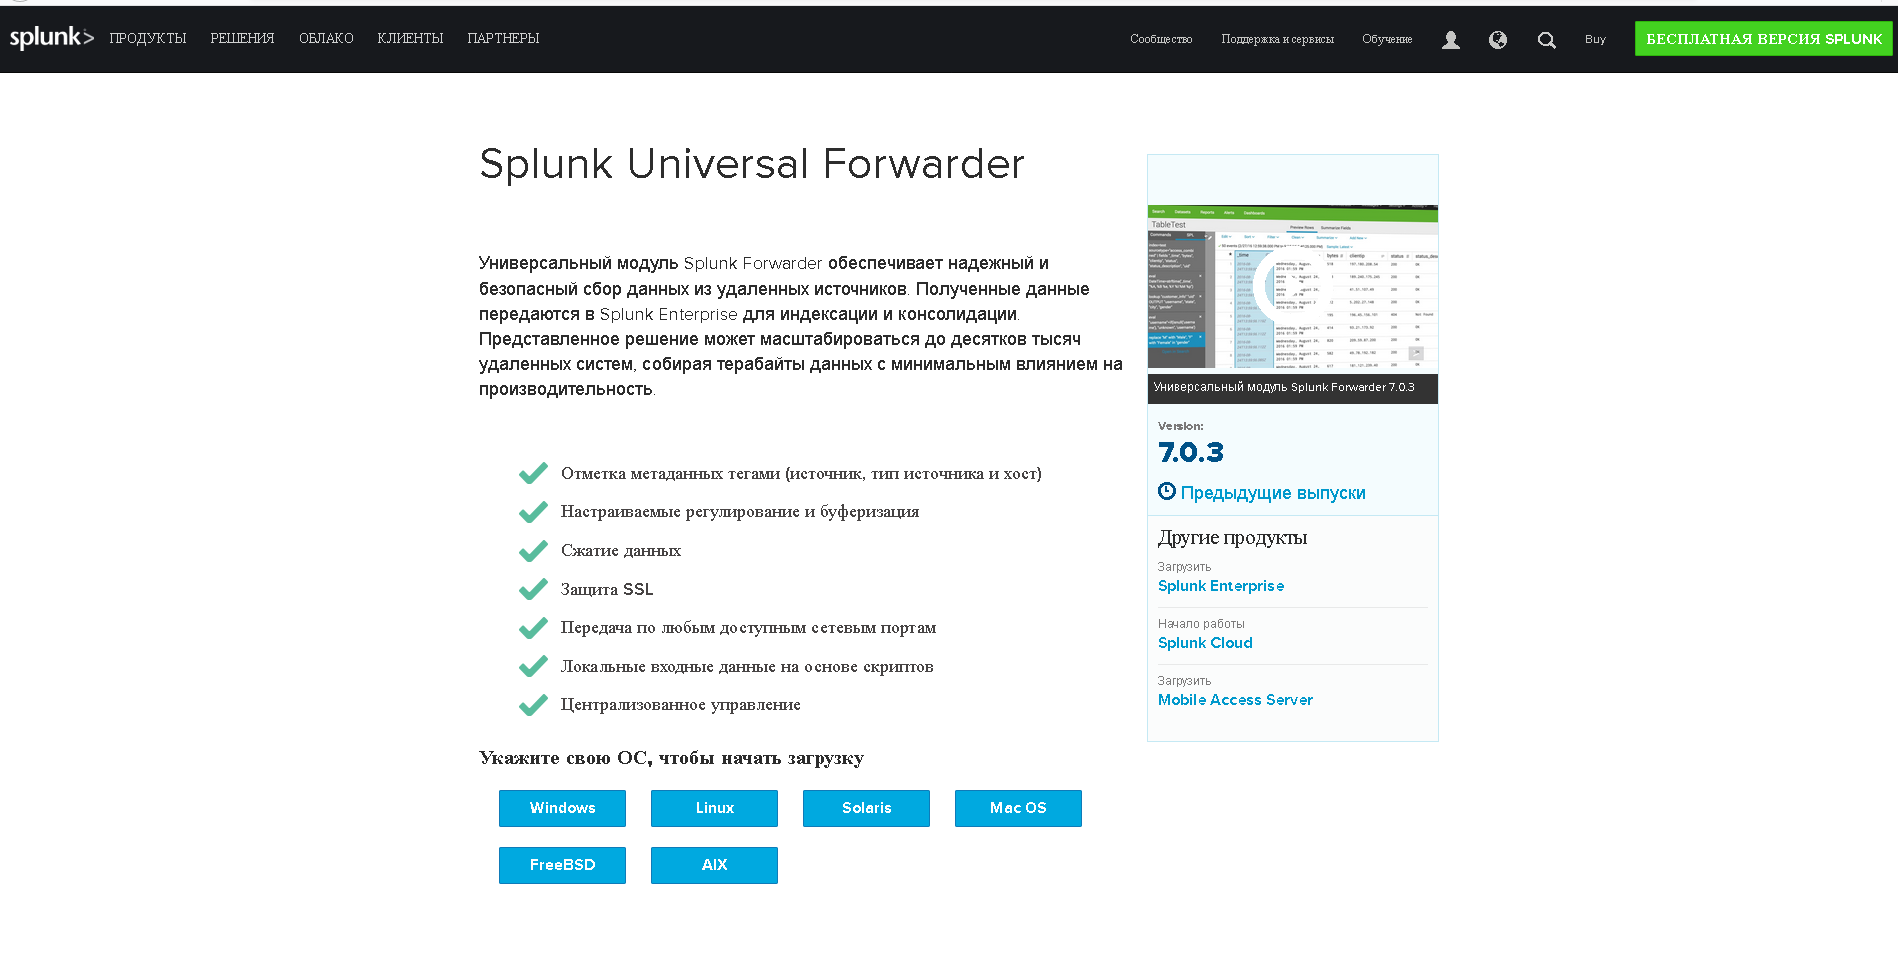
The picture above shows that Universal Forwarder can be installed on both Windows and Linux, Solaris and other operating systems.
1. Install Universal Forwarder
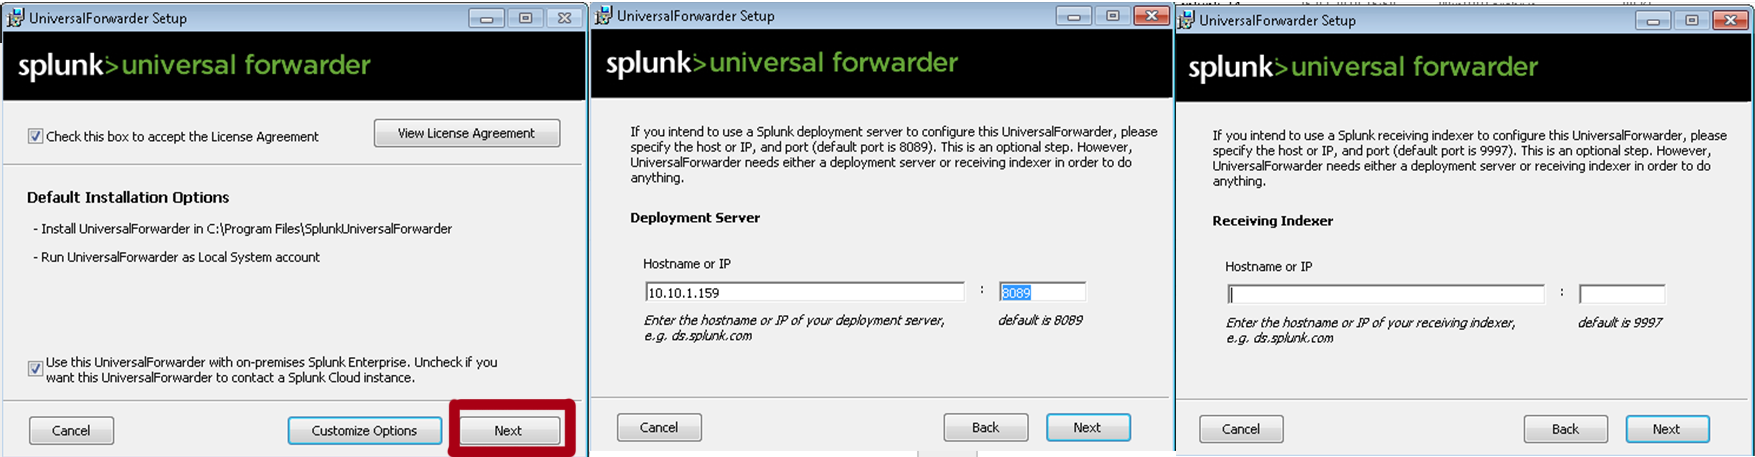
We specify the IP address or the name of the Splunk indexer as the Deployment Server , where we created the application “Send to indexer”. The default port is 8089 . Leave the Receiving Indexer section empty, since these functions will be performed by “Send to indexer”.
2. The next step we need to go back to Splunk and define the server class for the application "Send to indexer".
The server class is something like a rule in which we specify which applications we will distribute between which target client machines. The criteria for the formation of different server classes can be the type of machine, operating system, geographical area or type of application, and the classes can overlap with each other. (You can read more on the official website )
Settings - Forwarder Management - edit action - add new classes.

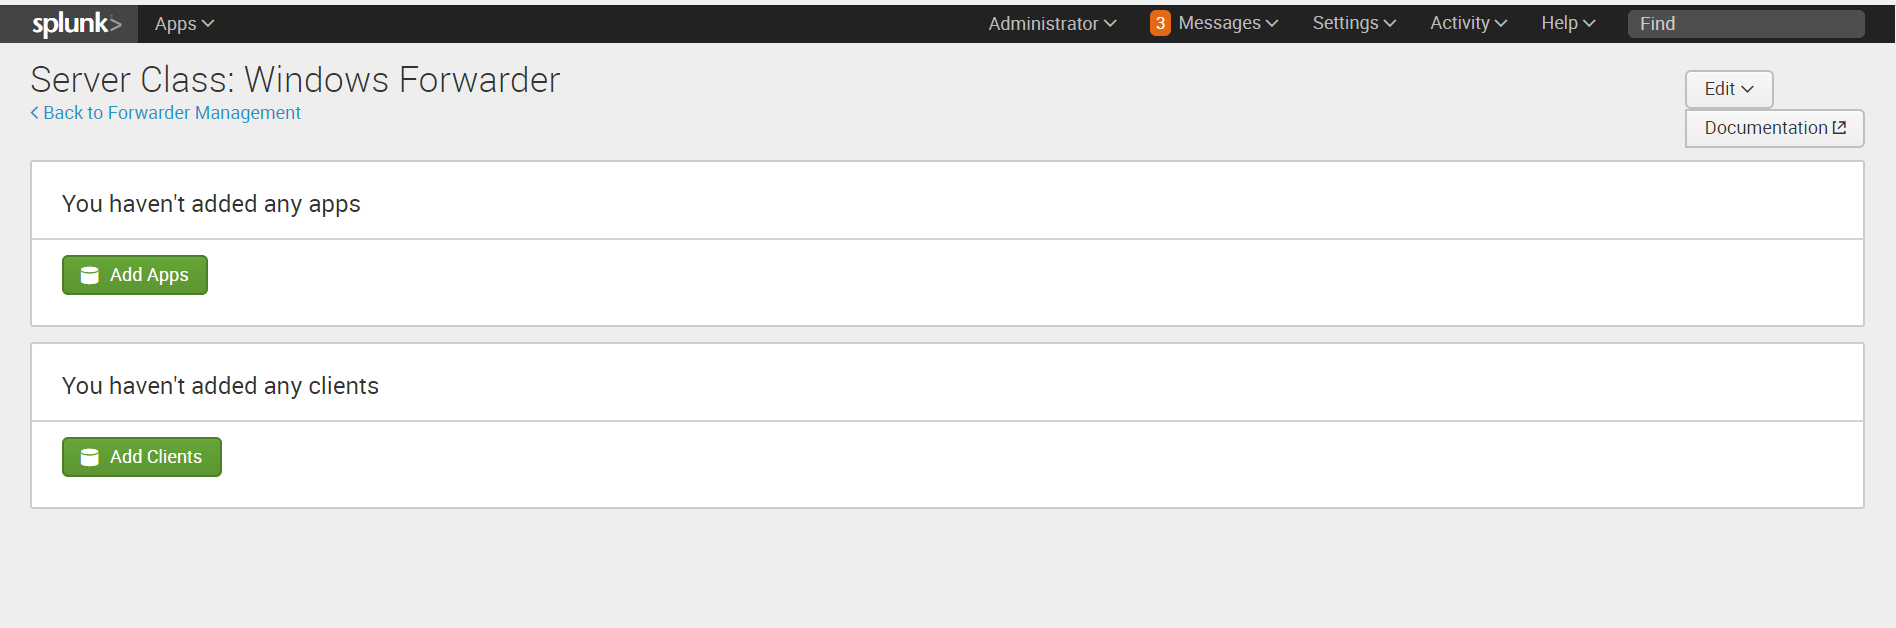
3. After saving, you will be prompted to add applications that we will send and target systems, the so-called clients, to whom we will send them.
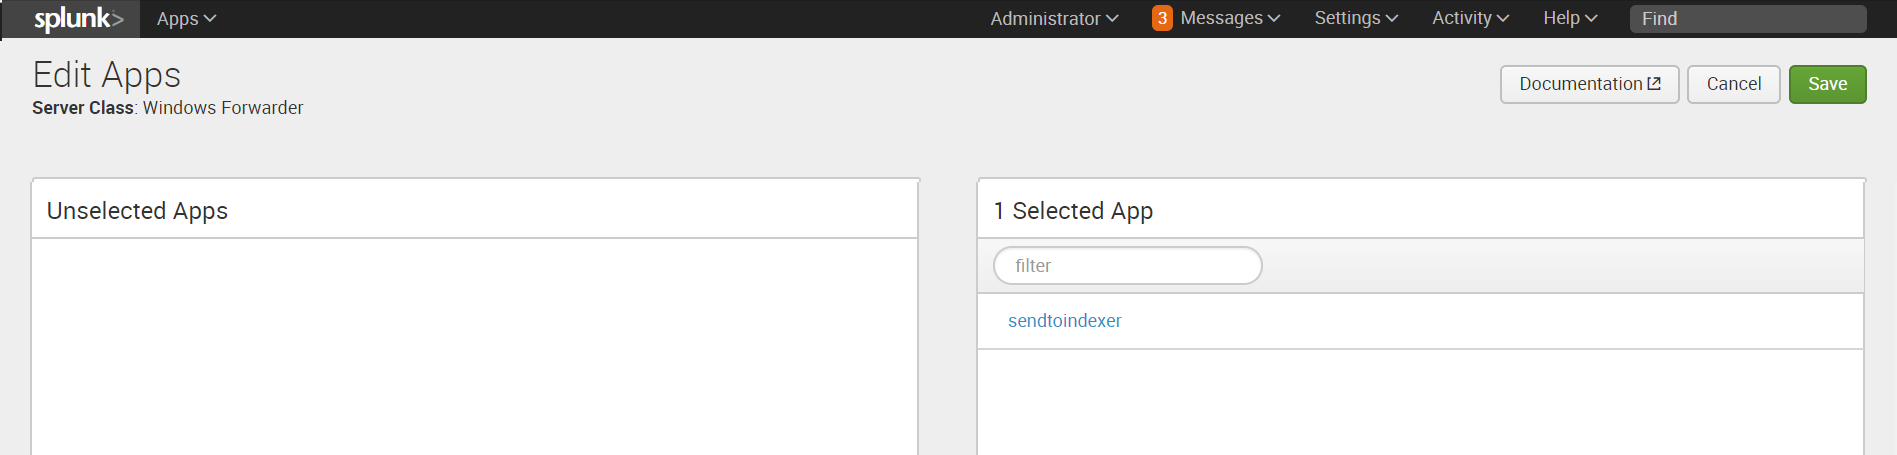
Add " Send to indexer " in the application section.
4. Then add the client. The client will be our Windows machine on which we installed Universal Forwarder. If Universal Forwarder was installed correctly, then the machine should appear in the list of clients connected to the Deployment Server . We put it in Include (whitelist) .

5. Check whether everything works correctly, looking at the contents of the index _internal . After adding “Send to indexer” to the Universal Forwarder server class, it starts sending its internal logs there. Also in this index, we can further monitor whether our agents are working properly.
6. Next, download a special Add-on from SplunkBase , which allows you to collect data on the work of Windows.
7. Install the application on Splunk-Indexer ( Apps - Manage Apps - Install app from file )
By default, it is installed in the directory ... \ Splunk \ etc \ apps \ Splunk_TA_windows , but we need to copy it to the deployment-apps folder so that this application is available to the deployment server, so that later we can send it to other machines as well and "Send to indexer". ( Important : in the apps folder it should also remain so that the indices we need for the data are formed on the indexer).
8. Then you need to pre-configure the application.
Go to the directory ... \ Splunk \ etc \ deployment-apps \ Splunk_TA_windows
Create a sub-directory “local” in it ( Important : Always make changes to the configuration files in the local directory).
Copy the inputs.conf file from. .. \ Splunk \ etc \ deployment-apps \ Splunk_TA_windows \ default \ inputs.conf to the local directory.
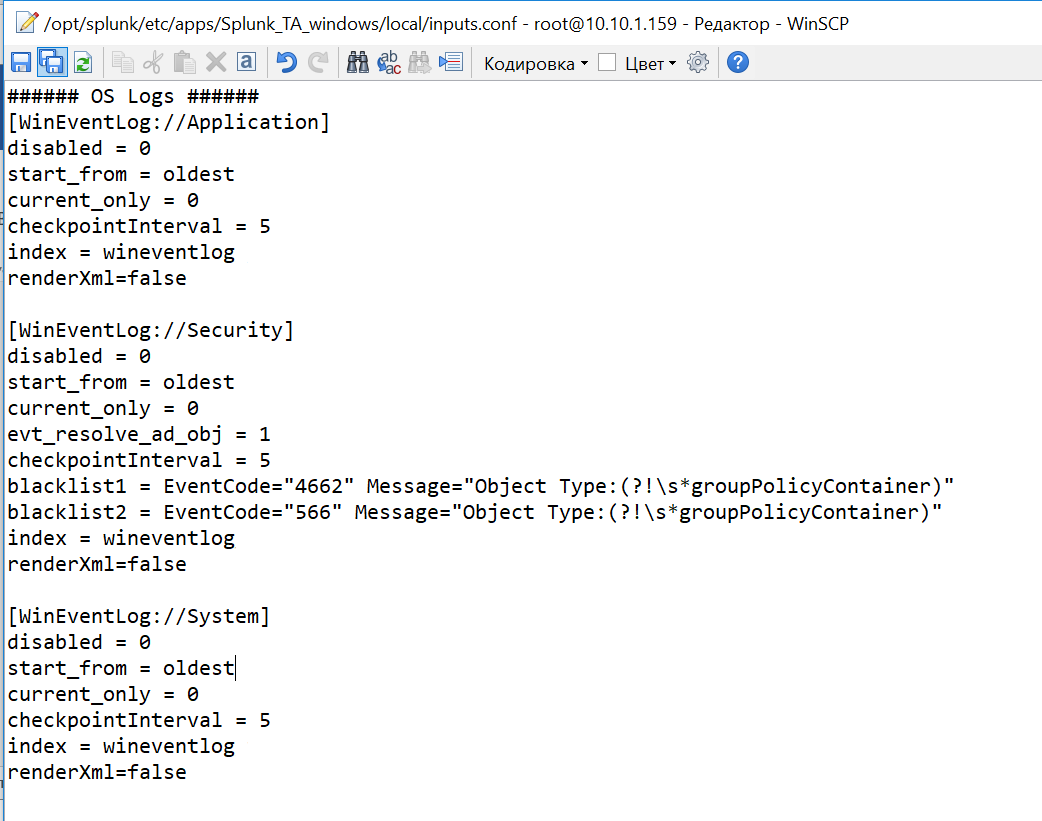
Enable indexing of required data. To do this, we make some changes in the inputs.conf file from the local directory via a text editor. Replace the values of disabled = 1 to disabled = 0 in the required blocks of the file. Let's add system logs by Application, Security, System.
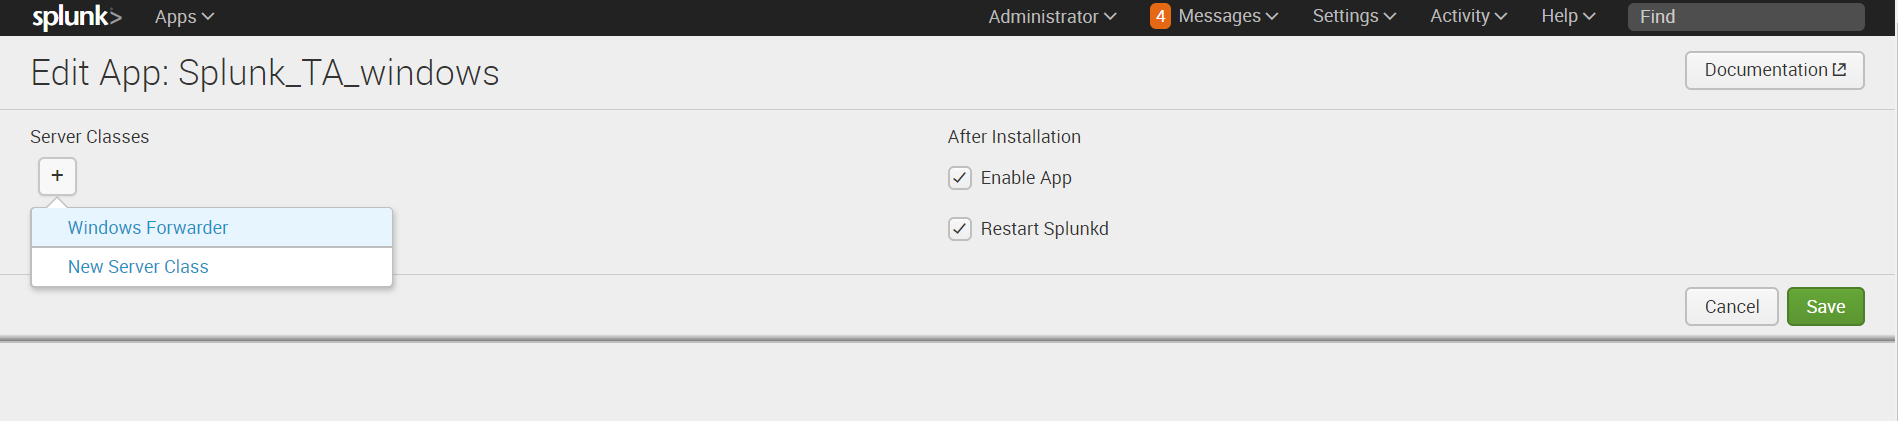
9. Next, on Splunk-indexer, we add the previously created server-class to the application. ( Settings - Forwarder Management - Apps - Splunk_TA_Windows - “+” - Windows Forwarder )
10. Restart the deployment server , this can be done via the command line from the directory ... / splunk / bin :
Check if data is being loaded. ( Settings - Indexes ) They should fall into the wineventlog index. As you can see in our picture, the latest data that was currently loaded has a timestamp 3 minutes ago.

One of the tools to improve security in Linux is the auditd audit subsystem . With its help you can get detailed information about all system events. It is the data generated by this system that we will index in Splunk.
(Code will be submitted for Linux CentOS)
1. Check if there is a pre-installed audit system on the machine, if not install it.
Add a new rule that we will track.
You can check its availability using the function.
The logs generated by auditd fall into the file:
2. Next, install the Universal Forwarder . Find the distribution can be on the link.
It is necessary to download a file of the .rpm format, after which downloading it will be possible to get a wget link.
3. Next, create a new user who will be responsible for working with splunk.
4. Give permissions to the user we just created and run UniversalForwarder on his behalf.
5. We will configure the forwarder and specify the Deployment Server , as well as in the part with Windows, this is the IP address or the name Splunk-indexer /
6. You can check if the forwarder is working as follows:
7. Next, go to Splunk-indexer and install a special Add-on on it, which allows you to transfer logs from Linux. Download the distribution can be on the link .
8. After installation, we find the folder with the application at the following address ../splunk/etc/apps/Splunk_TA_nix . Copy the Splunk_TA_nix folder from the apps to the deployment-apps . To make this application appear as available to the deployment server.
In the ... / deployment-apps / Splunk_TA_nix directory, create the local folder and copy the input.conf file from the ../Splunk_TA_nix/default folder into it.
In the file ... / deployment-apps / Splunk_TA_nix / local / input.conf through a text editor make changes that show the data from which folders we want to collect. In our case, this is / var / log / audit.
In input.conf there is a [monitor: /// var / log] section in which you need to change disabled = 1 to disabled = 0 (Important: make sure that the necessary folder is in whitelist if it doesn’t exist, but you need to add it)
9. Next, check if the Deployment server saw a new client, our Linux machine. ( Settings - Forwarder Management - Clients ).
If it is not there, then it is necessary to check the name (Host name) of the machine, if it matches the name of the indexer machine, then it is necessary to change it, otherwise an error occurs.
10. Then create a new server class related to Linux.
Settings - Forwarder Management - Server Classes - New Server Class
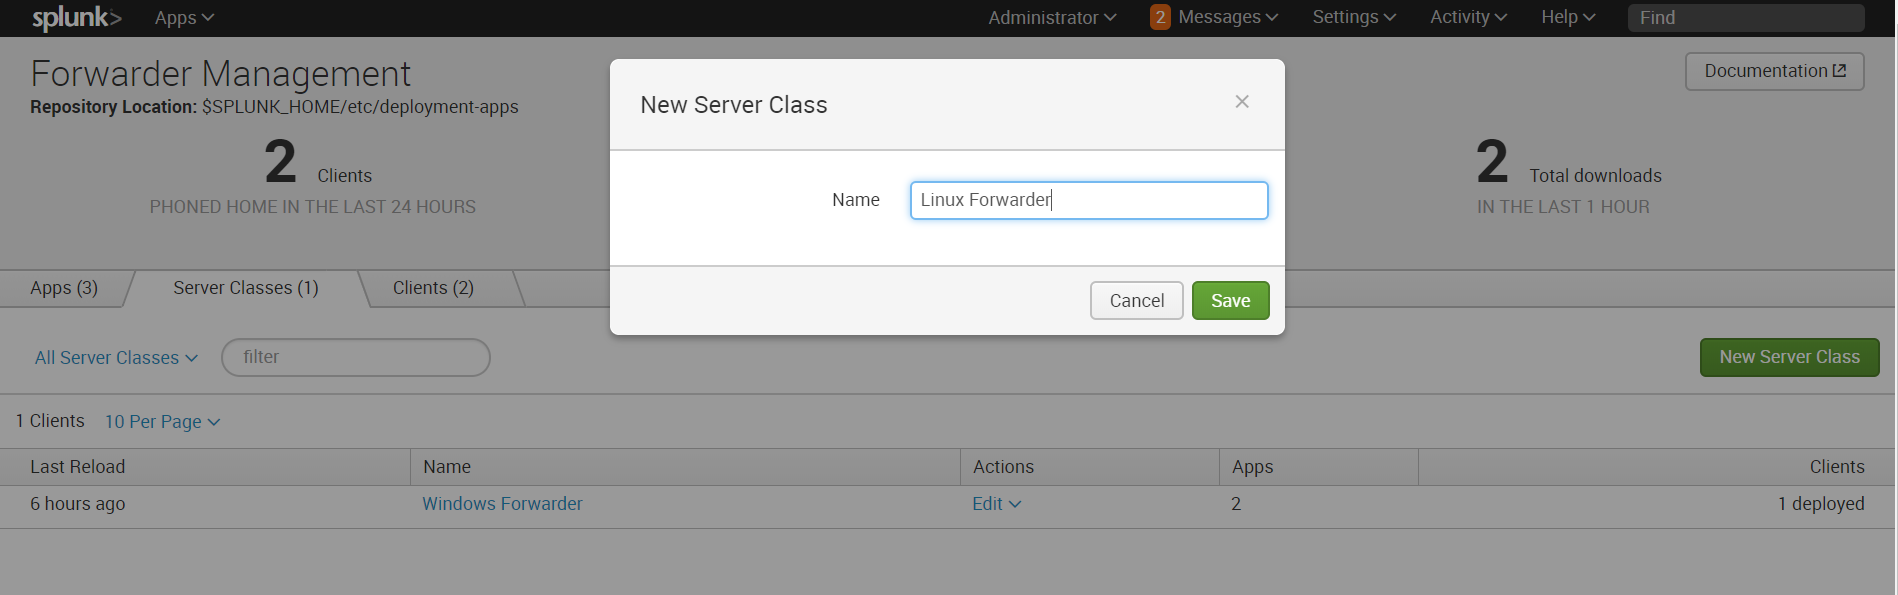
11. Add the “Send to indexer” and “Splunk_TA_nix” applications to this class, and add a Linux machine as a client.
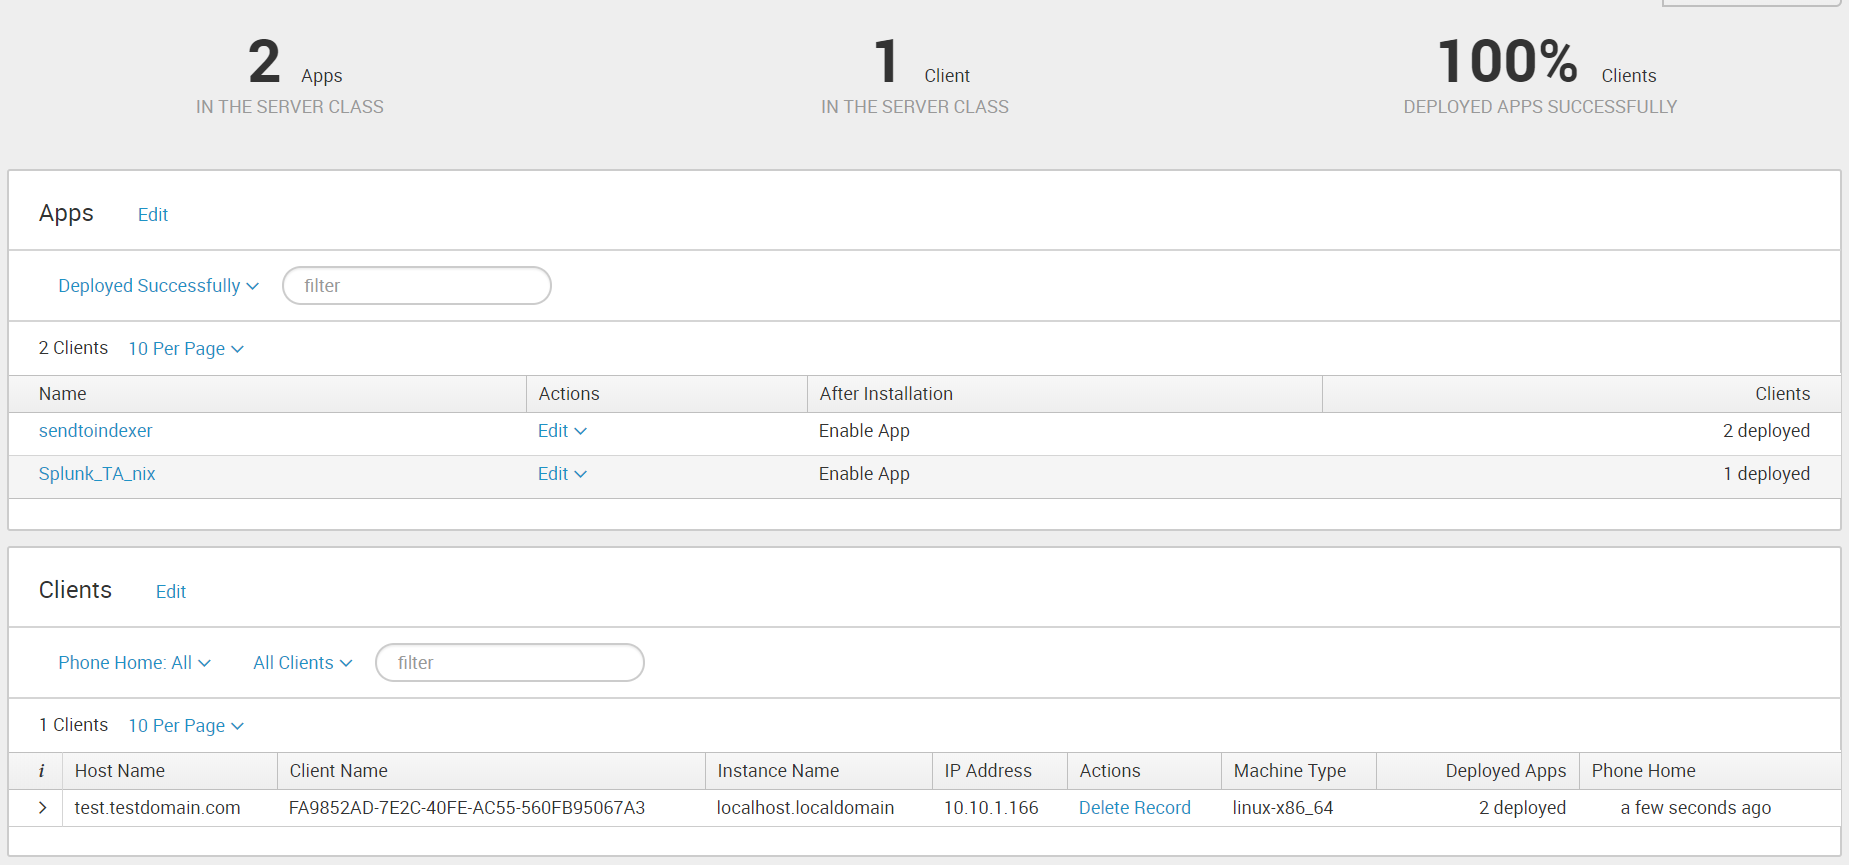
Please note that files will not load if Universal Forwarder (the user under which we use Universal Forwarder) does not have access to the folders that need to be monitored. So you need to take into account this moment and allow access.
12. At the end, you need to restart the deployment serve r, this can be done via the command line from the ... / splunk / bin directory :
After performing the above operations, you will receive Linux logs that will be loaded into the OS index.
Thus, we showed you how to upload your logs from Windows and Linux to Splunk for further analysis and processing. We hope that this information will be useful for you.
We are happy to answer all your questions and comments on this topic. Also, if you are interested in something specifically in this area, or in the field of machine data analysis in general, we are ready to refine the existing solutions for you, for your specific task. To do this, you can write about it in the comments or simply send us a request through the form on our website .
We are the official Premier Splunk Partner .

On June 28, 2018, “ Splunk Getting Started ” will be taught in Moscow , where in 6 hours the participants will receive a theoretical base and practical skills for working in Splunk. Learn more about learning and register at this link .
In this article we will explain step by step how to load data from Windows and Linux into Splunk for further processing and analysis.
Setting up basic infrastructure
In order to start collecting data we need the following system elements:
')
- Splunk - Indexer
- Windows server
- Linux server
In order to upload logs to Splunk, you must first configure the indexer, this will require:
• Install and configure Splunk-indexer to receive data;
First of all, you'll need Splunk on a machine that is our indexer. If you do not have Splunk installed, you can read more about how and what systems you can install it here .
After installation, you must configure the indexer to receive data:
Settings-Forwarding and Receiving , then in the Receive data section add a new configuration: Configure receiving .
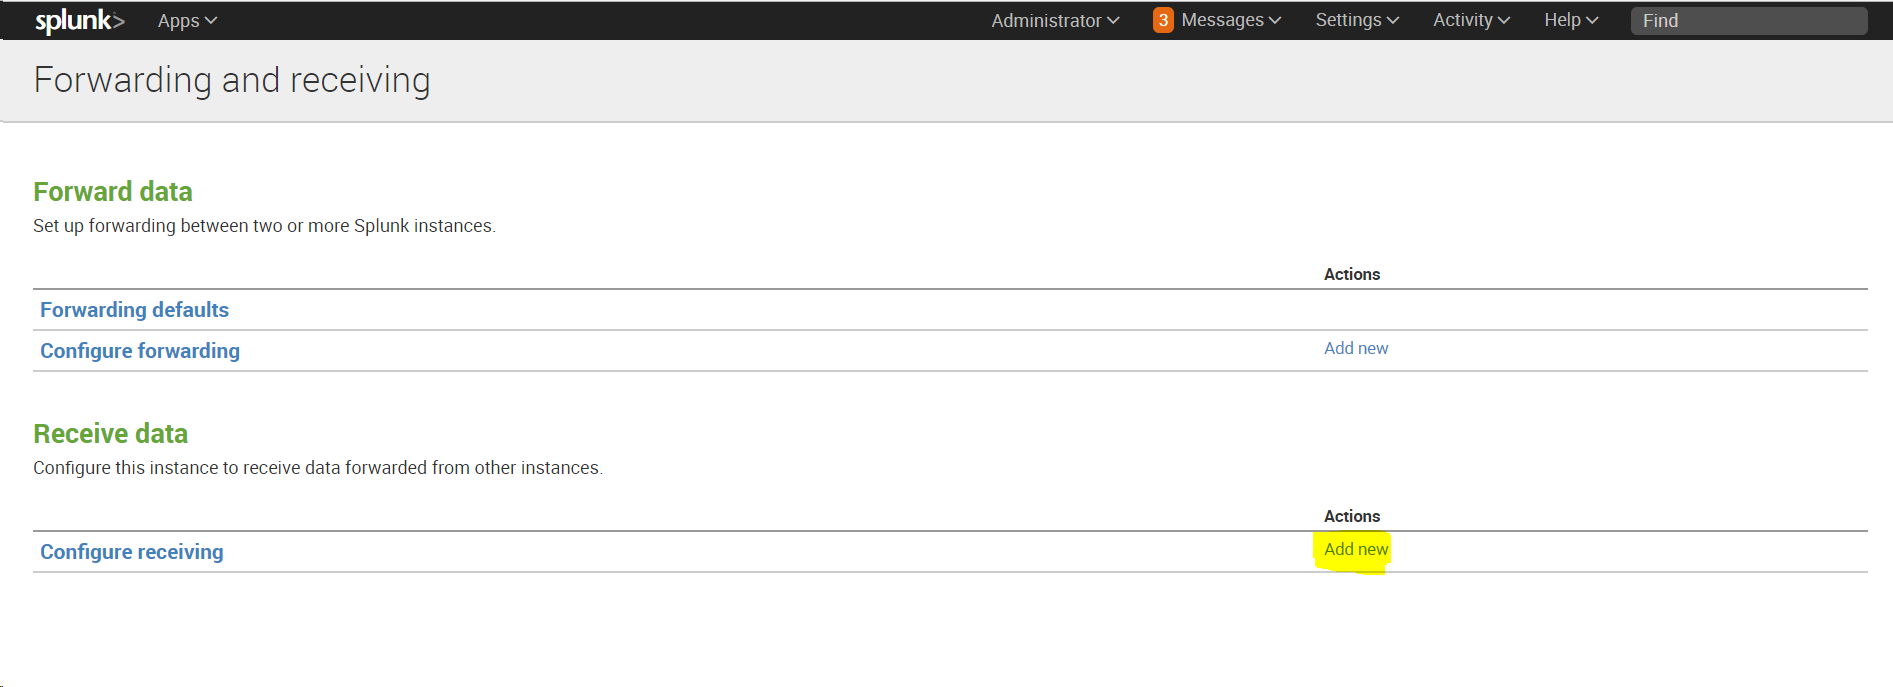
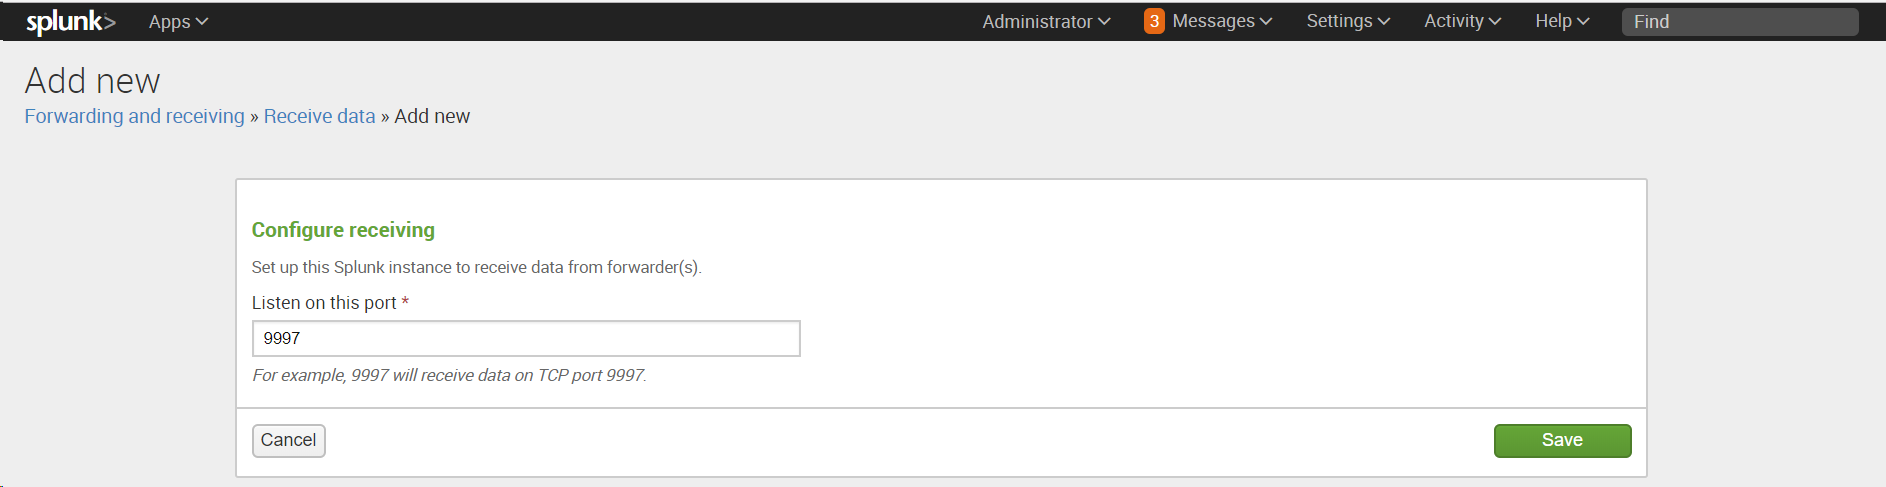
After installation, you must configure the indexer to receive data:
Settings-Forwarding and Receiving , then in the Receive data section add a new configuration: Configure receiving .
• Create an application “Send to indexer”, which will configure the transfer to all sources that send data to the indexer;
This application is necessary in order to simplify the management of data sources when there are many of these sources or access to them for making changes is difficult. Also, the application will allow you not to make potentially erroneous configuration changes on many hosts, limiting it to changing only in one place.
Create an application: Apps - Manage Apps - Add New
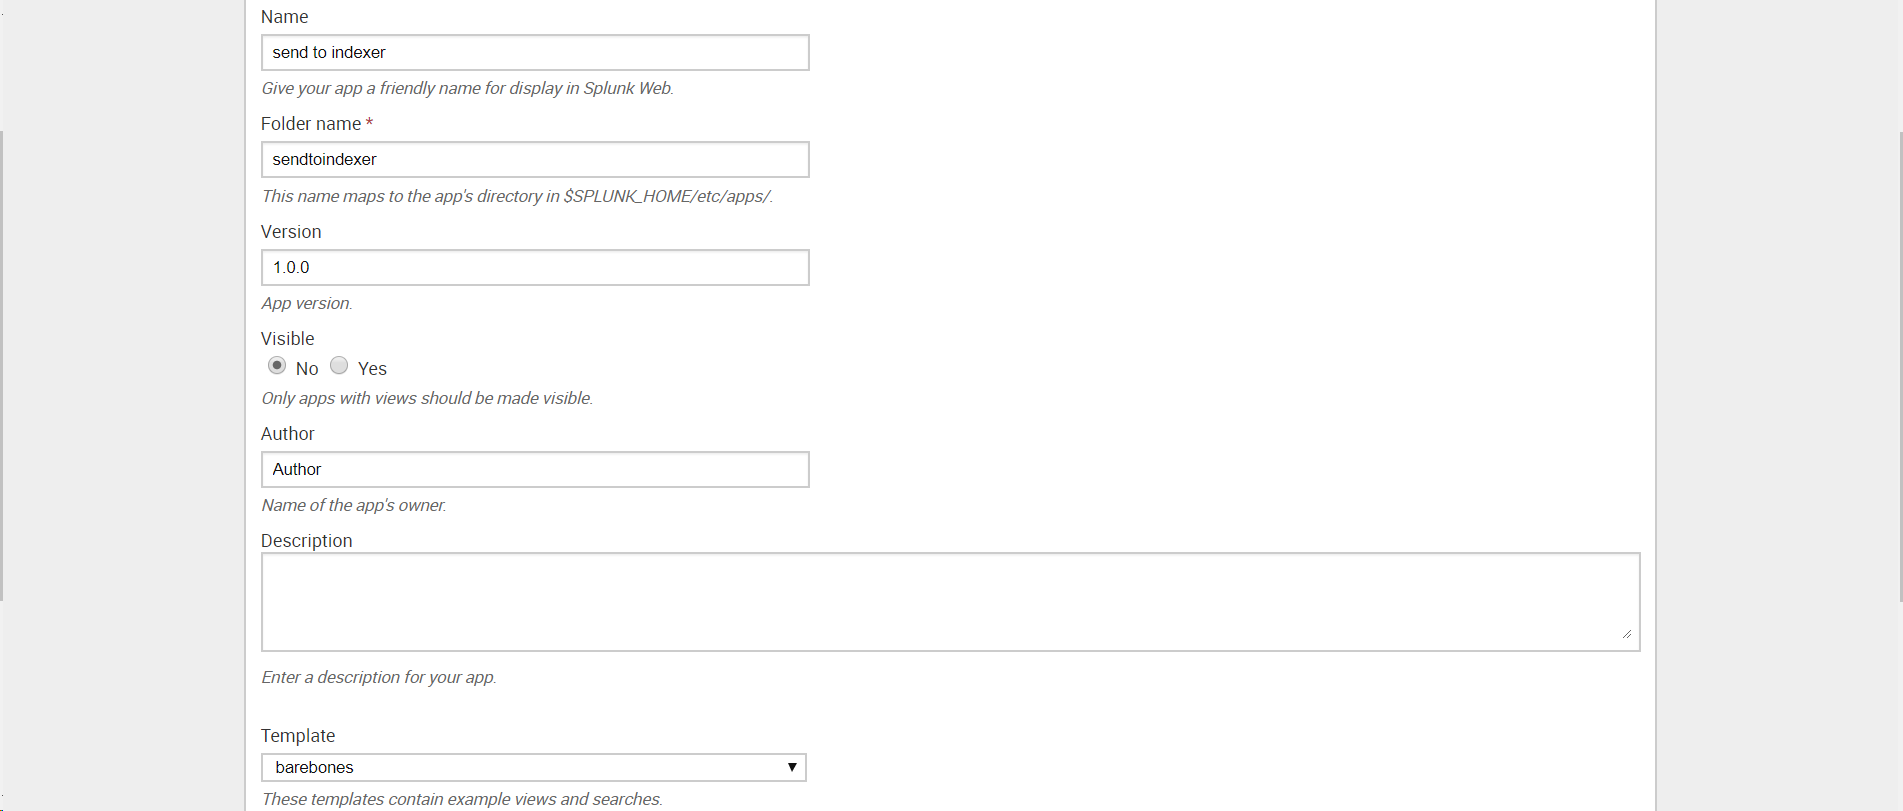
Create an application: Apps - Manage Apps - Add New
• Generate the configuration file outputs.conf
After creating the application, it is necessary to generate the configuration file outputs.conf (You can read more about that file on the official Splunk website )
In the text editor, enter the following text, replacing indexer_hostname_or_ip_address with the host name or indexer IP address and the receiving port set in the previous step:
Save as outputs.conf and add to the \ etc \ apps \ sendtoindexer \ local folder (you must create the local folder).
In the text editor, enter the following text, replacing indexer_hostname_or_ip_address with the host name or indexer IP address and the receiving port set in the previous step:
[tcpout] defaultGroup = default-autolb-group [tcpout:default-autolb-group] server = <indexer_hostname_or_ip_address>:9997 [tcpout-server://<indexer_hostname_or_ip_address>:9997] Save as outputs.conf and add to the \ etc \ apps \ sendtoindexer \ local folder (you must create the local folder).
• Configure the Deployment Server to manage the Send to indexer application and other applications;
Deployment Server is required in order to distribute applications and configurations to all related Splunk instances on other hosts. To activate the Deployment Server, you must place at least one application in the % SPLUNK_HOME% \ etc \ deployment-apps folder . In our case, we moved the Send to indexer application there. (It was moved, not copied, as we will do next with other applications.)
At this stage, we finish the preliminary adjustment of the indexer and proceed to installing the agents on Windows and Linux machines.
WINDOWS
A universal tool for uploading logs is a special agent - Splunk Universal Forwarder . Universal Forwarder is a version of Splunk Enterprise with significantly limited functionality, the only task of which is to collect data from the host and send it.
Download it at this link .
The picture above shows that Universal Forwarder can be installed on both Windows and Linux, Solaris and other operating systems.
1. Install Universal Forwarder
We specify the IP address or the name of the Splunk indexer as the Deployment Server , where we created the application “Send to indexer”. The default port is 8089 . Leave the Receiving Indexer section empty, since these functions will be performed by “Send to indexer”.
2. The next step we need to go back to Splunk and define the server class for the application "Send to indexer".
The server class is something like a rule in which we specify which applications we will distribute between which target client machines. The criteria for the formation of different server classes can be the type of machine, operating system, geographical area or type of application, and the classes can overlap with each other. (You can read more on the official website )
Settings - Forwarder Management - edit action - add new classes.
3. After saving, you will be prompted to add applications that we will send and target systems, the so-called clients, to whom we will send them.
Add " Send to indexer " in the application section.
4. Then add the client. The client will be our Windows machine on which we installed Universal Forwarder. If Universal Forwarder was installed correctly, then the machine should appear in the list of clients connected to the Deployment Server . We put it in Include (whitelist) .
5. Check whether everything works correctly, looking at the contents of the index _internal . After adding “Send to indexer” to the Universal Forwarder server class, it starts sending its internal logs there. Also in this index, we can further monitor whether our agents are working properly.
6. Next, download a special Add-on from SplunkBase , which allows you to collect data on the work of Windows.
7. Install the application on Splunk-Indexer ( Apps - Manage Apps - Install app from file )
By default, it is installed in the directory ... \ Splunk \ etc \ apps \ Splunk_TA_windows , but we need to copy it to the deployment-apps folder so that this application is available to the deployment server, so that later we can send it to other machines as well and "Send to indexer". ( Important : in the apps folder it should also remain so that the indices we need for the data are formed on the indexer).
8. Then you need to pre-configure the application.
Go to the directory ... \ Splunk \ etc \ deployment-apps \ Splunk_TA_windows
Create a sub-directory “local” in it ( Important : Always make changes to the configuration files in the local directory).
Copy the inputs.conf file from. .. \ Splunk \ etc \ deployment-apps \ Splunk_TA_windows \ default \ inputs.conf to the local directory.
Enable indexing of required data. To do this, we make some changes in the inputs.conf file from the local directory via a text editor. Replace the values of disabled = 1 to disabled = 0 in the required blocks of the file. Let's add system logs by Application, Security, System.
9. Next, on Splunk-indexer, we add the previously created server-class to the application. ( Settings - Forwarder Management - Apps - Splunk_TA_Windows - “+” - Windows Forwarder )
10. Restart the deployment server , this can be done via the command line from the directory ... / splunk / bin :
./splunk reload deploy-server Check if data is being loaded. ( Settings - Indexes ) They should fall into the wineventlog index. As you can see in our picture, the latest data that was currently loaded has a timestamp 3 minutes ago.
LINUX
One of the tools to improve security in Linux is the auditd audit subsystem . With its help you can get detailed information about all system events. It is the data generated by this system that we will index in Splunk.
(Code will be submitted for Linux CentOS)
1. Check if there is a pre-installed audit system on the machine, if not install it.
sudo yum list audit audit-libs sudo yum install audit audit-libs Add a new rule that we will track.
sudo auditctl -w /etc/ -p wa -k test_audit You can check its availability using the function.
auditctl -l The logs generated by auditd fall into the file:
cd /var/log/audit/audit.log cat audit.log 2. Next, install the Universal Forwarder . Find the distribution can be on the link.
It is necessary to download a file of the .rpm format, after which downloading it will be possible to get a wget link.
yum install wget cd /tmp/ wget -O splunkforwarder-7.0.3-fa31da744b51-linux-2.6-x86_64.rpm 'https://www.splunk.com/bin/splunk/DownloadActivityServlet?architecture=x86_64&platform=linux&version=7.0.3&product=universalforwarder&filename=splunkforwarder-7.0.3-fa31da744b51-linux-2.6-x86_64.rpm&wget=true' rpm -i splunkforwarder-7.0.3-fa31da744b51-linux-2.6-x86_64.rpm 3. Next, create a new user who will be responsible for working with splunk.
adduser splunk 4. Give permissions to the user we just created and run UniversalForwarder on his behalf.
chown -R splunk:splunk /opt/splunkforwarder/ /opt/splunkforwarder/bin/splunk enable boot-start -user splunk 5. We will configure the forwarder and specify the Deployment Server , as well as in the part with Windows, this is the IP address or the name Splunk-indexer /
/opt/splunkforwarder/bin/splunk set deploy-poll <IP- Splunk Indexer> :8089 -auth admin:changeme /opt/splunkforwarder/bin/splunk edit user admin -password < > -auth admin:changeme /opt/splunkforwarder/bin/splunk restart 6. You can check if the forwarder is working as follows:
cd /opt/splunkforwarder/bin/ ./splunk status 7. Next, go to Splunk-indexer and install a special Add-on on it, which allows you to transfer logs from Linux. Download the distribution can be on the link .
8. After installation, we find the folder with the application at the following address ../splunk/etc/apps/Splunk_TA_nix . Copy the Splunk_TA_nix folder from the apps to the deployment-apps . To make this application appear as available to the deployment server.
In the ... / deployment-apps / Splunk_TA_nix directory, create the local folder and copy the input.conf file from the ../Splunk_TA_nix/default folder into it.
In the file ... / deployment-apps / Splunk_TA_nix / local / input.conf through a text editor make changes that show the data from which folders we want to collect. In our case, this is / var / log / audit.
In input.conf there is a [monitor: /// var / log] section in which you need to change disabled = 1 to disabled = 0 (Important: make sure that the necessary folder is in whitelist if it doesn’t exist, but you need to add it)
9. Next, check if the Deployment server saw a new client, our Linux machine. ( Settings - Forwarder Management - Clients ).
If it is not there, then it is necessary to check the name (Host name) of the machine, if it matches the name of the indexer machine, then it is necessary to change it, otherwise an error occurs.
cd /etc/hosts cat hosts hostname test.testdomain.com 10. Then create a new server class related to Linux.
Settings - Forwarder Management - Server Classes - New Server Class
11. Add the “Send to indexer” and “Splunk_TA_nix” applications to this class, and add a Linux machine as a client.
Please note that files will not load if Universal Forwarder (the user under which we use Universal Forwarder) does not have access to the folders that need to be monitored. So you need to take into account this moment and allow access.
12. At the end, you need to restart the deployment serve r, this can be done via the command line from the ... / splunk / bin directory :
./splunk reload deploy-server After performing the above operations, you will receive Linux logs that will be loaded into the OS index.
Conclusion
Thus, we showed you how to upload your logs from Windows and Linux to Splunk for further analysis and processing. We hope that this information will be useful for you.
We are happy to answer all your questions and comments on this topic. Also, if you are interested in something specifically in this area, or in the field of machine data analysis in general, we are ready to refine the existing solutions for you, for your specific task. To do this, you can write about it in the comments or simply send us a request through the form on our website .
We are the official Premier Splunk Partner .
PS
On June 28, 2018, “ Splunk Getting Started ” will be taught in Moscow , where in 6 hours the participants will receive a theoretical base and practical skills for working in Splunk. Learn more about learning and register at this link .
Source: https://habr.com/ru/post/352944/
All Articles