How to expand the functionality of Zabbix and not pay for licenses
The number of free software is growing every year. Build your own functional monitoring system of the available tools is becoming easier. Today I will talk about how to implement the functionality of commercial monitoring systems by means of free tools. We will make a heat map of business services, a geographic map for distributed objects, integration with Zabbix and a management interface for this design. If you wish, you can repeat all these steps yourself and implement a similar solution. Under the cut description of the concept.
Meet - this is "Mantra" (in place of the inscription Mantra can be anything). I will talk separately about each ingredient. Let's start with the interface.
What should have an interface for effective management of the entire structure? At a minimum, a database for storing settings and a convenient, well-documented development engine. I do not know what you thought, but our choice fell on Laravel. This is what the main interface looks like.
')
The first item is Business Services. Here we add objects that need to be monitored on the heat map. If you assign coordinates to the object, it will also appear on the geographic map. When adding, you need to specify the service parent to which the child is attached. In the comments, you can set the text, which will then be displayed in the pop-up menu of the thermal or geographic map.
The second item is “Data Sources”. Choose a system from which events will drag. We have configured integration through Zabbix API, but here you can add an unlimited number of data sources: Nagios, Zenoss, SCOM and others - depends on your needs.
The third point - "Sources of events." To each square of the heat map you need to bind something from the monitoring system, something that affects the status of the object. In the case of Zabbix, these are triggers. For a different monitoring system there will be something else. In the settings of the “Event Sources” the business service is tied to the trigger.
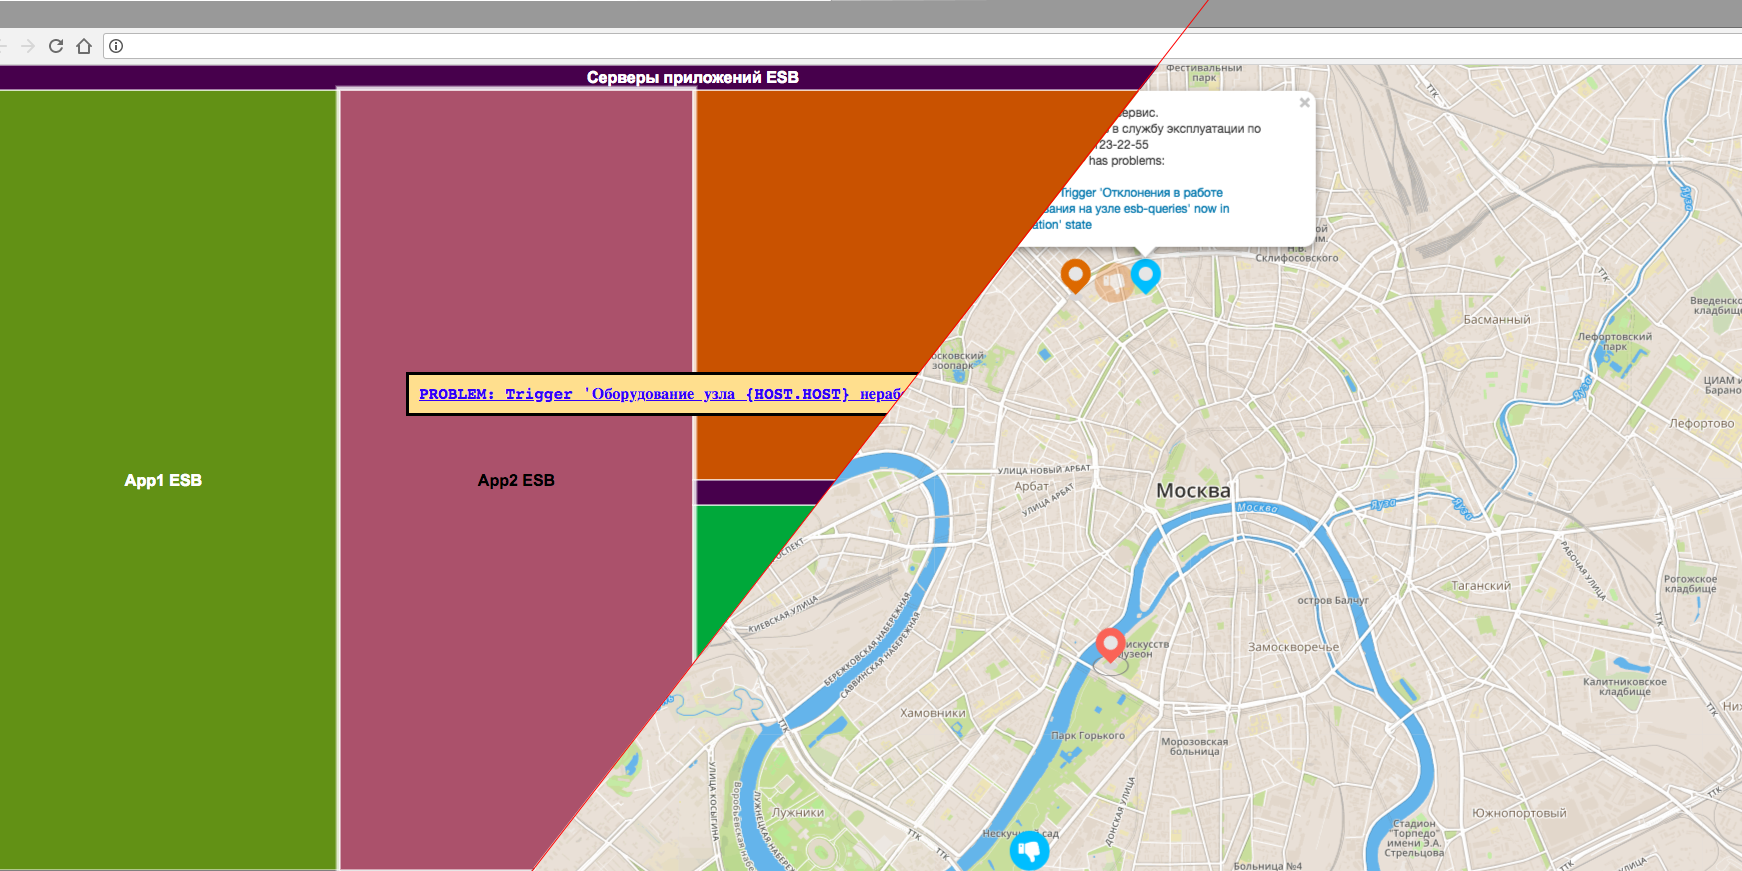
Now when the trigger is triggered, the square on the heat map will be tinted to the color corresponding to the event. When you hover over an object, a pop-up menu appears with the text of the event and a link to the alarm trigger in Zabbix.
The interface is based on the free Google Charts framework (see the jsfiddle demo ). Nothing more suitable for this was found. There is a similar solution for D3js , but there is no possibility to tune the influence of multi-level objects on each other. Immediately I warn you that Google Charts pulls the google libraries, which lie in the vast googleapis.com. So make a completely offline solution does not work. On Github I saw these libraries in the downloaded form, but it is very difficult to vouch for their relevance.
The display of the object tree is configured in a flat file or database.
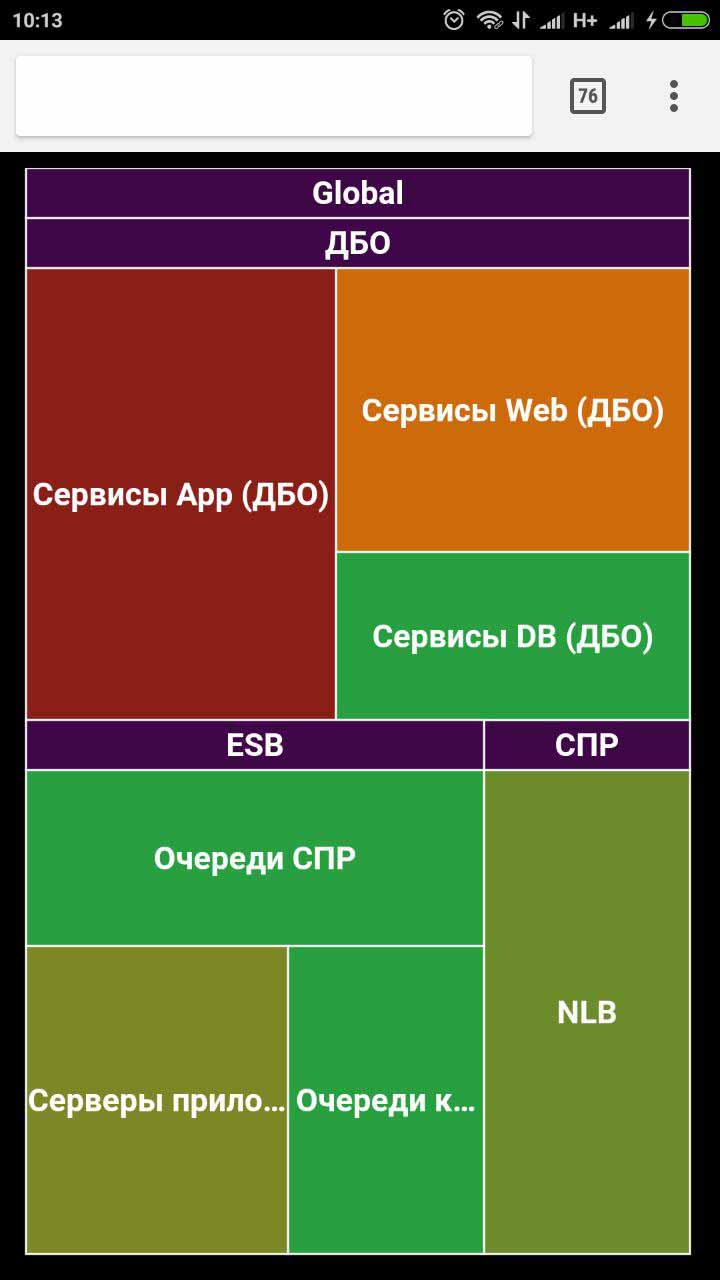
Another additional advantage of Google Charts is the responsive design by default. Looks equally good on the desktop and mobile phone.
This map visualizes the connections within your service or business process. If you use the approach of decoupling business processes from business services , you will need two parallel structures that can be visualized on two separate heatmaps to avoid disturbing the trivia guide.
The size of squares is influenced by the weight of objects, which can be set in properties. By default, the weight of all squares is the same.
To create a geographic map with statuses of objects, it is best to use the most banal OpenStreetMap. Google and Yandex are asking too much to use their cards (I’m talking about money and tokens).
You can simply put objects on the map. And you can combine them into clusters when changing the scale and assign the color to the resulting cluster according to the highest severity of the event on the nested objects. On Github, you'll find the right solution (or you can see it in action at jsfiddle ). As in the case of a heat map, you can also go to a geographic map to a trigger in Zabbix using the link from the object. Under the mobile phone also adapts.

Authorization was made for the whole interface and even a simple role model: administrators and users. There are plans to add some kind of event console and something like Selenium or Casper.js for transactional monitoring to the same interface. If you have questions - ask in the comments or a personal message. I can personally send you a link to what happened with us. I will not publish here, I am afraid of habraeffekt.
Meet - this is "Mantra" (in place of the inscription Mantra can be anything). I will talk separately about each ingredient. Let's start with the interface.
Management interface
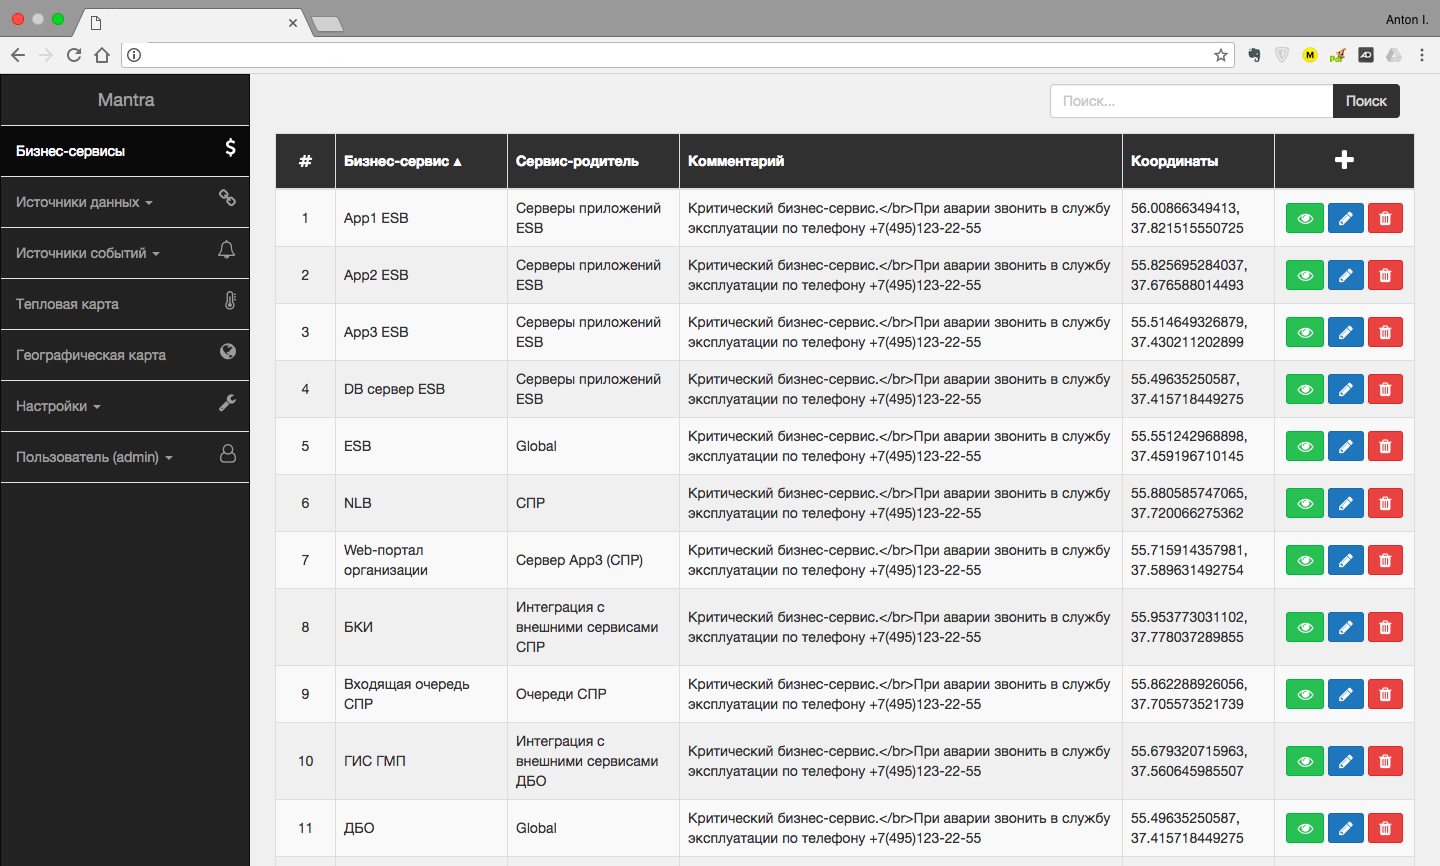
What should have an interface for effective management of the entire structure? At a minimum, a database for storing settings and a convenient, well-documented development engine. I do not know what you thought, but our choice fell on Laravel. This is what the main interface looks like.
')
The first item is Business Services. Here we add objects that need to be monitored on the heat map. If you assign coordinates to the object, it will also appear on the geographic map. When adding, you need to specify the service parent to which the child is attached. In the comments, you can set the text, which will then be displayed in the pop-up menu of the thermal or geographic map.
The second item is “Data Sources”. Choose a system from which events will drag. We have configured integration through Zabbix API, but here you can add an unlimited number of data sources: Nagios, Zenoss, SCOM and others - depends on your needs.
The third point - "Sources of events." To each square of the heat map you need to bind something from the monitoring system, something that affects the status of the object. In the case of Zabbix, these are triggers. For a different monitoring system there will be something else. In the settings of the “Event Sources” the business service is tied to the trigger.
Now when the trigger is triggered, the square on the heat map will be tinted to the color corresponding to the event. When you hover over an object, a pop-up menu appears with the text of the event and a link to the alarm trigger in Zabbix.
Heat map
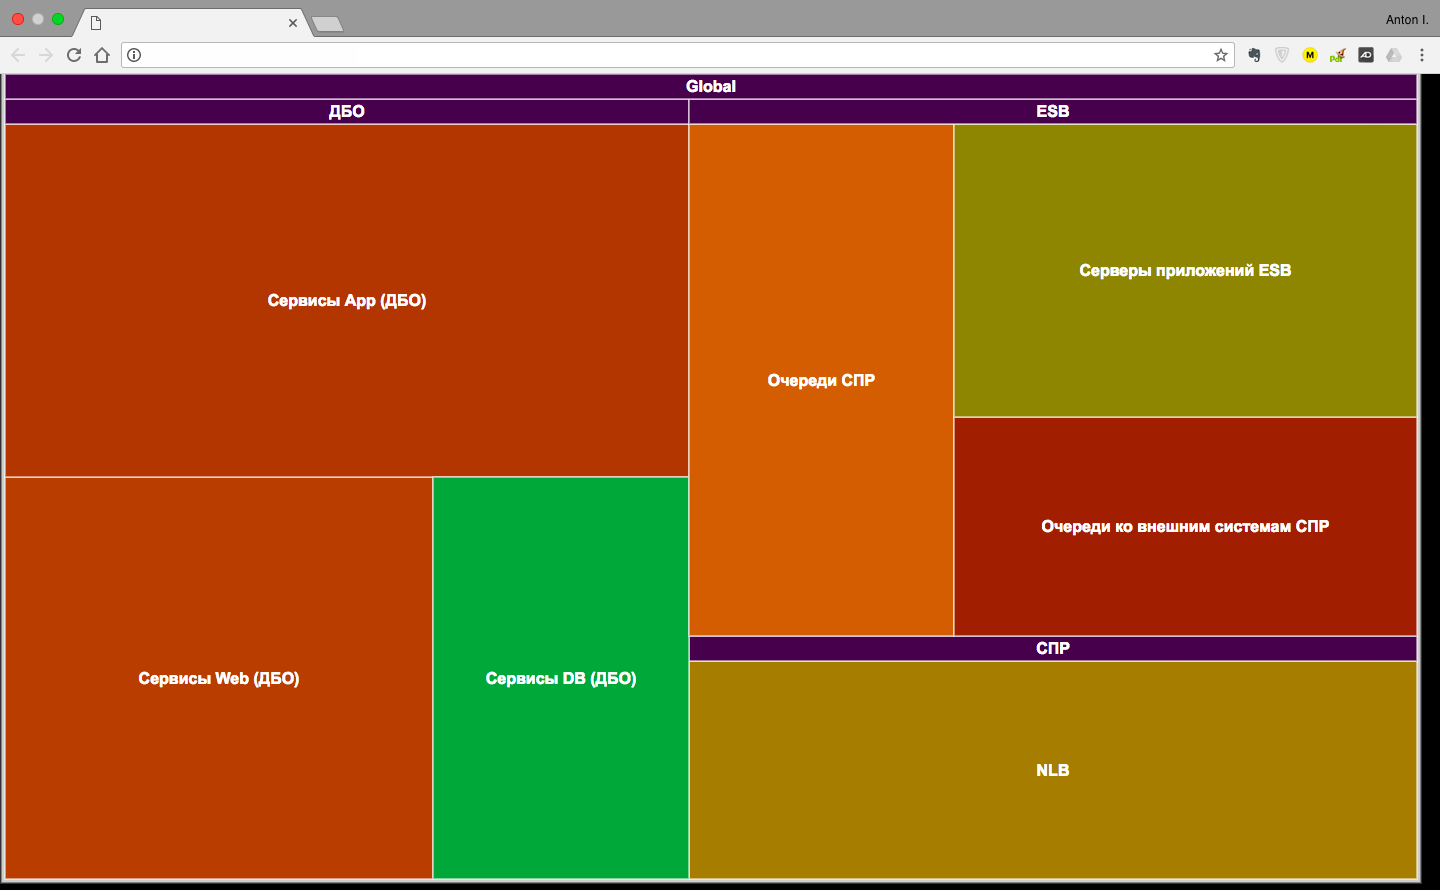
The interface is based on the free Google Charts framework (see the jsfiddle demo ). Nothing more suitable for this was found. There is a similar solution for D3js , but there is no possibility to tune the influence of multi-level objects on each other. Immediately I warn you that Google Charts pulls the google libraries, which lie in the vast googleapis.com. So make a completely offline solution does not work. On Github I saw these libraries in the downloaded form, but it is very difficult to vouch for their relevance.
The display of the object tree is configured in a flat file or database.
HTML sample
<html> <head> <script type="text/javascript" src="https://www.gstatic.com/charts/loader.js"></script> <script type="text/javascript"> google.charts.load('current', {'packages':['treemap']}); google.charts.setOnLoadCallback(drawChart); function drawChart() { var data = google.visualization.arrayToDataTable([ ['Location','Parent','Markettradevolume(size)','Marketincrease/decrease(color)'], ['Global',null,0,0], ['America','Global',0,0], ['Europe','Global',0,0], ['Asia','Global',0,0], ['Australia','Global',0,0], ['Africa','Global',0,0], ['Brazil','America',11,10], ['USA','America',52,31], ['Mexico','America',24,12], ['Canada','America',16,-23], ['France','Europe',42,-11], ['Germany','Europe',31,-2], ['Sweden','Europe',22,-13], ['Italy','Europe',17,4], ['UK','Europe',21,-5], ['China','Asia',36,4], ['Japan','Asia',20,-12], ['India','Asia',40,63], ['Laos','Asia',4,34], ['Mongolia','Asia',1,-5], ['Israel','Asia',12,24], ['Iran','Asia',18,13], ['Pakistan','Asia',11,-52], ['Egypt','Africa',21,0], ['S.Africa','Africa',30,43], ['Sudan','Africa',12,2], ['Congo','Africa',10,12], ['Zaire','Africa',8,10] ]); tree = new google.visualization.TreeMap(document.getElementById('chart_div')); tree.draw(data, { minColor: '#f00', midColor: '#ddd', maxColor: '#0d0', headerHeight: 15, fontColor: 'black', showScale: true }); } </script> </head> <body> <div id="chart_div" style="width: 900px; height: 500px;"></div> </body> </html> Another additional advantage of Google Charts is the responsive design by default. Looks equally good on the desktop and mobile phone.
This map visualizes the connections within your service or business process. If you use the approach of decoupling business processes from business services , you will need two parallel structures that can be visualized on two separate heatmaps to avoid disturbing the trivia guide.
The size of squares is influenced by the weight of objects, which can be set in properties. By default, the weight of all squares is the same.
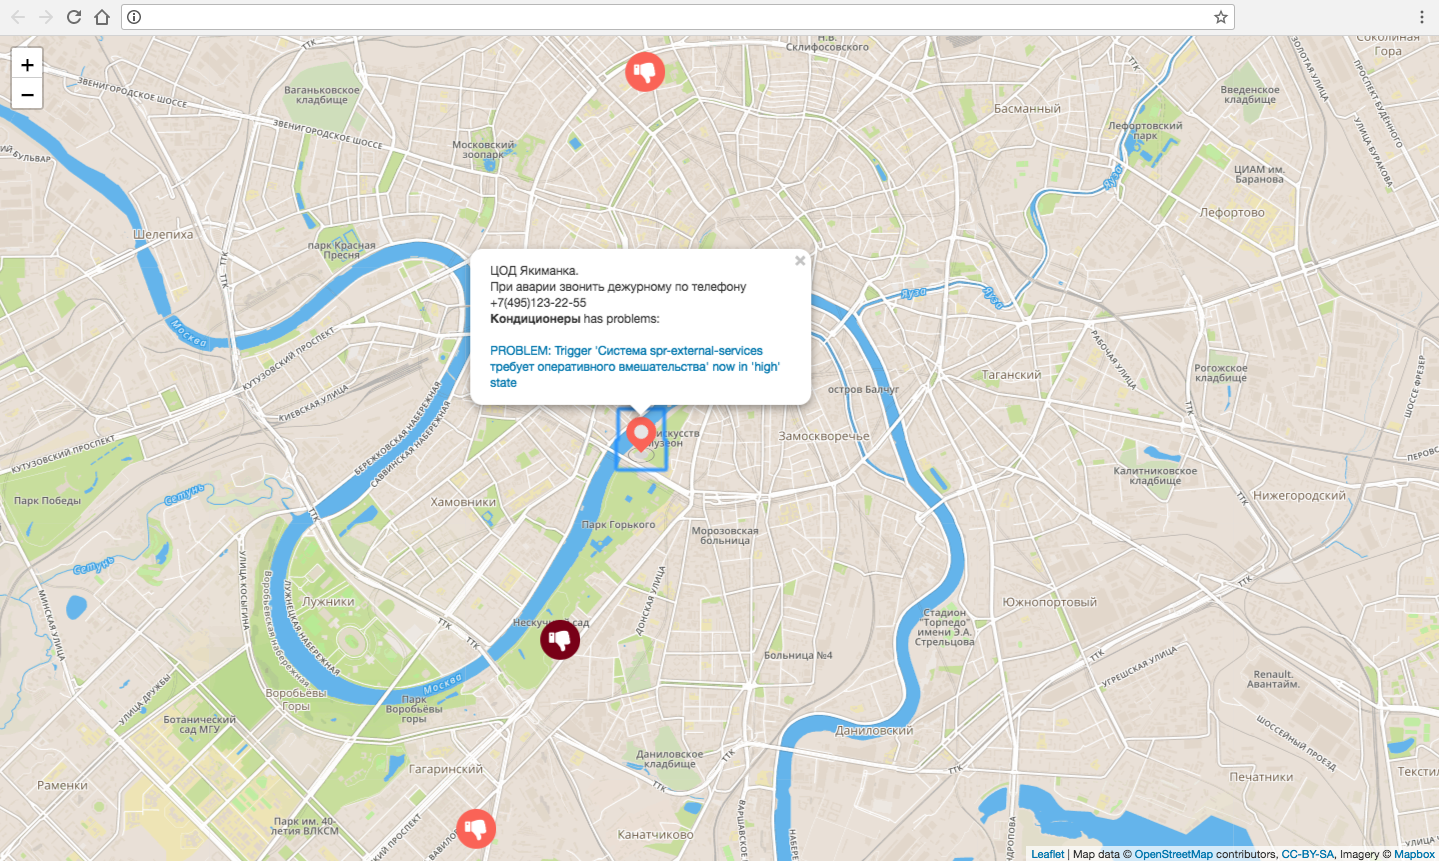
Geographic map
To create a geographic map with statuses of objects, it is best to use the most banal OpenStreetMap. Google and Yandex are asking too much to use their cards (I’m talking about money and tokens).
You can simply put objects on the map. And you can combine them into clusters when changing the scale and assign the color to the resulting cluster according to the highest severity of the event on the nested objects. On Github, you'll find the right solution (or you can see it in action at jsfiddle ). As in the case of a heat map, you can also go to a geographic map to a trigger in Zabbix using the link from the object. Under the mobile phone also adapts.
Authorization was made for the whole interface and even a simple role model: administrators and users. There are plans to add some kind of event console and something like Selenium or Casper.js for transactional monitoring to the same interface. If you have questions - ask in the comments or a personal message. I can personally send you a link to what happened with us. I will not publish here, I am afraid of habraeffekt.
Source: https://habr.com/ru/post/352822/
All Articles